
15
w
WHAT’S NEW IN THE SEVENTH EDITION:
There is a new
In the News
feature on “Actual Economists and Virtual Realities.” Figure A-1 has been
updated.
LEARNING OBJECTIVES:
how economists apply the methods of science.
how assumptions and models can shed light on the world.
the difference between microeconomics and macroeconomics.
the difference between positive and normative statements.
the role of economists in making policy.
why economists sometimes disagree with one another.
CONTEXT AND PURPOSE:
gain from trade.
The purpose of Chapter 2 is to familiarize students with how economists approach economic
problems. With practice, they will learn how to approach similar problems in this dispassionate systematic
way. They will see how economists employ the scientific method, the role of assumptions in model
building, and the application of two specific economic models. Students will also learn the important
2
THINKING LIKE AN ECONOMIST
16 ❖ Chapter 2/Thinking Like an Economist
KEY POINTS:
The field of economics is divided into two subfields: microeconomics and macroeconomics.
Microeconomists study decision making by households and firms and the interaction among
households and firms in the marketplace. Macroeconomists study the forces and trends that affect
the economy as a whole.
about how the world
ought to be
. When economists make normative statements, they are acting
more as policy advisers than as scientists.
CHAPTER OUTLINE:
I. The Economist as Scientist
A. Economists Follow the Scientific Method.
1. Observations help us to develop theory.
3. Using data to evaluate theories is more difficult in economics than in physical science
data are available.
4. Thus, economists pay close attention to the natural experiments offered by history.
B. Assumptions Make the World Easier to Understand.
1. Example: to understand international trade, it may be helpful to start out assuming that
number of countries and goods.
3. Economists often use assumptions that are somewhat unrealistic but will have small effects
on the actual outcome of the answer.
Chapter 2/Thinking Like an Economist ❖ 17
2. The goal of a model is to simplify reality in order to increase our understanding. This is
where the use of assumptions is helpful.
To illustrate to the class how simple but unrealistic models can be useful, bring a
road map to class. Point out how unrealistic it is. For example, it does not show
where all of the stop signs, gas stations, or restaurants are located. It assumes that
the earth is flat and two-dimensional. But, despite these simplifications, a map
usually helps travelers get from one place to another. Thus, it is a good model.
Chapter 2/Thinking Like an Economist ❖ 19
ALTERNATIVE CLASSROOM EXAMPLE:
A small country produces two goods: mp3 players and music downloads. Points on a
production possibilities frontier can be shown in a table or a graph:
A
B
C
D
E
mp3 Players
0
100
200
300
400
Music Downloads
70,000
60,000
45,000
25,000
0
The production possibilities frontier should be drawn from the numbers above.
players produced by 100:
between 0 and 100
between 100 and 200
between 200 and 300
between 300 and 400
You may want to include time dimensions for variables. This will help students to
realize that a new production possibilities frontier occurs for each period. Thus, the
axes show the levels of output per period.
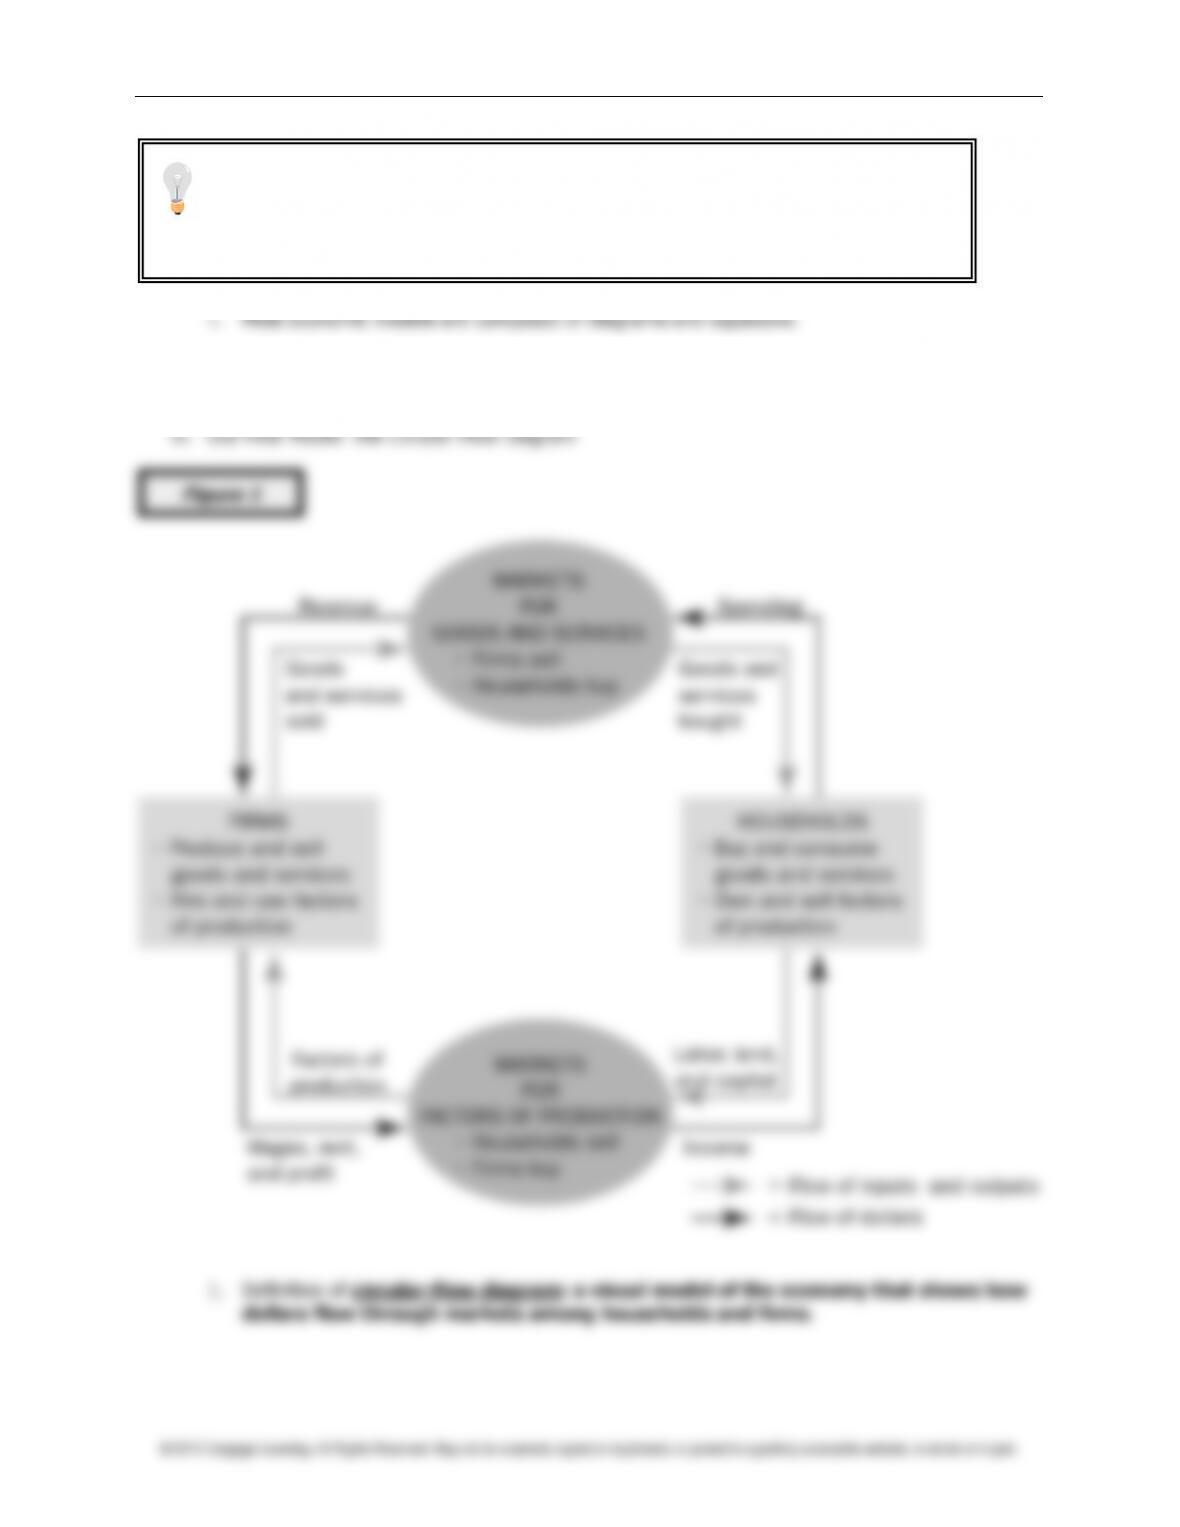
Figure 2
20 ❖ Chapter 2/Thinking Like an Economist
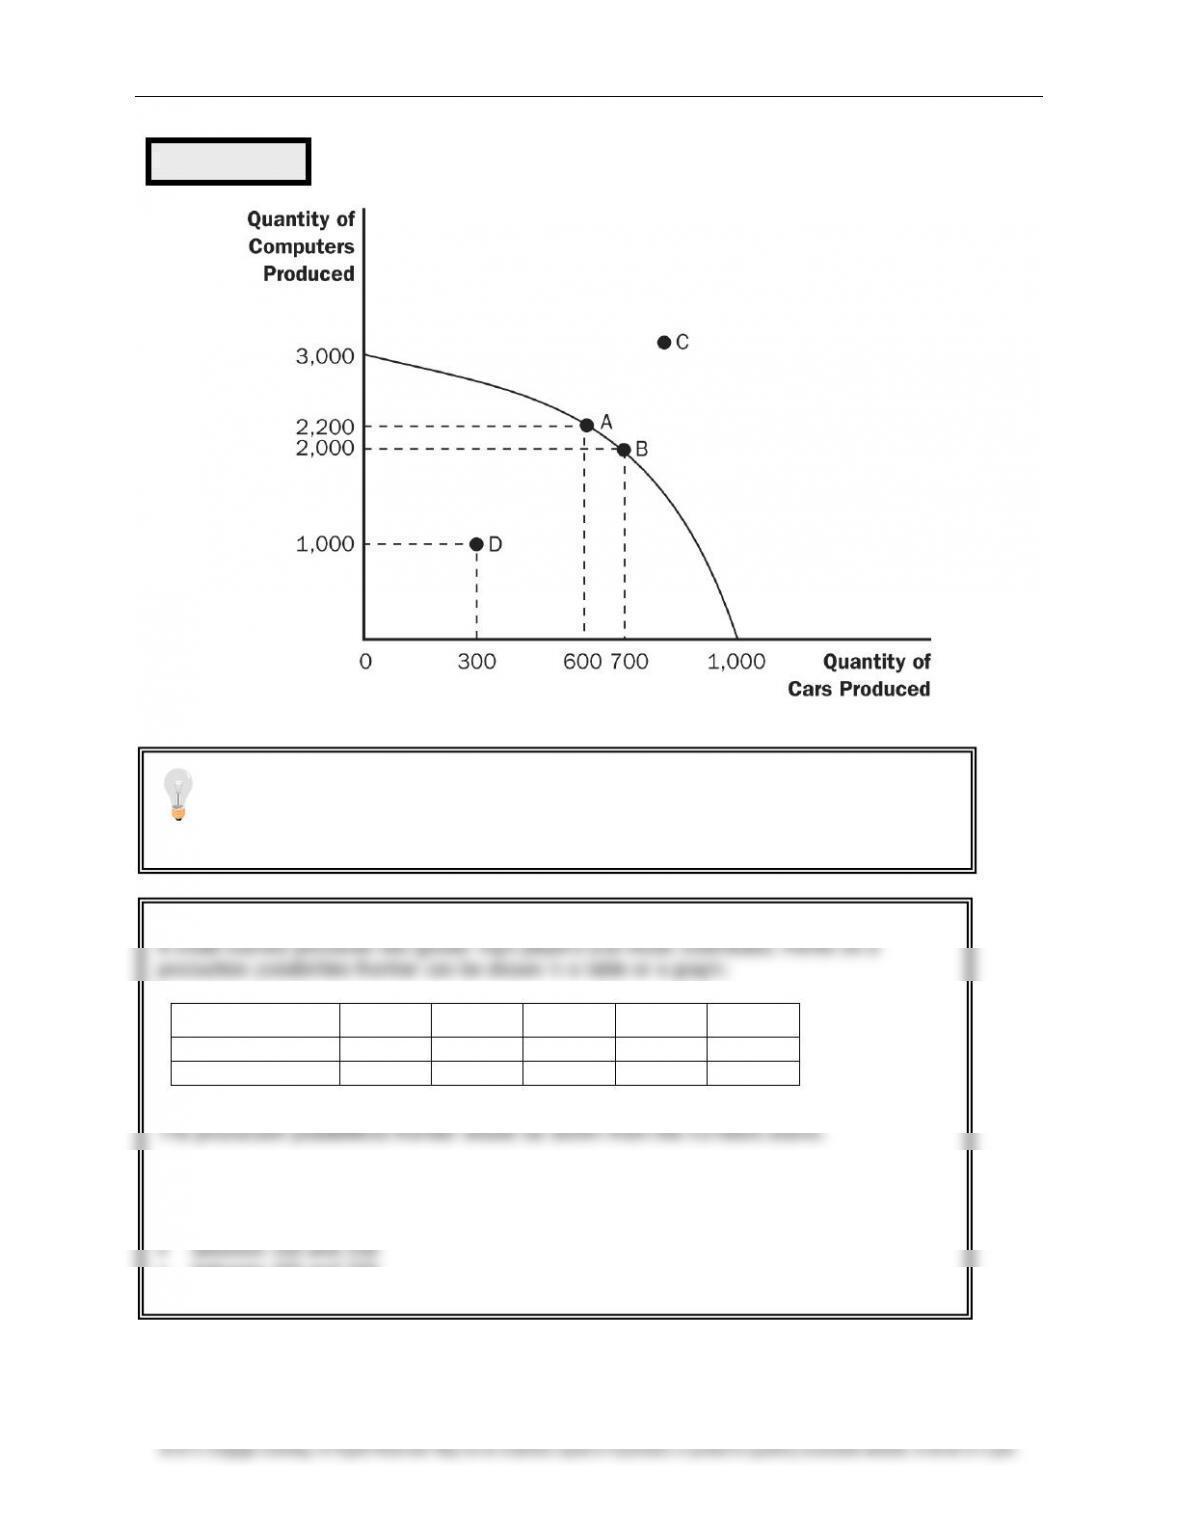
3. Because resources are scarce, not every combination of computers and cars is possible.
current level of resources and technology.
4. Production is efficient at points on the curve (such as A and B). This implies that the
5. Production at a point inside the curve (such as D) is inefficient.
available.
both goods.
6. The production possibilities frontier reveals Principle #1: People face trade-offs.
b. To increase the production of cars to 700, the production of computers must fall to
2,000.
7. Principle #2 is also shown on the production possibilities frontier: The cost of something is
a. The opportunity cost of increasing the production of cars from 600 to 700 is 200
computers.
8. The opportunity cost of a car depends on the number of cars and computers currently
produced by the economy.
computers.
computers.
9. Economists generally believe that production possibilities frontiers often have this bowed-out
shape because some resources are better suited to the production of cars than computers
(and vice versa).
It is useful to point out that the production possibilities frontier depends on two
things: the availability of resources and the level of technology.

Chapter 2/Thinking Like an Economist ❖ 21
10. The production possibilities frontier can shift if resource availability or technology changes.
Economic growth can be illustrated by an outward shift of the production possibilities
frontier.
F. Microeconomics and Macroeconomics
1. Economics is studied on various levels.
a. Definition of microeconomics: the study of how households and firms make
decisions and how they interact in markets.
b. Definition of macroeconomics: the study of economy-wide phenomena,
including inflation, unemployment, and economic growth.
2. Microeconomics and macroeconomics are closely intertwined because changes in the overall
economy arise from the decisions of individual households and firms.
You may also want to teach students about budget constraints at this time (call them
“consumption possibilities frontiers”). This reinforces the idea of opportunity cost,
and allows them to see how opportunity cost can be measured by the slope. Also, it
will introduce students to the use of straight-line production possibilities frontiers
(which appear in Chapter 3). However, be careful if you choose to do this as students
often find the difference between straight-line and concave production possibilities
frontiers challenging.
Figure 3
ALTERNATIVE CLASSROOM EXAMPLE:
Ivan receives an allowance from his parents of $20 each week. He spends his entire
allowance on two goods: ice cream cones (which cost $2 each) and tickets to the movies
(which cost $10 each).
Students should be asked to calculate the opportunity cost of one movie and the opportunity
cost of one ice cream cone.
Ivan’s consumption possibilities frontier (budget constraint) can be drawn. It should be noted
that the slope is equal to the opportunity cost and is constant because the opportunity cost is
constant.
Ask students what would happen to the consumption possibilities frontier if Ivan’s allowance
changes or if the price of ice cream cones or movies changes.
Be aware that students often have trouble understanding why opportunity costs rise
as the production of a good increases. You may want to use several specific
examples of resources that are more suited to producing cars than computers
(e.g., an experienced mechanic) as well as examples of resources that are more
suited to producing computers than cars (e.g., an experienced computer
programmer).
22 ❖ Chapter 2/Thinking Like an Economist
II. The Economist as Policy Adviser
A. Positive versus Normative Analysis
2. Definition of positive statements: claims that attempt to describe the world as it is.
3. Definition of normative statements: claims that attempt to prescribe how the world
should be.
personal viewpoints.
5. Positive views about how the world works affect normative views about which policies are
desirable.
the economy.
B. Economists in Washington
1. Economists are aware that trade-offs are involved in most policy decisions.
3. Economists are also employed by administrative departments within the various federal
C. Why Economists’ Advice Is Not Always Followed
Use several examples to illustrate the differences between positive and normative
statements and stimulate classroom discussion. Possible examples include the
minimum wage, budget deficits, tobacco taxes, legalization of marijuana, and seat-
belt laws.
Have students bring in newspaper articles and in groups, identify each statement in
an editorial paragraph as being a positive or normative statement. Discuss the
differences among news stories, editorials, and blogs and the analogy to economists
as scientists and as policy advisers.
Chapter 2/Thinking Like an Economist ❖ 23
© 2012 Cengage Learning. All Rights Reserved. May not be scanned, copied or duplicated, or posted to a publicly accessible website, in whole or in part.
1. The process by which economic policy is made differs from the idealized policy process
assumed in textbooks.
2. Economists offer crucial input into the policy process, but their advice is only part of the
advice received by policymakers.
III. Why Economists Disagree
A. Differences in Scientific Judgments
2. Example: some economists feel that a change in the tax code that would eliminate a tax on
behavior and therefore do not support the change.
B. Differences in Values
C. Perception versus Reality
housing.
3. Most economists also oppose barriers to trade.
A. Professional Economists have begun working in the video game industry as consultants to
developers and to experiment with policy options.
game industry.
V. Appendix—Graphing: A Brief Review
Table 1
Emphasize that there is more agreement among economists than most people think.
The reason for this is probably that the things that are generally agreed upon are
boring to most noneconomists.
Many instructors may be unaware of how much trouble beginning students have
grasping the most basic graphs. It is important for instructors to make sure that
students are comfortable with these techniques.

24 ❖ Chapter 2/Thinking Like an Economist
A. Graphs of a Single Variable
1. Pie Chart
2. Bar Graph
3. Time-Series Graph
1. Economists are often concerned with relationships between two or more variables.
a. The first number in the ordered pair is the
x
-coordinate and tells us the horizontal
location of the point.
location of the point.
3. The point with both an
x
-coordinate and
y
-coordinate of zero is called the origin.
5. Two variables that move in opposite directions (one increases when the other decreases)
have a negative correlation.
C. Curves in the Coordinate System
constant.
When reviewing graphing with the students, it is best to bring students to the board
to be “recorders” of what the other students say as you give a series of instructions
like “Draw a pie chart” or ask questions like “How tall should the bar be if the value is
120 million?” Do not make the student at the board responsible for the answer.
Instead he should be simply recording what the other students say. Students are
often uneasy about graphing at first and need to gain confidence.
Figure A-1
Figure A-2
Table A-1
Figure A-3