Chapter 14/Firms in Competitive Markets ❖ 251
6. Therefore, the process of entry or exit ends only when price and average total cost become
equal.
7. This implies that the long-run equilibrium of a competitive market must have firms operating
at their efficient scale.
C. Why Do Competitive Firms Stay in Business If They Make Zero Profit?
3. When a firm is earning zero profit, this must mean that the firm’s revenues are compensating
the firm’s owners for their opportunity costs.
1. Assume that the market begins in long-run equilibrium. This means that firms are earning
4. Because price is now greater than average total cost, firms are earning profit.
6. This will lower price until it falls back to the minimum of average total cost and firms are
once again earning zero economic profit.
Figure 8
252 ❖ Chapter 14/Firms in Competitive Markets
1. Because we assumed that all potential entrants faced the same costs as existing firms,
2. In this situation, the long-run supply of the market will be a horizontal line at minimum
average total cost.
3. However, there are two possible reasons why this may not be the case.
b. If firms have different costs, then it is likely that those with the lowest costs will enter
4. In this situation, the long-run supply curve of the market will be upward sloping.
5. In either case, the long-run supply curve of a market is generally more elastic than the short-
run supply curve of the market (because firms can enter or exit in the long run).
SOLUTIONS TO TEXT PROBLEMS:
Quick Quizzes
1. When a competitive firm doubles the amount it sells, the price remains the same, so its total
revenue doubles.
2. A profit-maximizing competitive firm sets price equal to its marginal cost. If price were above
marginal cost, the firm could increase profits by increasing output, while if price were below
marginal cost, the firm could increase profits by decreasing output.
A profit-maximizing competitive firm decides to shut down in the short run when price is less
than average variable cost. In the long run, a firm will exit a market when price is less than
average total cost.
After going through the effects of an increase in demand, ask students to work
through the effects of a decrease in demand. Make sure that they can see that firms
would exit the market because of economic losses.
No matter what the shape of the long-run supply curve, an increase in demand will
always lead to a rise in the price in the short run and a decrease in demand will
always lead to a drop in price in the short run.
Chapter 14/Firms in Competitive Markets ❖ 253
long run, entry into and exit from the market drive the price of the good to the minimum
point on the average-total-cost curve.
Figure 1
Questions for Review
2. A firm’s total revenue equals its price multiplied by the quantity of units it sells. Profit is the
difference between total revenue and total cost. Firms are assumed to maximize profit.
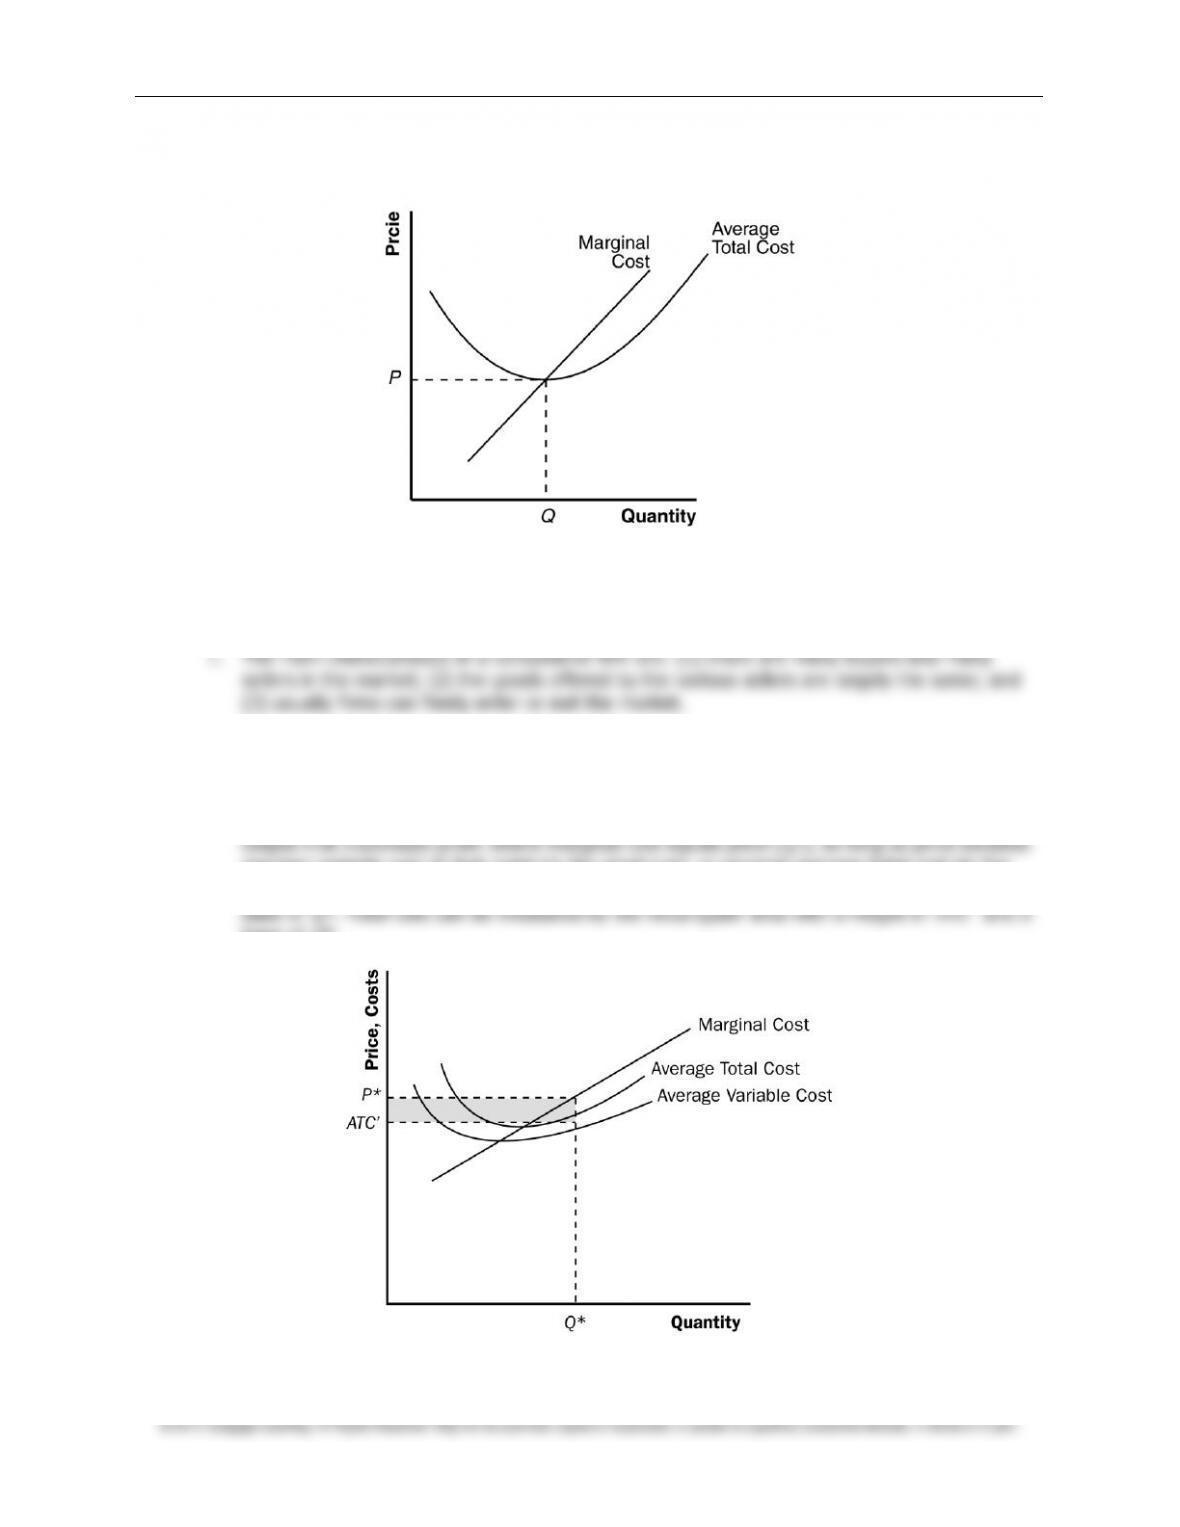
3. Figure 2 shows the cost curves for a typical firm. A competitive firm chooses the level of
*), as long as price exceeds
average variable cost at that point (in the short run), or exceeds average total cost (in the
long run). Total revenue can be measured by the rectangular area with a height of
P
* and a
base of
Q
*.
Figure 2
254 ❖ Chapter 14/Firms in Competitive Markets
4. A firm will shut down temporarily if the revenue it would get from producing is lower than the
variable costs of production. This occurs if price is less than average variable cost.
6. A competitive firm’s price equals its marginal cost in both the short run and the long run. In
equals marginal cost.
7. The competitive firm’s price must equal the minimum of its average total cost only in the
breaking even). In the long run, if firms are earning profits, other firms will enter the
8. Market supply curves are typically more elastic in the long run than in the short run. In a
competitive market, because entry or exit occurs until price equals average total cost,
quantity supplied is more responsive to changes in price in the long run.
Quick Check Multiple Choice
1. c
2. b
3. d
4. a
5. d
6. c
Problems and Applications
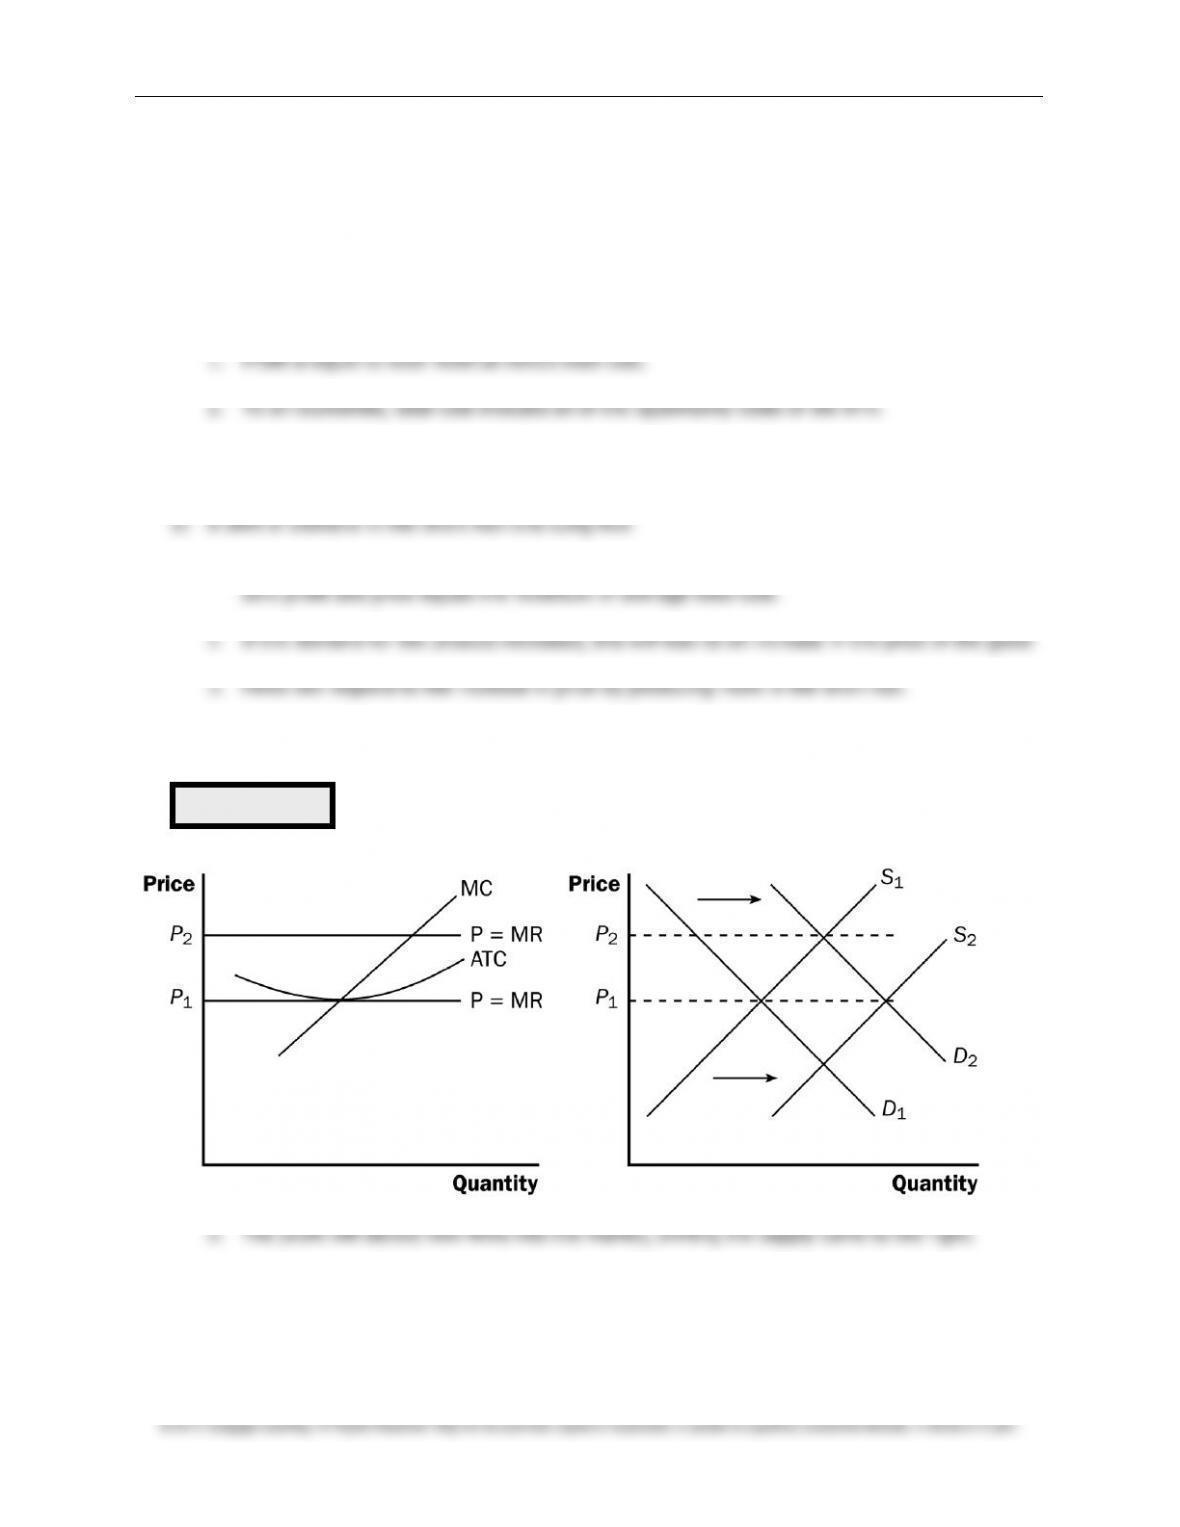
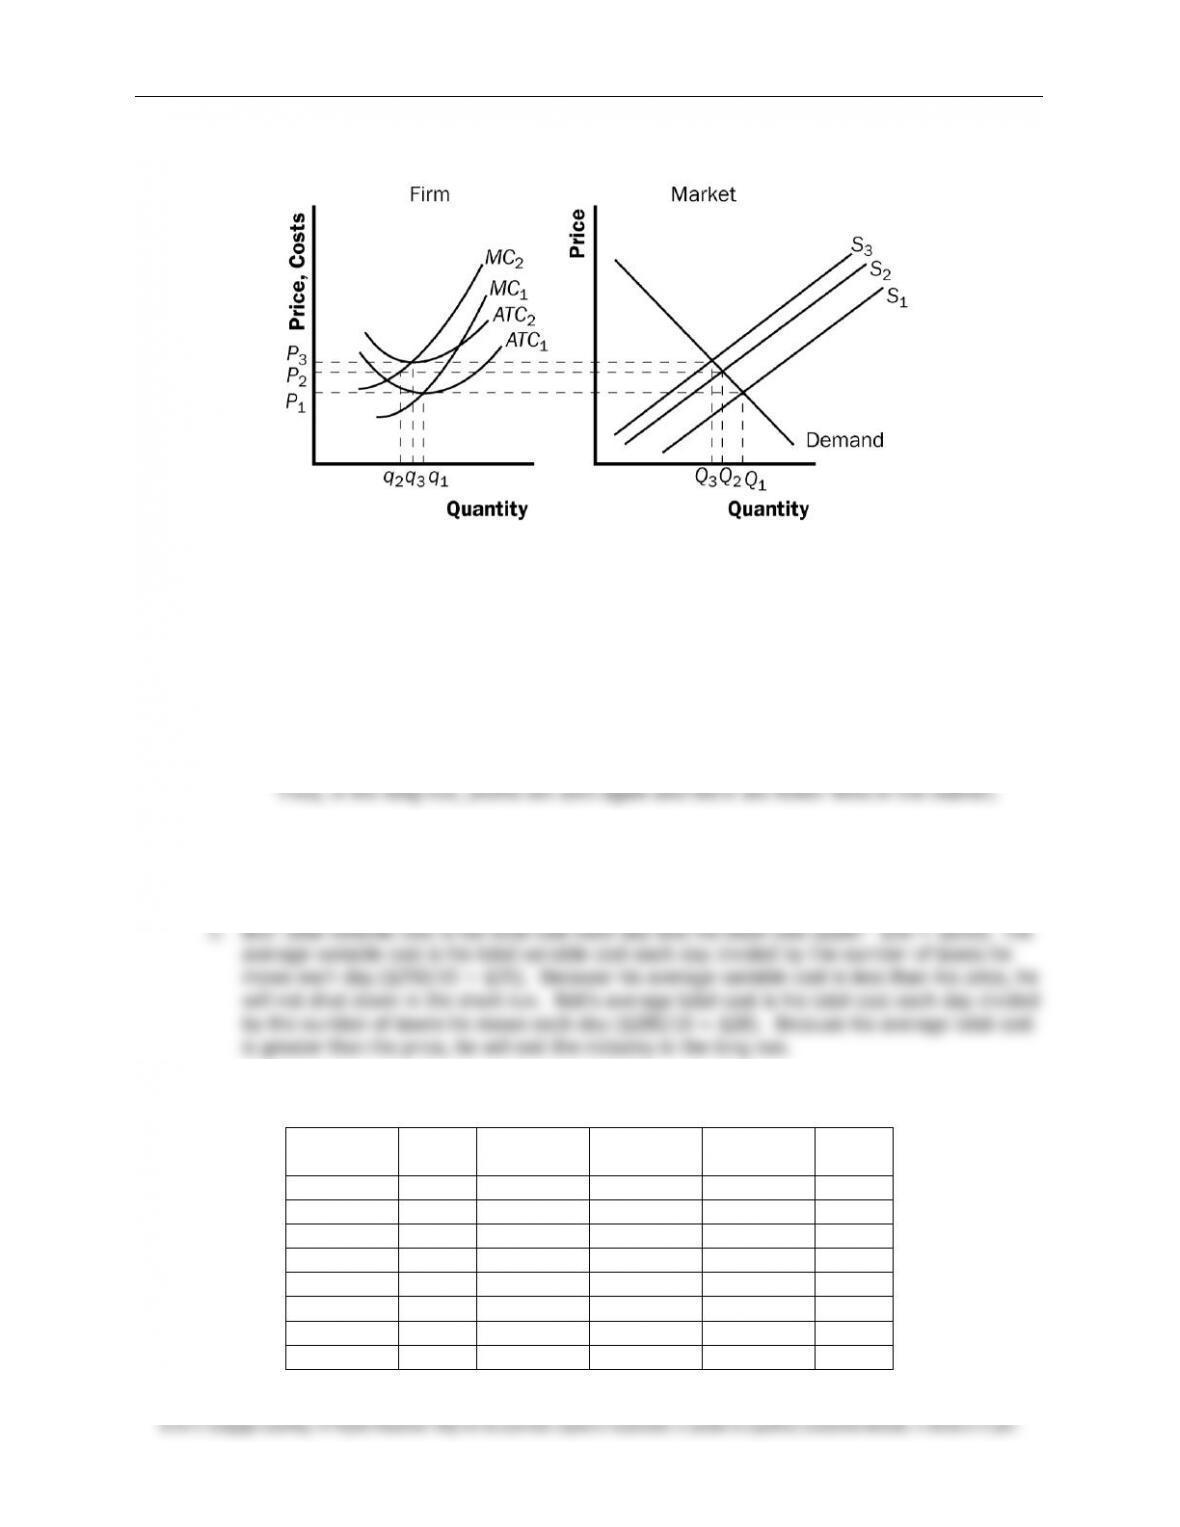
1. a. As shown in Figure 3, the typical firm’s initial marginal-cost curve is
MC
1 and its average–
total-cost curve is
ATC
1. In the initial equilibrium, the market supply curve,
S
1, intersects
the demand curve at price
P
1, which is equal to the minimum average total cost of the
typical firm. Thus, the typical firm earns no economic profit. The rise in the price of crude
oil increases production costs for individual firms (from
MC
1 to
MC
2 and from
ATC
1 to
ATC
2) and thus shifts the market supply curve to the left, to
S
2.
Chapter 14/Firms in Competitive Markets ❖ 255
Figure 3
b. When the market supply curve shifts left to
S
2, the equilibrium price rises from
P
1 to
P
2,
but the price does not increase by as much as the increase in marginal cost for the firm.
As a result, price is less than average total cost for the firm, so profits are negative.
In the long run, the negative profits lead some firms to exit the market. As they do so,
the market supply curve shifts to the left. This continues until the price rises to equal the
minimum point on the firm’s average-total-cost curve. The long-run equilibrium occurs
with supply curve
S
3, equilibrium price
P
3, total market output
Q
3, and firm’s output
q
3.
2. Once you have ordered the dinner, its cost is sunk, so it does not represent an opportunity
cost. As a result, the cost of the dinner should not influence your decision about whether to
finish it.
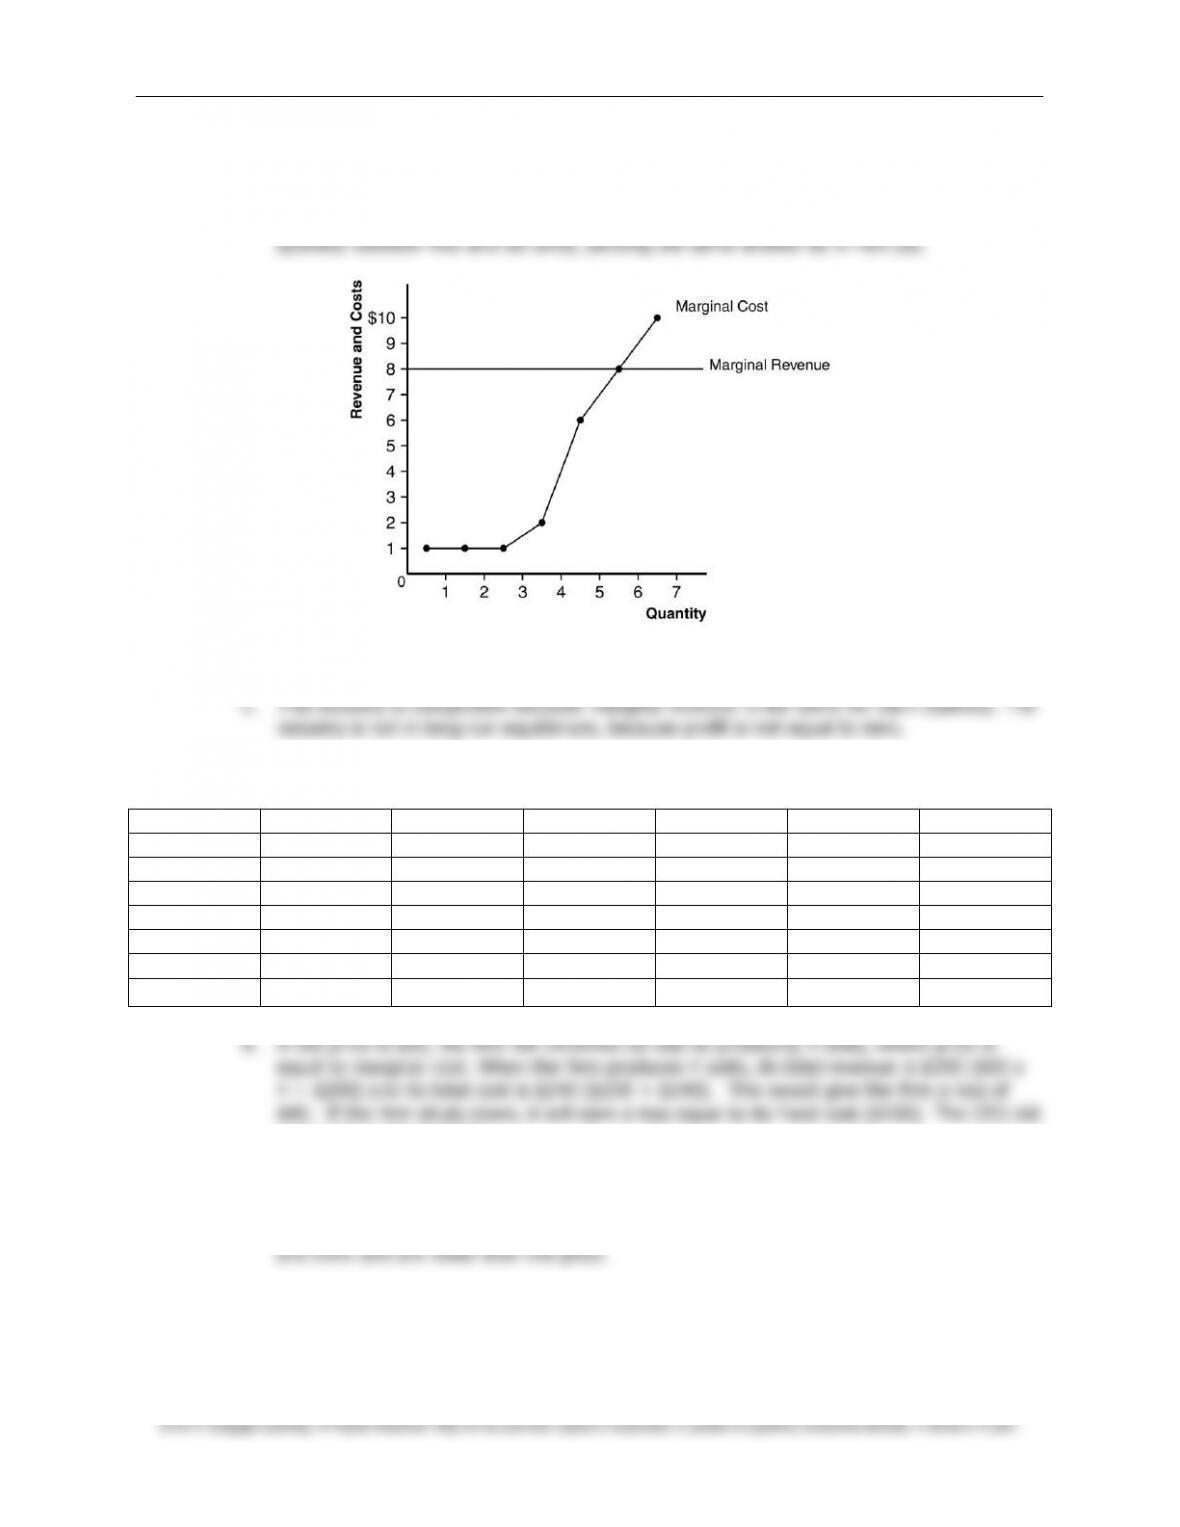
4. Here is the table showing costs, revenues, and profits:
Quantity
Total
Cost
Marginal
Cost
Total
Revenue
Marginal
Revenue
Profit
0
$8
—
$0
—
$-8
1
9
$1
8
$8
-1
2
10
1
16
8
6
3
11
1
24
8
13
4
13
2
32
8
19
5
19
6
40
8
21
6
27
8
48
8
21
7
37
10
56
8
19
256 ❖ Chapter 14/Firms in Competitive Markets
a. The firm should produce five or six units to maximize profit.
b. Marginal revenue and marginal cost are graphed in Figure 4. The curves cross at a
Figure 4
5. a. Costs are shown in the following table:
Q
TFC
TVC
AFC
AVC
ATC
MC
0
$100
$0
—-
—-
—-
—-
1
100
50
$100
$50
150
50
2
100
70
50
35
85
20
3
100
90
33.3
30
63.3
20
4
100
140
25
35
60
50
5
100
200
20
40
60
60
6
100
360
16.7
60
76.7
160
not make a wise decision.
c. If the firm produces 1 unit, its total revenue is $50 and its total cost is $150 ($100 +
$50), so its loss will still be $100. This was also not the best decision. The firm could
have reduced its loss by producing more units because the marginal costs of the second
Chapter 14/Firms in Competitive Markets ❖ 257
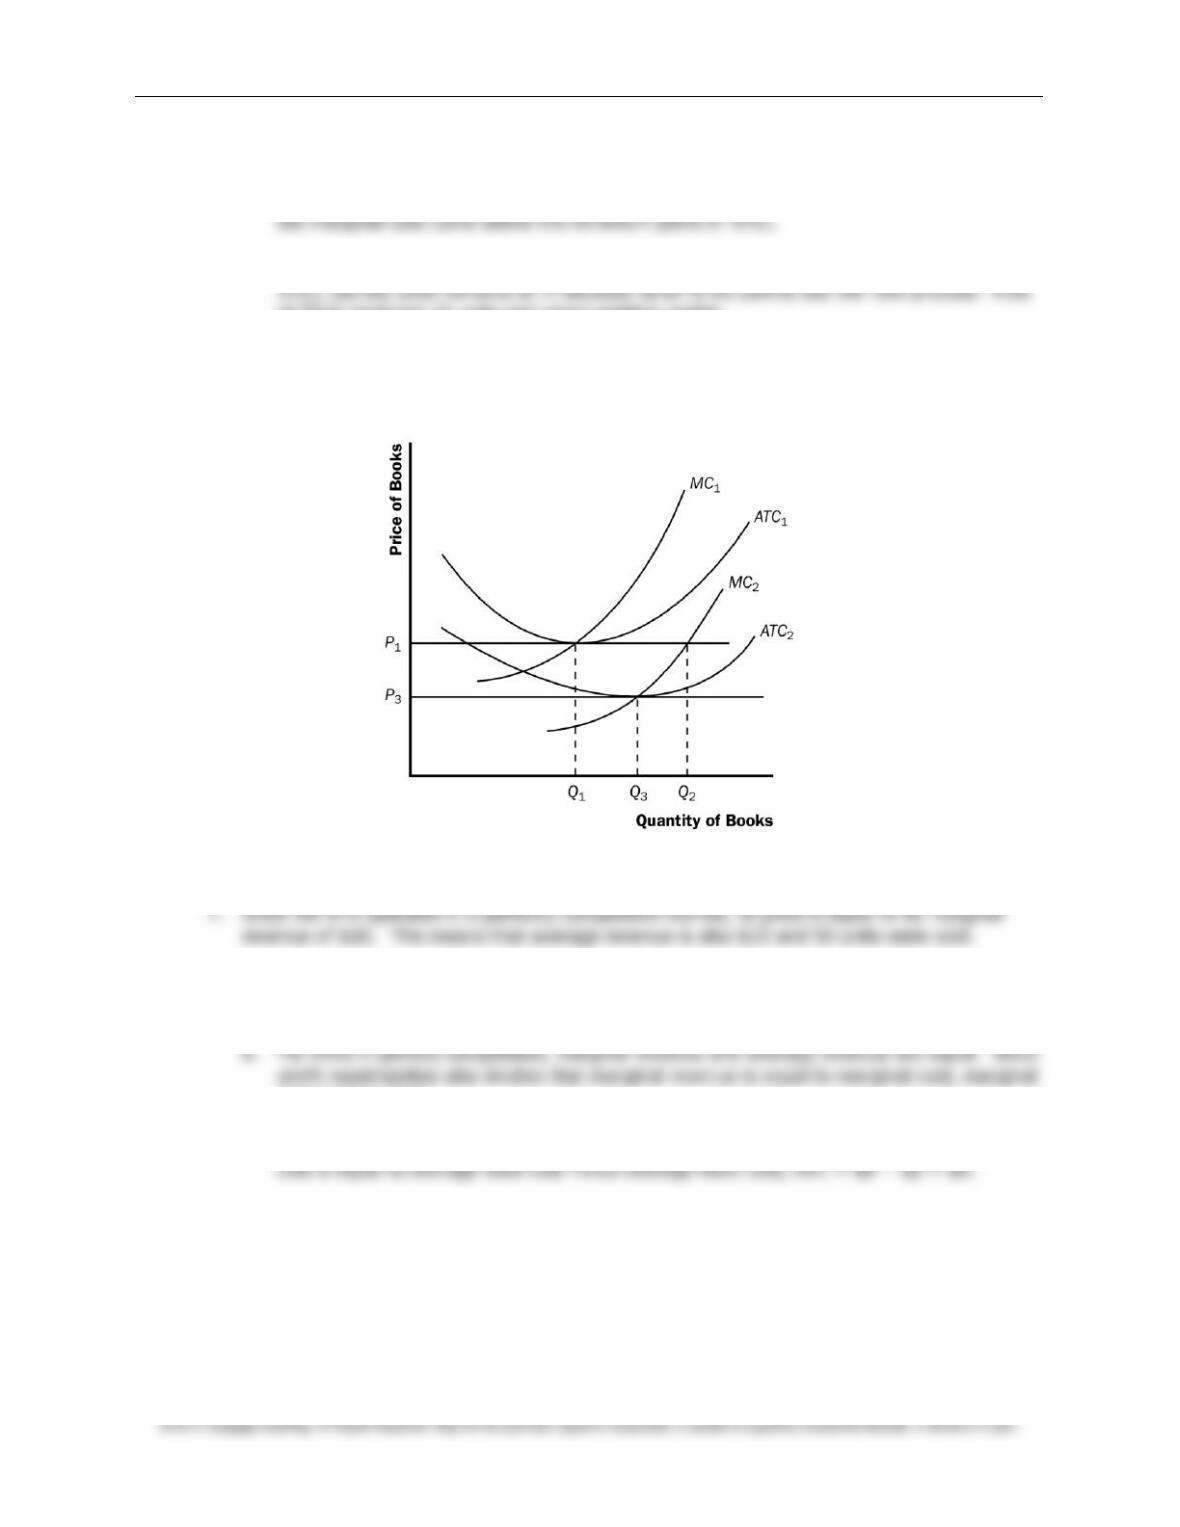
6. a. Figure 5 shows the curves of a typical firm in the industry, with average total cost
ATC
1,
marginal cost
MC
1, and marginal revenue equal to price
P
1. The long-run-supply curve is
b. The new process reduces Hi-Tech’s marginal cost to
MC
2 and its average total cost to
Hi-Tech produces
Q
2 units and earns positive profits.
c. When the patent expires and other firms are free to use the technology, all firms’
average-total-cost curves decline to
ATC
2, so the market price falls to
P
3 and firms earn
zero profit.
Figure 5
8. a. Profit is equal to (
P
–
ATC
) ×
Q
. Price is equal to
AR
. Therefore, profit is ($10 – $8) ×
100 = $200.
cost must be $10.
c. Average fixed cost is equal to
AFC
/
Q
which is $200/100 = $2. Since average variable
d. Since average total cost is less than marginal cost, average total cost must be rising.
Therefore, the efficient scale must occur at an output level less than 100.
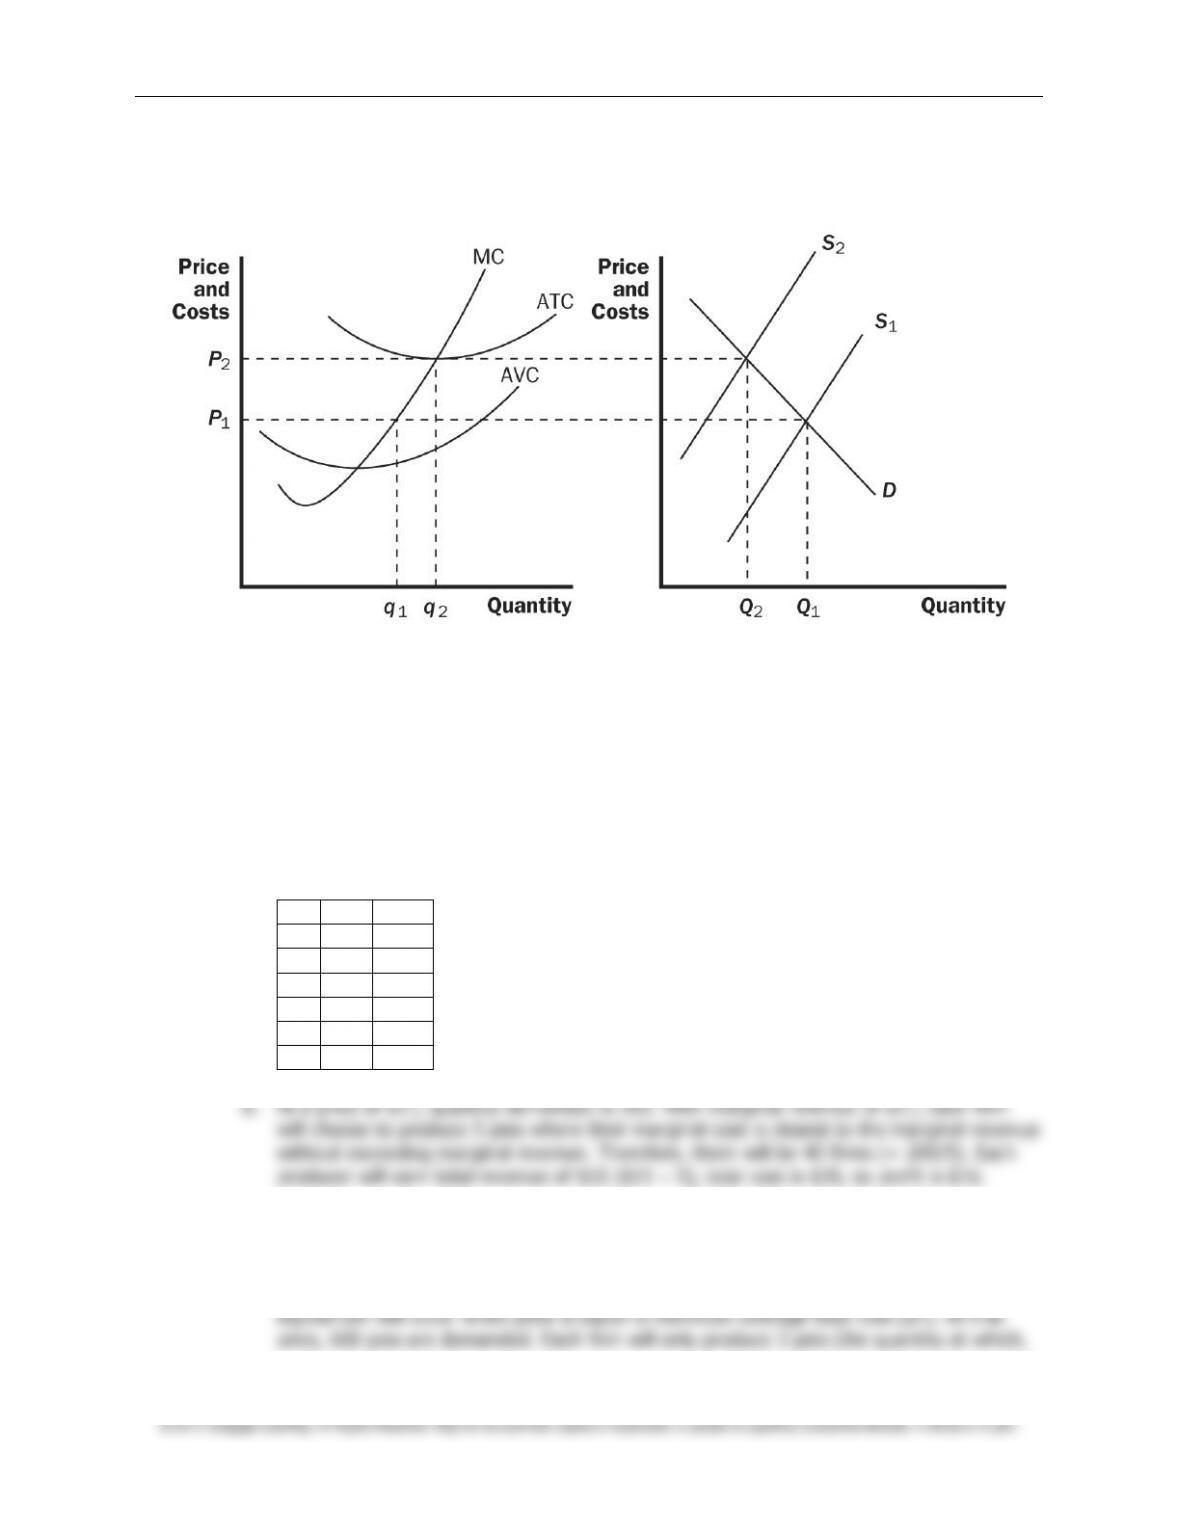
9. a. If firms are currently incurring losses, price must be less than average total cost.
However, because firms in the industry are currently producing output, price must be
greater than average variable cost. If firms are maximizing profits, price must be equal to
marginal cost.
258 ❖ Chapter 14/Firms in Competitive Markets
b. The present situation is depicted in Figure 6. The firm is currently producing
q
1 units of
output at a price of
P
1.
Figure 6
c. Figure 6 also shows how the market will adjust in the long run. Because firms are
incurring losses, there will be exit in this industry. This means that the market supply
curve will shift to the left, increasing the price of the product. As the price rises, the
remaining firms will increase quantity supplied; marginal cost will increase. Exit will
continue until price is equal to minimum average total cost. Average total cost will be
lower in the long run than in the short run. The total quantity supplied in the market will
fall.
10. a. The table below shows
TC
and
ATC
for a typical firm:
Q
TC
ATC
1
11
11
2
15
7.5
3
21
7
4
29
7.25
5
39
7.8
6
51
8.5
c. The market is not in long-run equilibrium because firms are earning positive economic
profit. Firms will want to enter the market.
d. With free entry and exit, each producer will earn zero profit in the long run. Long-run
Chapter 14/Firms in Competitive Markets ❖ 259
MC is closest to MR without exceeding MR) meaning that there will be 200 pie producers
in the market.
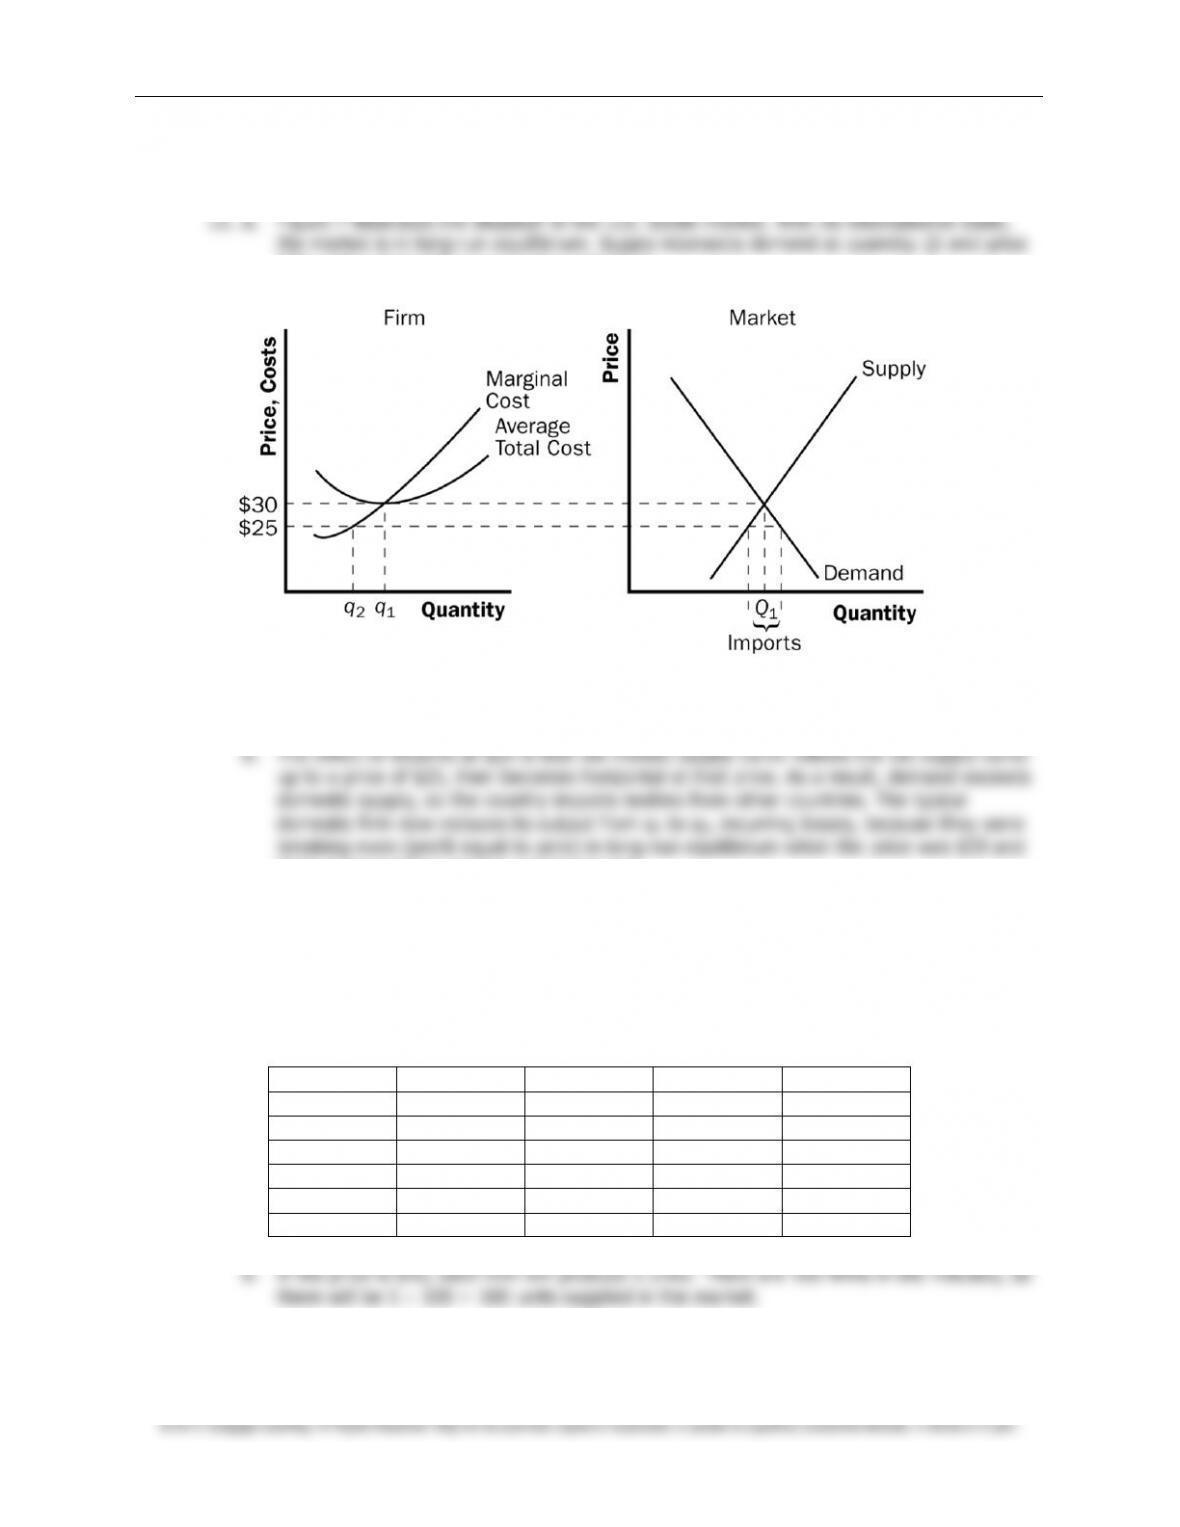
$30, with a typical firm producing output
q
1.
Figure 7
their average total cost has not decreased.
c. In the long run, domestic firms will be unable to compete with foreign firms because
their costs are too high. All the domestic firms will exit the market and other countries
will supply enough to satisfy the entire domestic demand.
12. a. The firms’ variable cost (
VC
), total cost (
TC
), marginal cost (
MC
), and average total cost
(
ATC
) are shown in the table below:
Quantity
VC
TC
MC
ATC
1
1
17
1
17
2
4
20
3
10
3
9
25
5
8.33
4
16
32
7
8
5
25
41
9
8.20
6
36
52
11
8.67
c. At a price of $10 and a quantity supplied of 5, each firm is earning a positive profit
because price is greater than average total cost. Thus, entry will occur and the price will
260 ❖ Chapter 14/Firms in Competitive Markets
decreases.
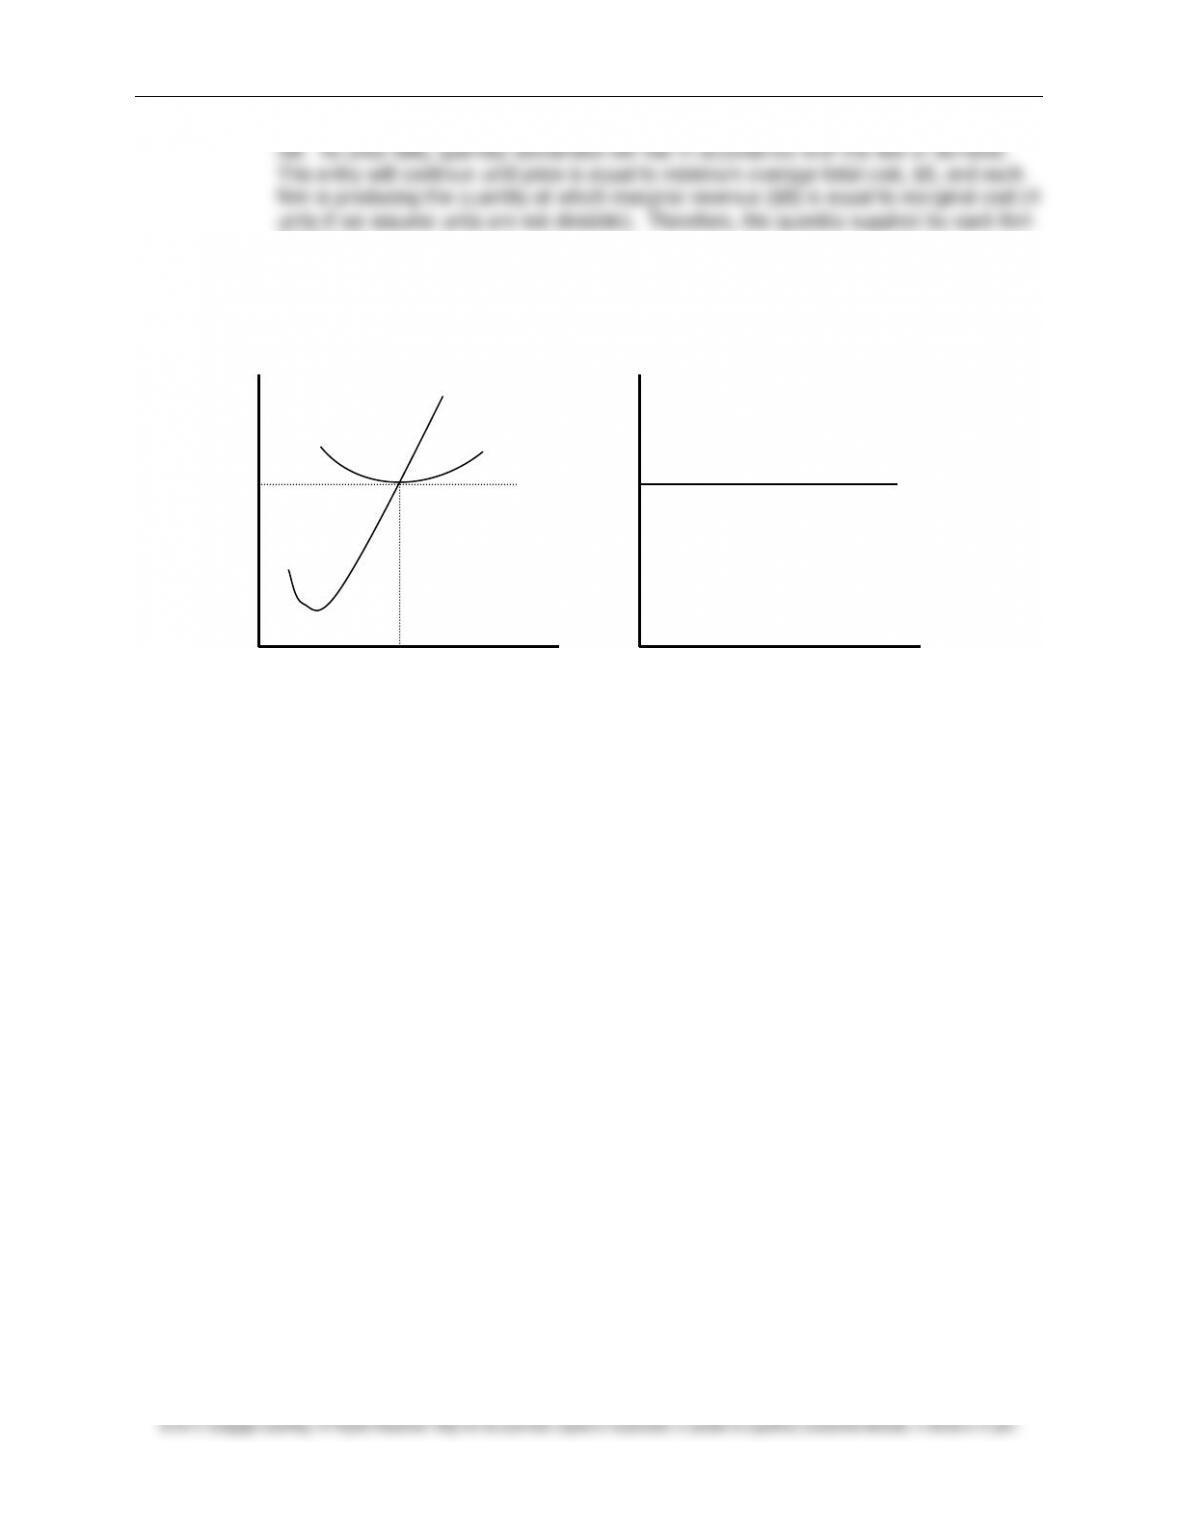
d. Figure 8 shows the long-run market supply curve, which will be horizontal at minimum
average total cost, $8. Each firm produces 4 units.
Figure 8
Market
Firm
Price
and
Costs
MC
ATC
S
P=$8
P=$8
q=4