241
WHAT’S NEW IN THE SEVENTH EDITION:
There are no major changes to this chapter.
LEARNING OBJECTIVES:
what characteristics make a market competitive.
how competitive firms decide how much output to produce.
how competitive firms decide when to shut down production temporarily.
how competitive firms decide whether to exit or enter a market.
CONTEXT AND PURPOSE:
Chapter 14 is the second chapter in a five-chapter sequence dealing with firm behavior and the
lie behind the supply curve in a competitive market.
KEY POINTS:
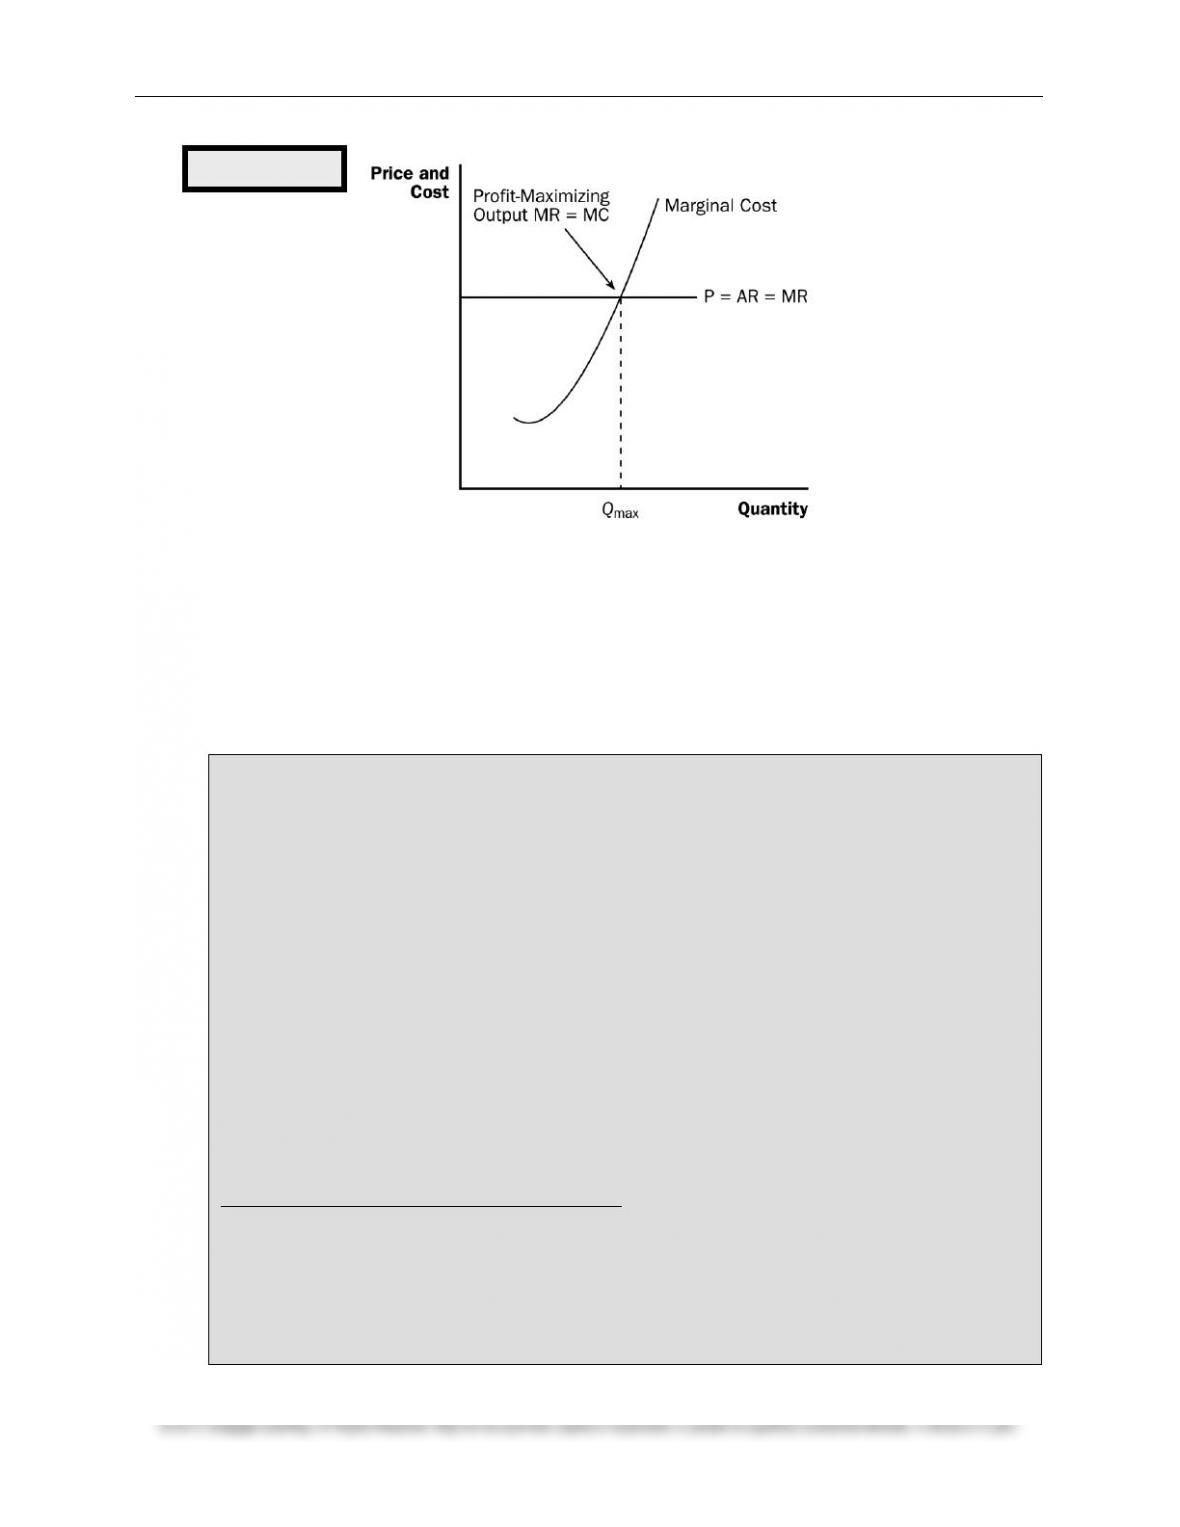
To maximize profit, a firm chooses a quantity of output such that marginal revenue equals marginal
cost. Because marginal revenue for a competitive firm equals the market price, the firm chooses
quantity so that price equals marginal cost. Thus, the firm’s marginal-cost curve is its supply curve.
FIRMS IN
COMPETITIVE MARKETS
14
242 ❖ Chapter 14/Firms in Competitive Markets
In the short run when a firm cannot recover its fixed costs, the firm will choose to shut down
temporarily if the price of the good is less than average variable cost. In the long run when the firm
can recover both fixed and variable costs, it will choose to exit if the price is less than average total
cost.
Changes in demand have different effects over different time horizons. In the short run, an increase
in demand raises prices and leads to profits, and a decrease in demand lowers prices and leads to
losses. But if firms can freely enter and exit the market, then in the long run the number of firms
adjusts to drive the market back to the zero-profit equilibrium.
CHAPTER OUTLINE:
I. What Is a Competitive Market?
A. The Meaning of Competition
1. Definition of competitive market: a market with many buyers and sellers trading
2. There are three characteristics of a competitive market (sometimes called a perfectly
competitive market).
a. There are many buyers and sellers.
b. The goods offered by the sellers are largely the same.
c. Firms can freely enter or exit the market.
B. The Revenue of a Competitive Firm
Table 1
Remember that students have a difficult time understanding what a competitive
market is. The use of the word “competition” in economics is much different from
that in sports. This will lead students to often forget that these firms are generally
unconcerned with the actions of their rivals.
To help students understand price-taking behavior, use the example of common
stock. Have your students assume that they inherited 100 shares of stock in a well–
known company. Point out that these 100 shares may seem like a lot, but it is a very
small proportion of the total number of shares outstanding. If the student wanted to
know the value of a share, it could be obtained from a broker. At this market–
determined price, the student could sell as few or as many shares as he or she
wishes. At a price above this, no one would be willing to buy any. There is also no
reason to charge a price below the current market price, because the student can sell
any number of shares that he or she wishes at the current price.
Chapter 14/Firms in Competitive Markets ❖ 243
1. Total revenue from the sale of output is equal to price times quantity.
2. Definition of average revenue: total revenue divided by the quantity sold.
3. Definition of marginal revenue: the change in total revenue from an additional unit
sold.
II. Profit Maximization and the Competitive Firm’s Supply Curve
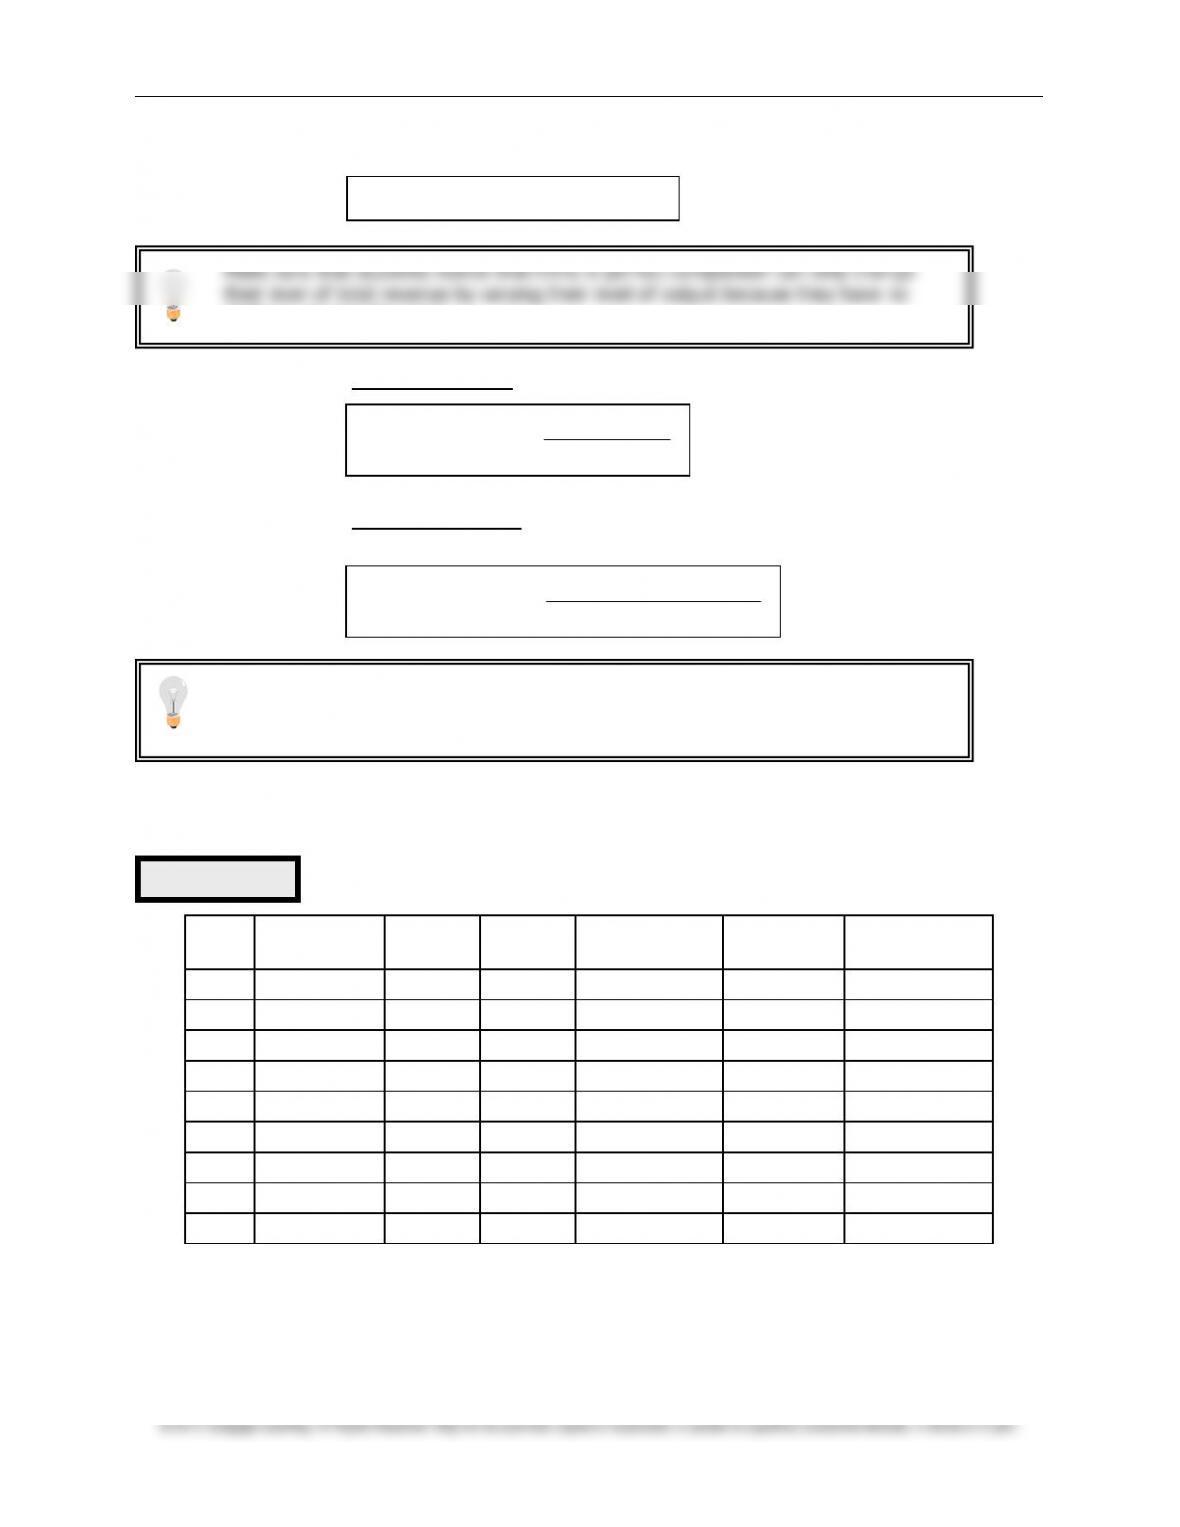
A. A Simple Example of Profit Maximization: The Vaca Family Dairy Farm
Q
Total
Revenue
Total
Cost
Profit
Marginal
Revenue
Marginal
Cost
Change in
Profit
0
$0
$3
$-3
—-
—-
—-
1
6
5
1
$6
$2
$4
2
12
8
4
6
3
3
3
18
12
6
6
4
2
4
24
17
7
6
5
1
5
30
23
7
6
6
0
6
36
30
6
6
7
-1
7
42
38
4
6
8
-2
8
48
47
1
6
9
-3
1. In this example, profit is maximized if the farm produces four or five gallons of milk (see the
fourth column).
2. The profit-maximizing quantity can also be found by comparing marginal revenue and
marginal cost.
Total Revenue = Price Quantity
Total Revenue
Average Revenue = Quantity
change in Total Revenue
Marginal Revenue = change in Quantity
Table 2
Make sure that students realize that firms in perfect competition can only change
their level of total revenue by varying their level of output because they have no
ability to change the price.
You may want to make it clear that, by definition, average revenue is always equal to
price. But marginal revenue is equal to price only for firms that operate in perfectly
competitive markets.
244 ❖ Chapter 14/Firms in Competitive Markets
a. As long as marginal revenue exceeds marginal cost, increasing output will raise profit.
b. If marginal revenue is less than marginal cost, the firm can increase profit by decreasing
output.
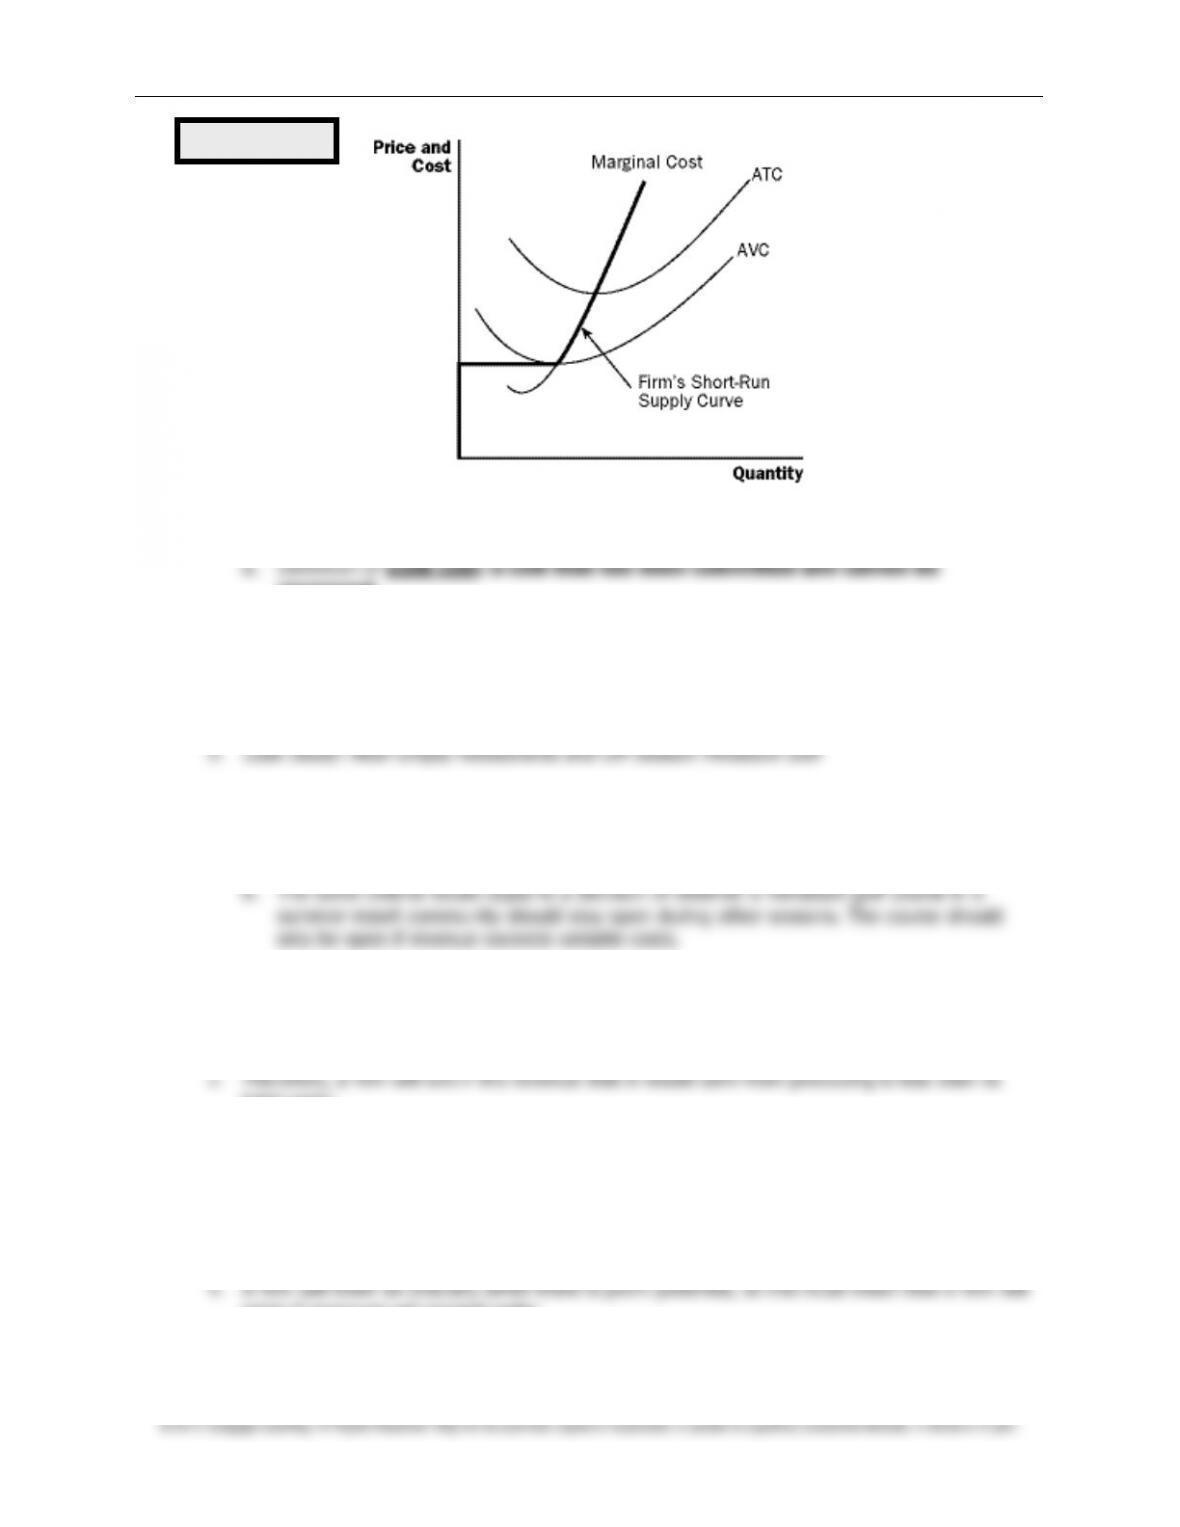
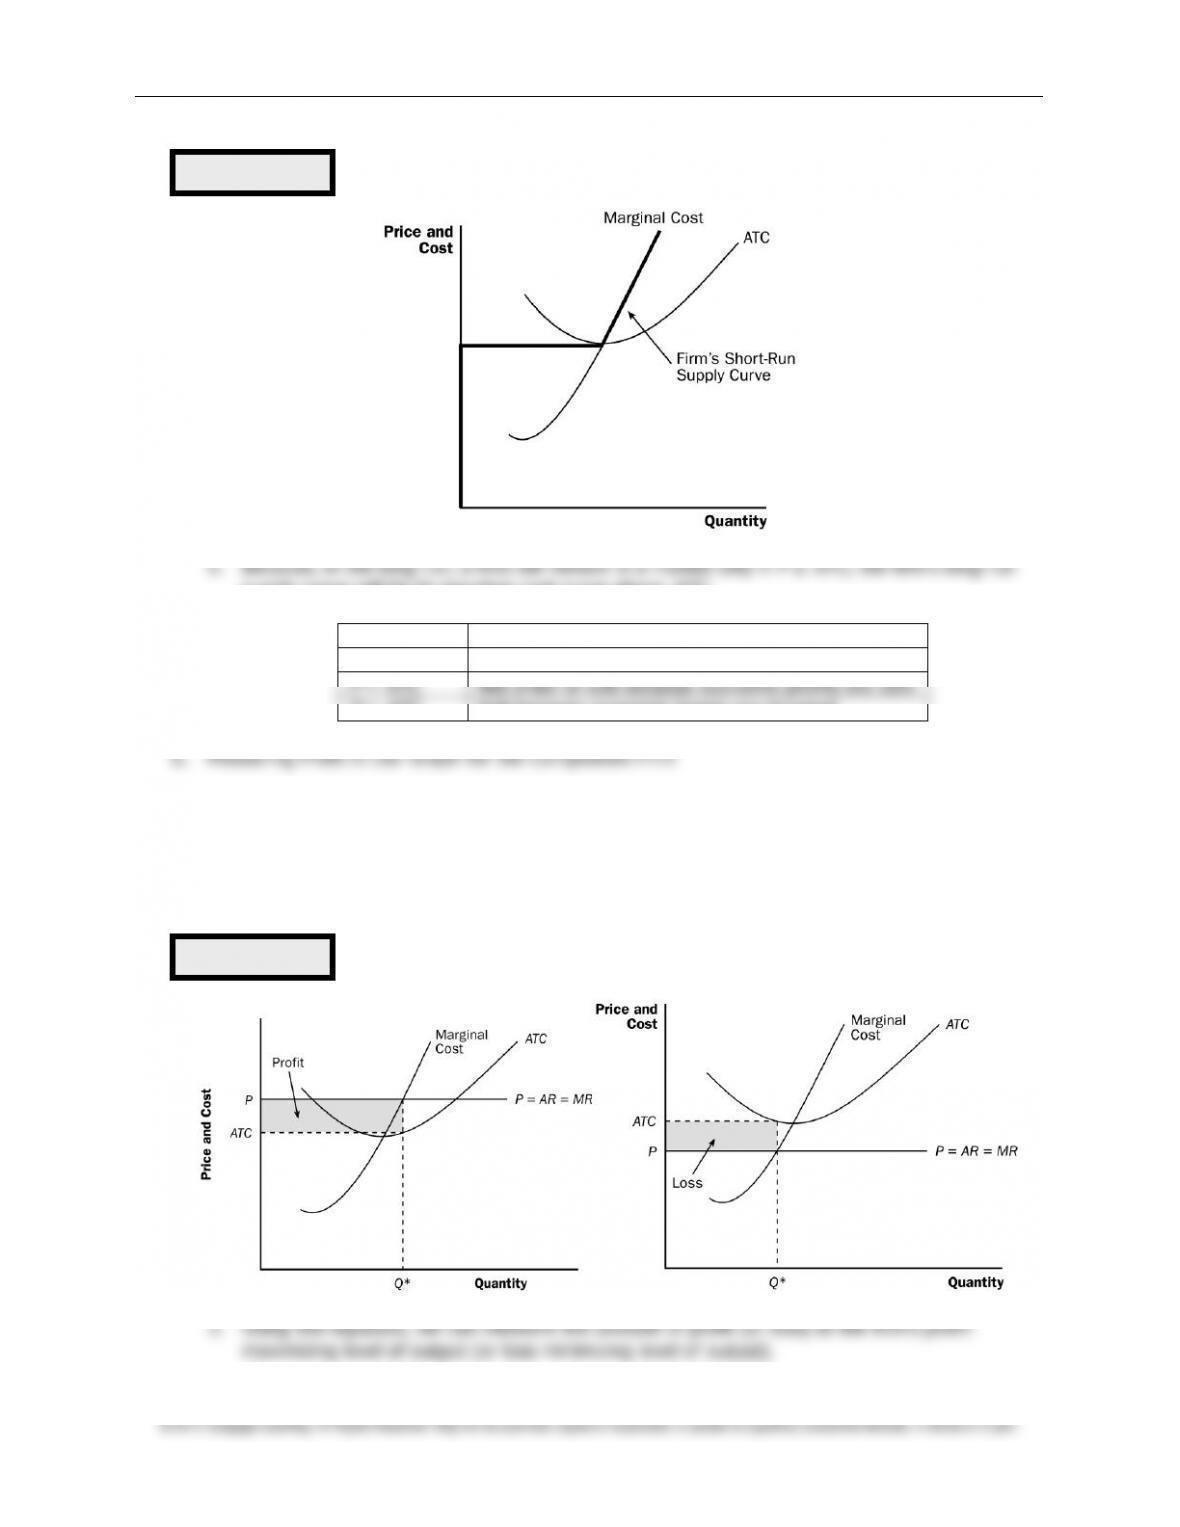
B. The Marginal-Cost Curve and the Firm’s Supply Decision
1. Cost curves have special features that are important for our analysis.
a. The marginal-cost curve is upward sloping.
b. The average-total-cost curve is U-shaped.
total cost.
3. To find the profit-maximizing level of output, we can follow the same rules that we discussed
above.
The graphs in this chapter often confuse students because they contain many
different curves at the same time. Thus, the first time you draw the profit-maximizing
decision of the firm, use only the marginal cost curve and the marginal revenue line.
Then, after students feel comfortable with this, add average total cost (to teach
students how to measure profit or loss). Last, add average variable cost to teach
students about the short-run shutdown decision of a firm earning an economic loss.
Point out that each of the short-run cost curves tells a different part of the story.
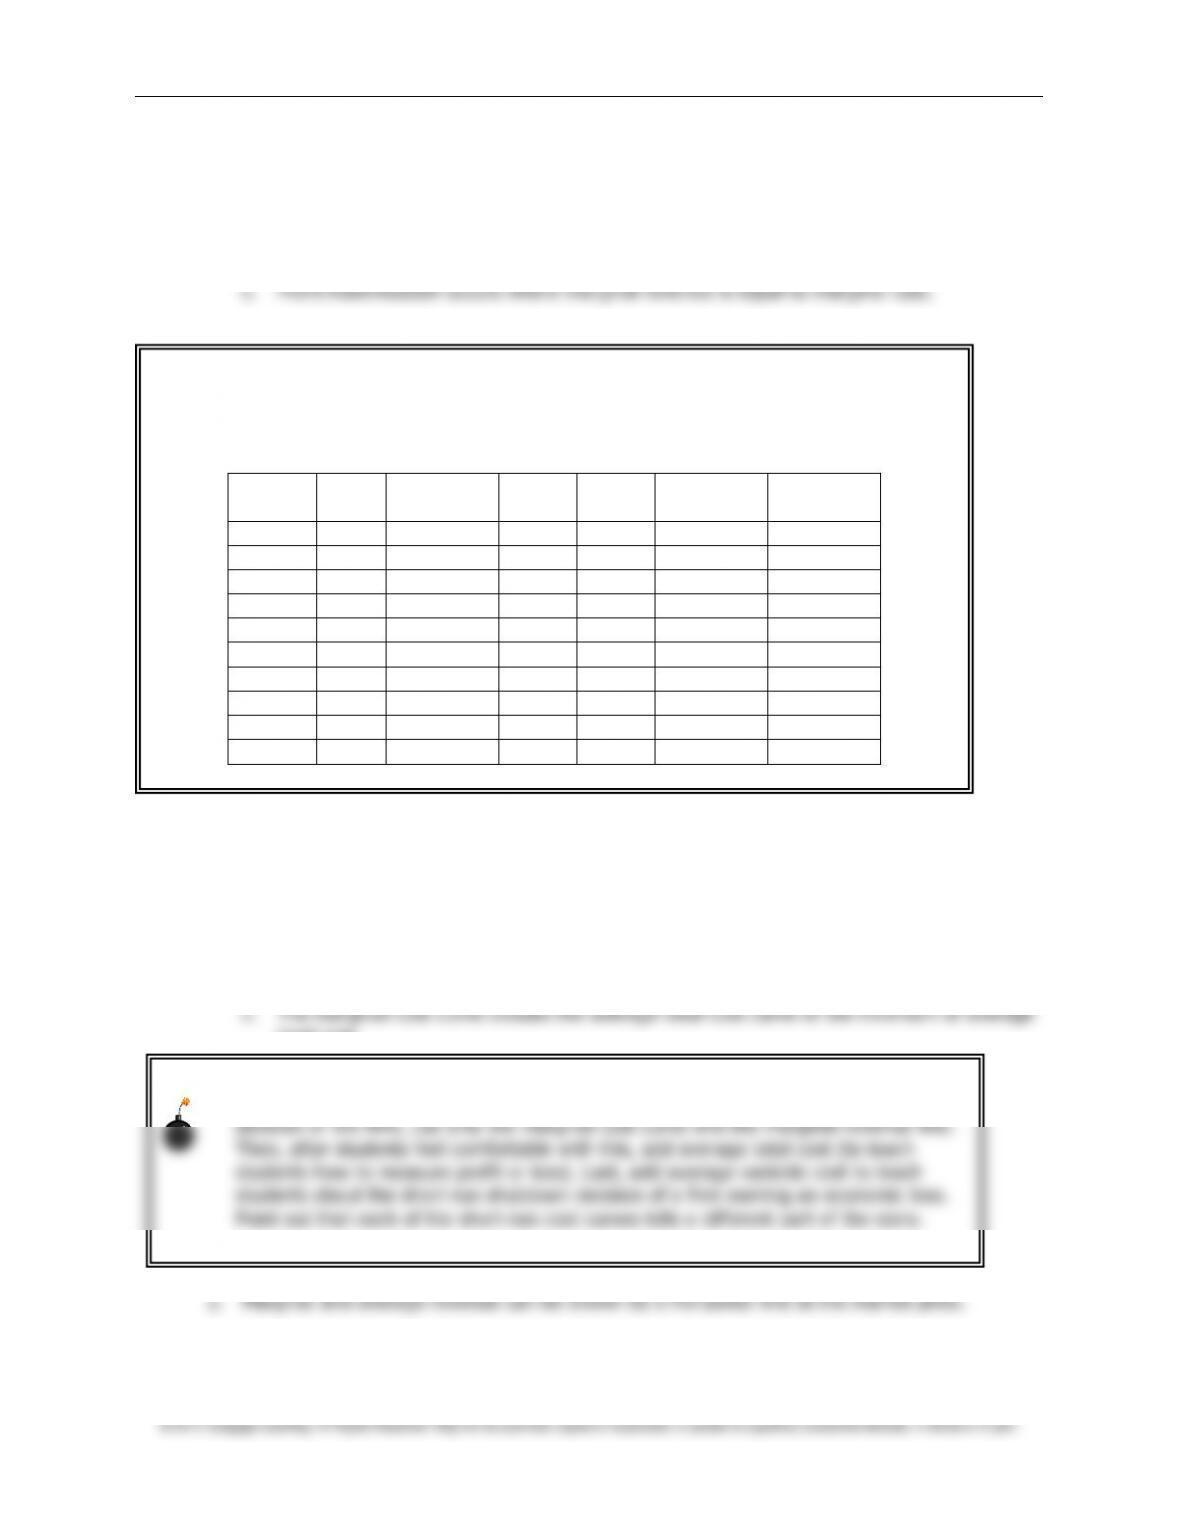
ALTERNATIVE CLASSROOM EXAMPLE:
Paulo’s Ping Pong Balls is a firm that operates in a competitive market. The ping pong balls
sell for $3 per package. Fill in the following table with the class’s help and discuss the profit–
maximizing level of output:
Output
Price
Total
Revenue
Total
Cost
Profit
Marginal
Revenue
Marginal
Cost
0
$3
$0.00
$1.50
$-1.50
—-
—-
1
3
3.00
2.00
1.00
$3
$0.50
2
3
6.00
3.00
3.00
3
1.00
3
3
9.00
4.50
4.50
3
1.50
4
3
12.00
6.50
5.50
3
2.00
5
3
15.00
9.00
6.00
3
2.50
6
3
18.00
12.00
6.00
3
3.00
7
3
21.00
15.50
5.50
3
3.50
8
3
24.00
19.50
4.50
3
4.00
9
3
27.00
24.00
3.00
3
4.50
Chapter 14/Firms in Competitive Markets ❖ 245
a. If marginal revenue is greater than the marginal cost, the firm should increase its output.
b. If marginal cost is greater than marginal revenue, the firm should decrease its output.
c. At the profit-maximizing level of output, marginal revenue and marginal cost are exactly
equal.
4. These rules apply not only to competitive firms, but to firms with market power as well.
Activity 1—A Profitable Opportunity?
Type: In-class assignment
Topics: Profit maximization
Materials needed: None
Time: 15 minutes
Class limitations: Works in any size class
Purpose
This exercise reinforces the importance of marginal cost in decision-making. It shows average
costs can be misleading.
Instructions
Tell the class, “As a recent graduate of this college you have landed a job in production
management for Universal Clones, Inc. You are responsible for the entire company on
weekends.”
“Your costs are shown below.”
Quantity Average Total Cost
500 200
501 201
Your current level of production is 500 units. All 500 units have been ordered by your regular
customers.
Figure 1
246 ❖ Chapter 14/Firms in Competitive Markets
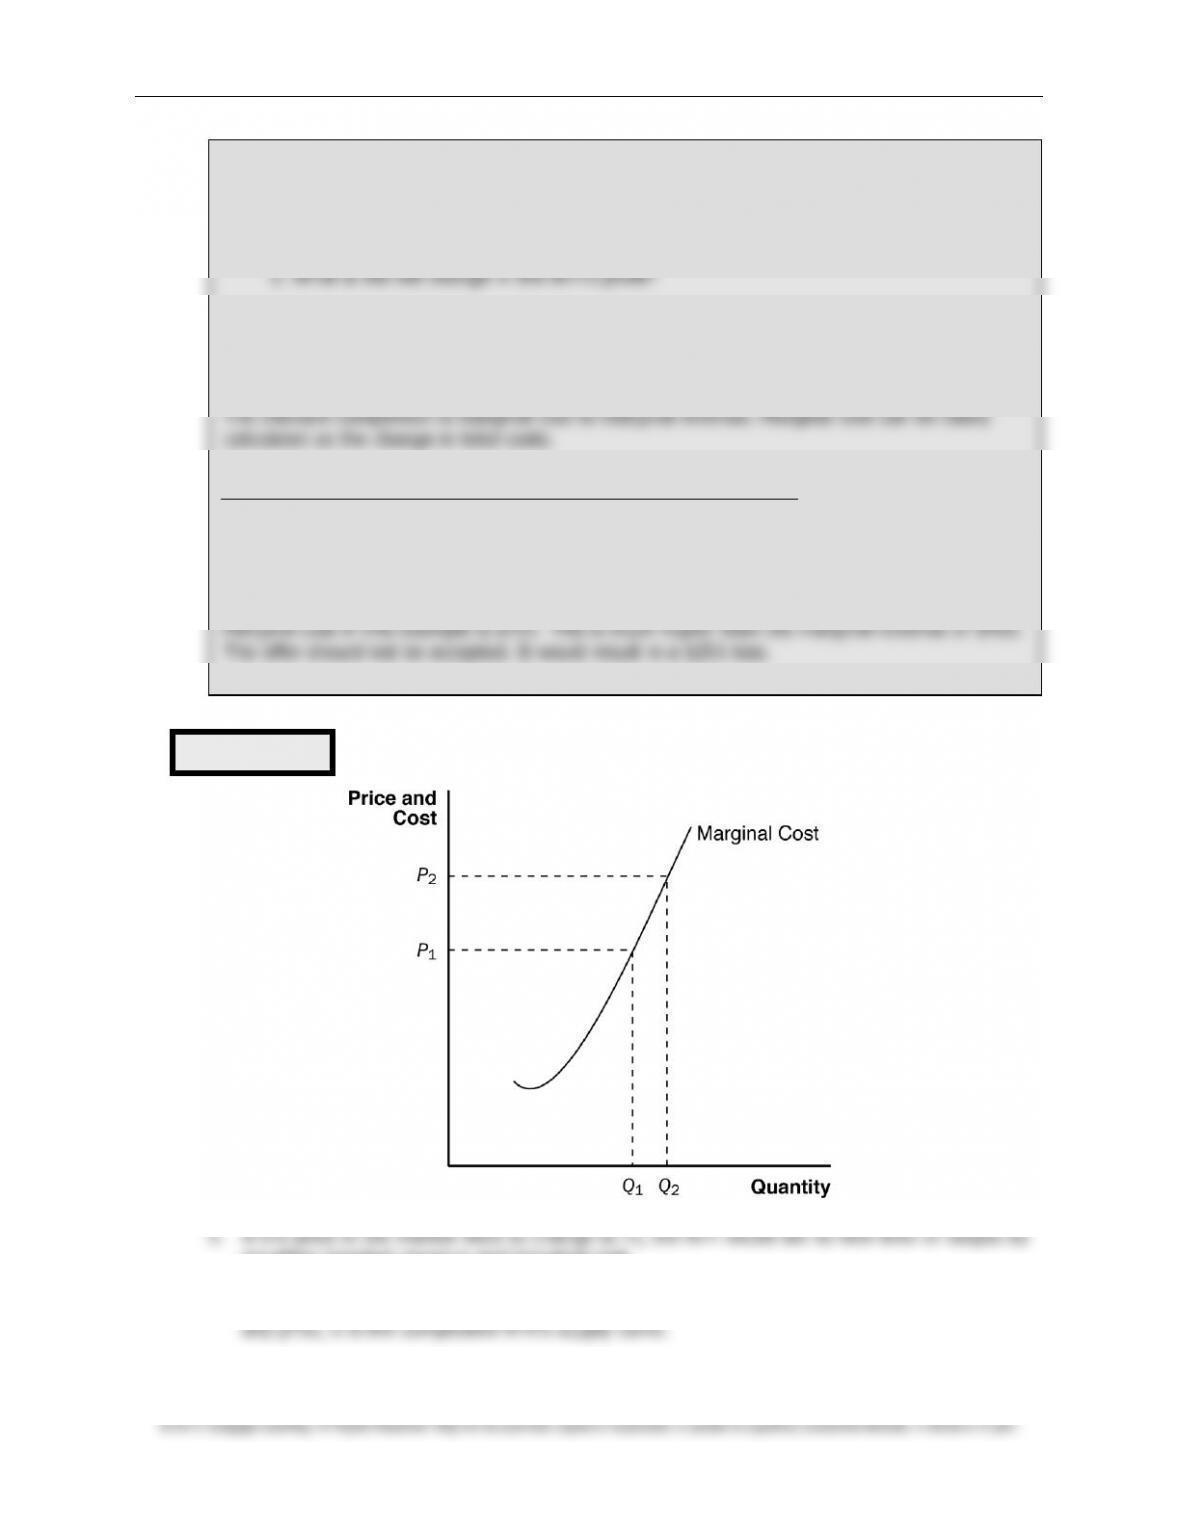
6. Because the firm’s marginal cost curve determines how much the firm is willing to supply at
“The phone rings. It’s a new customer who wants to buy one unit of your product. This
means you would have to increase production to 501 units. Your new customer offers you
$450 to produce the extra unit.”
a. Should you accept this offer?
b. What is the net change in the firm’s profit?
Common Answers and Points for Discussion
Most students will answer “yes.” Selling something for $450 when the average cost of
production is $201 seems like good business. They are wrong.
The relevant comparison is marginal cost to marginal revenue. Marginal cost can be easily
calculated as the change in total costs.
Quantity Average Total Cost Total Cost =
Q
ATC
500 200 100,000
501 201 100,701
$100,701 – $100,000 = $701
Marginal cost in this example is $701. This is much higher than the marginal revenue of $450.
The offer should not be accepted. It would result in a $251 loss.
Figure 2
Chapter 14/Firms in Competitive Markets ❖ 247
C. The Firm’s Short-Run Decision to Shut Down
2. There is a difference between a temporary shutdown of a firm and an exit from the market.
a. A shutdown refers to a short-run decision not to produce anything during a specific
period of time because of current market conditions.
c. One important difference is that, when a firm shuts down temporarily, it still must pay
fixed costs. If a firm exits the industry in the long run, it has no costs.
3. If a firm shuts down, it will earn no revenue and will have only fixed costs (no variable
costs).
its variable costs of production:
Shut down if
TR
<
VC
.
5. Because
TR
=
P
x
Q
and
VC
=
AVC
x
Q
, we can rewrite this condition as:
Shut down if
P
<
AVC
.
a. If the price is less than average variable cost, the firm will produce no output.
b. If the price is above average variable cost, the firm will produce the level of output
where marginal revenue (price) is equal to marginal cost.
If:
The Firm Will:
P
≥
AVC
Produce output level where
MR
=
MC
P
<
AVC
Shut down and produce zero output
248 ❖ Chapter 14/Firms in Competitive Markets
8. Spilt Milk and Other Sunk Costs
recovered.
b. Once a cost is sunk, it is no longer an opportunity cost.
c. Because nothing can be done about sunk costs, you should ignore them when making
decisions.
a. In making a decision of whether to open for lunch, a restaurant owner must weigh
revenue with variable costs. (Much of the cost of running a restaurant is somewhat
fixed.)
D. The Firm’s Long-Run Decision to Exit or Enter a Market
1. If a firm exits the market, it will earn no revenue, but it will have no costs as well.
total costs:
Exit if
TR
<
TC
.
3. Because
TR
=
P
x
Q
and
TC
=
ATC
x
Q
, we can rewrite this condition as:
Exit if
P
<
ATC
.
enter if revenues will exceed costs:
Enter if
P
>
ATC
.
Figure 3
Chapter 14/Firms in Competitive Markets ❖ 249
supply curve will be its marginal cost curve above
ATC
.
If:
The Firm Will:
P
>
ATC
Enter because economic profits are earned
P
=
ATC
Not enter or exit because economic profits are zero
P
<
ATC
Exit because economic losses are incurred
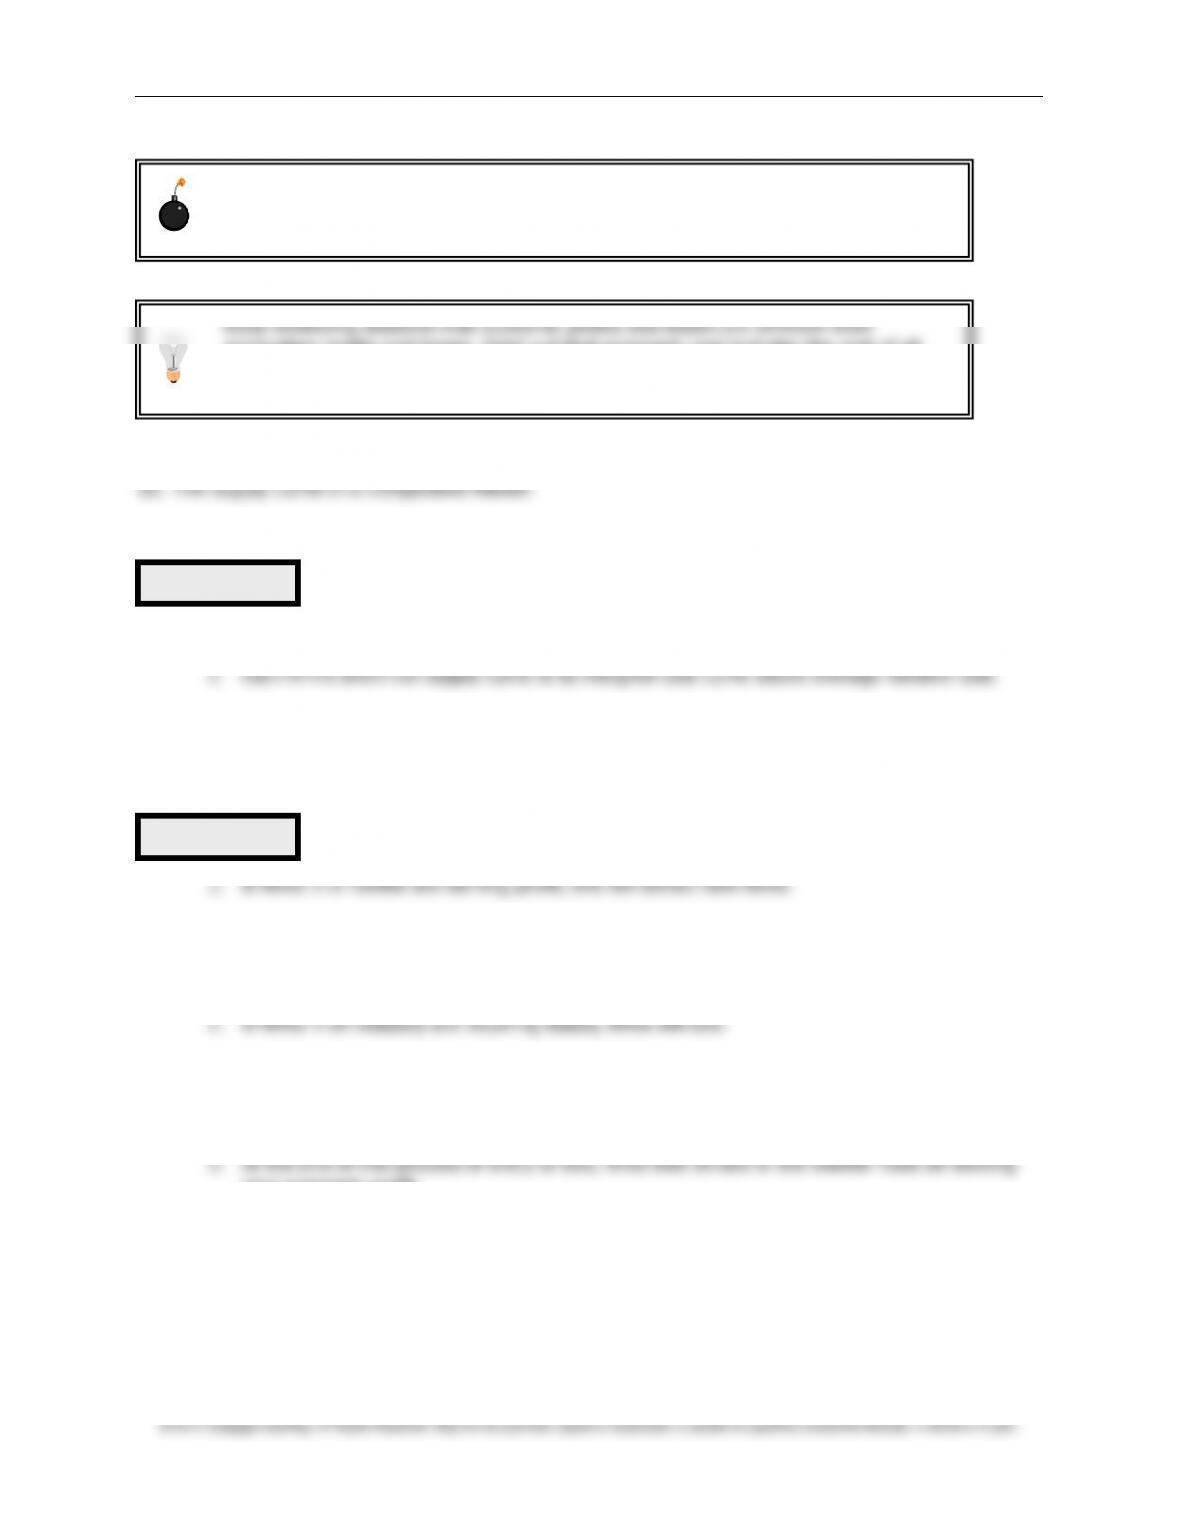
1. Recall that Profit =
TR
–
TC
.
2. Because
TR
=
P
x
Q
and
TC
=
ATC
x
Q
, we can rewrite this equation:
Profit = (
P
–
ATC
) x
Q
.
Figure 4
Figure 5
250 ❖ Chapter 14/Firms in Competitive Markets
A. The Short Run: Market Supply with a Fixed Number of Firms
1. Example: a market with 1,000 identical firms.
3. To get the market supply curve, we add the quantity supplied by each firm in the market at
every given price.
B. The Long Run: Market Supply with Entry and Exit
a. The supply of the product will increase (the supply curve will shift to the right).
b. The price of the product will fall and profit will decline.
a. The supply of the product will decrease (the supply curve will shift to the left).
b. The price of the product will rise and losses will decline.
zero economic profit.
4. Because Profit =
TR
–
TC
, profit will only be zero when:
TR
=
TC
.
5. Because
TR
=
P
×
Q
and
TC
=
ATC
×
Q
, we can rewrite this as:
P
=
ATC
.
Figure 6
Figure 7
Keep reminding students that economic profits and losses are different from
accounting profits and losses. Point out that economic cost includes the cost of all
resources, including a “normal return or profit” to compensate the firm’s owner for
the risks and other efforts put into the business.
Students always want to use the point of minimum average total cost when finding
profit on the graph. Remind them to always find the average total cost of the profit–
maximizing level of output.