1
Chapter 14
Controlling Productivity, Quality, and Safety
After reading and studying this chapter, the student
should be able to:
Explain the concept of productivity.
Identify and explain the ways management,
government, unions, and employees affect
productivity.
Describe some steps supervisors can take to in-
crease productivity.
Differentiate between total quality and quality
control.
Describe the role of variance in controlling
quality.
Identify some important tools in controlling
quality.
Describe the supervisor’s role in supporting lean
organizations.
Explain what the Occupational Safety and Health
Administration (OSHA) does.
Describe the supervisor’s role in promoting
safety.
Brief Outline
Improving Productivity and Cost
Control
2007 the U.S. Achieved the Highest
Productivity in the World
Defining Productivity
Why Productivity Is Important
Groups Influencing Productivity
The Supervisor’s Role in Improving
Productivity
The Supervisor’s Role in Cost Con-
trol
Productivity Improvement Methods
for Controlling Quality
Total Quality and Quality Control
Understanding Variance in Control-
ling Quality
Some Tools for Controlling Quality
The Supervisor’s Role in Achieving
Quality
Learning and Applying some Lean
Concepts
Eliminating Waste
Just in Time (JIT) Inventory Control
Implementing 5S Practices
Promoting Employee Safety
What Occupational Safety Health
Administration Does
Factors Influencing Safety
Causes of Accidents
The Supervisor’s Role in Promoting
Safety
Learning Objectives

SUPERVISORY MANAGEMENT Instructor’s Manual
© 2015 Cengage Learning. All Rights Reserved. May not be scanned, copied or duplicated, or posted to a publicly accessible website, in whole or in part.
2
Park Place Lexus: Committed to Excellence
The concept of organizational excellence can be applied to service organizations, including car
dealerships. Park Place Lexus in Plano, Texas, has set standards for customer satisfaction and holds
“members” responsible for achieving these objectives.
I. Improving Productivity and Cost Control
• Productivity has been an “in” word in American business for the past two decades. Another name
for productivity is efficiency.
A. The U.S. Achieved the Highest Productivity in the World in 2007
• On a global level, a country’s productivity indicates how efficiently its human resources are
used in producing goods and services. The productivity of U.S. workers has and continues to be
high.
• During the 1980s, a major concern was the U.S. productivity stagnation.
• The 1990s saw a dramatic turnaround as U.S. companies grabbed back the initiative and built
new facilities, upgraded technology, transformed production processes and work methods, and
invested heavily in employee training. U.S. productivity generally remained strong, helping
firms keep costs low and enabling them to weather the recent global financial crises and
economic storms. U.S. productivity in 2007 was the highest in the world.
II. Defining Productivity
• Productivity is a measure that compares outputs to inputs, which tells how efficiently a system is
performing.
• Productivity is expressed as a ratio, output divided by input.
• The official productivity measure of the U.S. is based on labor output and input per hour.
• It is the ratio of the total output of the nation’s goods and services to the total hours of labor that
went into producing those goods and services.
• Business organizations also use other input-output performance measures.
• Productivity is expressed as total output relative to total costs, or:
Total output of goods/services (output) ÷ Total costs (input)
• There are three basic ways to increase productivity:
Preview
Lecture Outline

SUPERVISORY MANAGEMENT Instructor’s Manual
o Increase the total output without changing the total input.
o Decrease the total input without changing the total output.
o Increase the output and decrease the input costs.
B. Why Productivity Is Important
• Productivity is important for several reasons. From an individual company’s standpoint,
increased productivity translates into lower prices, larger market share, and greater profits for
the individual firm.
• The firm’s stronger financial position enables it can also invest in research and development,
utilize new advanced technology, increase wages and benefits, and improve working conditions.
• Productivity is important for restaurants and other service-minded businesses.
• On a larger scale, increased productivity greatly enhances the economic growth and health of
the United States. In the international market, companies from the United States compete with
firms from other nations.
• Increased productivity enhances the economic growth and health of the U.S.
• Increased productivity in the U.S. enhances the success of U.S. companies in international
markets, keeps prices down, reduces inflation, and improves our standard of living.
III. Groups Influencing Productivity
1. Management
• A major force in determining productivity is management
• Many experts placed blame on complacent, conservative management for the U.S.’s
deteriorating performance of the 1980s when the U.S. lost ground to foreign producers.
• Supervisors can play an important role in supporting management’s plans and vision for
productivity improvement.
• Fortunately, a turnaround in the 1990s was fueled by management decisions to build plants
that are more modern, upgrade equipment, improve processes, and train employees.
2. Government
• Another important productivity player is government.
• During the 1980s, businesses spent huge amounts on the costs of compliance to satisfy, for
instance, pollution and environmental controls, consumer protection requirements, and
employee safety and health.
• This not only diverted expenditures from more efficient labor-saving technology, equipment,
and plants, but it also required many new positions—such as equal employment opportunity
(EEO) specialists, record keepers, and clerks—to meet government requirements.
• Although government regulation of business is necessary, the amount of regulation is a
source of debate in this country as well as in others.

SUPERVISORY MANAGEMENT Instructor’s Manual
3. Individual Workers
• Employees’ ability, motivation, and commitment affect individual and team performance.
• The age and education of employees impacts their skill.
• During the 1980s, the average age of the workforce workforce employees was much lower
than in earlier years and resulted in less-experienced, less-productive employees during that
period.
• This situation has reversed itself and fostered the United States’ higher productivity during
the 1990s to today.
4. Unions
• Unions also play a role in productivity by their posture toward technology enhancements,
new work methods, and displacement of inefficient jobs.
• Management that directly controls decisions about facilities, technology, research, and the
company “productivity climate,” is most responsible because it strongly impacts
relationships with its union and sets the stage in numerous ways for the productivity of
individual employees.
A. The Supervisor’s Role in Improving Productivity
• Supervisors often have little control over spending for technology and equipment, but as the
persons in direct contact with operating employees, they are important players in the
productivity issue.
• The supervisor needs to learn the new technology and train employees to use it. The employees
may doubt their ability to learn the new technology or may believe it is a threat to their jobs.
The supervisor must be prepared to address these concerns.
• The supervisor is responsible for their employees overall performance. Therefore, it is important
the supervisor learns how to track the productivity of their employee team.
B. The Supervisor’s Role in Cost Control
• Supervisors direct the operating work of an organization; thus, have a key role in controlling a
firm’s costs in labor hours and efficiency, maintenance of machinery and equipment, supplies,
energy, and other matters.
• Budgets are one aid that can help supervisors control costs.
• Since a budget reflects expected performance, it becomes a basis for evaluating a department’s
actual performance.
• A budget does serve as an important supervisory tool by signaling areas that need attention.
• When unfavorable variances occur the supervisor looks for opportunities to generate offsetting
favorable variances. The supervisor can challenge their team to look for ways to cut costs in
other areas.
• Advanced software technology proved especially helpful to supervisors in achieving effective

SUPERVISORY MANAGEMENT Instructor’s Manual
cost control, allowing them to have up-to-the-minute cost data on payroll, raw materials,
utilities, and other costs as nearby as a computer monitor or printer.
IV. Productivity Improvement Methods for Controlling Quality
1. Robotics
• A robot is a machine that is controlled by a computer programmed to perform a number of
repetitive manipulations of tools or materials.
• Japan leads the world in the use of industrial robots.
• Industrial robots are typically used to perform hazardous, monotonous tasks or tasks needing
high speed or precision.
• The ability of the industrial robot to handle these tasks demonstrates the advantages of
industrial robotics. There are however disadvantages such as high costs, space requirements
and the need for high skills to operate and repair the robots. In addition to the industrial uses,
robots are also used in services.
2. Radio Frequency Identification (RFID)
• RFID tags have many uses. A common use is tracking and controlling inventory.
• As the RFID technology improves and the cost decreases many new applications are
developed.
• The use of these tags raises security and privacy issues. The tags can be misused to track
people and their property.
• However, these tags offer businesses several advantages not offered by bar code technology.
RFID tags hold more information than bar codes and unlike bar codes they can be reused.
3. Computer-Assisted Manufacturing
• In computer-assisted manufacturing (CAM) special computers assist automated
equipment in performing processes necessary for production.
• These computers can be reprogrammed to easily produce a part or product to different
specifications.
• Once programmed, the electric signals control the machine processor, resulting in the correct
sequence of steps to complete the task properly.
A. Controlling Quality
• Quality of an organization’s products and services and the organization’s productivity are
closely linked.
• Quality expert Dr. Philip Crosby estimates nonconformance—products and services that do not
match up to requirements—cost the typical manufacturer about 20% of sales and typical sales
firm 35 percent of sales.

SUPERVISORY MANAGEMENT Instructor’s Manual
• This includes the cost of scrapped materials, wasted time, costs of rework, and customers’
exercise of warranties. Thus, quality directly affects the bottom line.
• A second reason for quality consciousness is global competition.
• Moreover, high-quality foreign firms compete vigorously, and that requires U.S. firms to keep
up or lose market share.
• In another reflection of globalization, many organizations require all supplier firms to achieve
ISO 9000 certification, an assurance they meet international quality standards in such areas as
product design, manufacturing processes, testing, inspection, and service.
• A third reason has been the increasing amount of information available to the public regarding
product and service quality.
• Media coverage quickly informs potential consumers about safety problems.
B. Total Quality and Quality Control
• Sometimes the terms total quality and quality control are used interchangeably. However, they
are not the same.
• Total quality refers to an organization’s overall effort to achieve customer satisfaction through
continuous improvement of products, services, and processes. It indicates its
comprehensiveness, involving all management levels, employees, suppliers, and customers.
• Increased quality leads to more customers and increased market share that enable greater
profitability.
• Quality control, on the other hand, is a narrower process, consisting of the measurement and
analysis of quality performance and actions taken to correct quality problems. It occurs during
or after performance and may include inspection, testing, sampling, and statistical analysis.
C. Understanding Variance in Controlling Quality
• Every product or service is the output or result of a process, a set of related activities designed
to accomplish some goal.
• The nature of processes is to exhibit variation.
• Two types of variation exist: common cause and special cause.
• Common cause variation is a general, routine variation that is built into the system.
• The variation is not routine or expected; clearly, there was excessive variation, or special cause
variation
• Special cause variation occurs intermittently and is associated with a specific event.
• Effective control of quality can have two focuses:
o Reducing common cause variation, which can ordinarily can be corrected only through
management action to improve the process
o Reducing special cause variation, which sometimes be addressed by individual workers.
• Much of the effort by organizations to seek continuous quality improvement is aimed at
reducing common cause variation by improving processes.
• Reducing special cause variation entails identifying the problem, isolating it, examining the
cause, and remedying it.

SUPERVISORY MANAGEMENT Instructor’s Manual
• The supervisor needs to understand what level of quality performance is due to normal or
special cause variables.
D. Some Tools for Controlling Quality
• A number of tools are available to assist in effective control of quality.
• These tools apply not just to the quality of manufacturing processes (although this is perhaps the
most common application), but to service processes as well.
1. Check sheets
• The check sheet does not require the use of a computer. An effective check sheet can be
developed using a pencil and paper.
• Check sheets can be used to collect data on a variety of situations such as reasons for
shipment rejections, equipment failures, and tallies of weights to name a few.
2. Flowchart
• A flowchart is a visual representation of the sequence of steps needed to complete a process.
• Its purpose is to help individuals understand the process they are attempting to control.
• Flowcharts are frequently used by problem-solving teams to address quality issues involving
processes with a number of sequential steps to complete.
• The visual representation of the process enables team members to analyze the relevant steps
and note where improvements can be made.
3. Histogram
• A histogram is a graphical representation of the variation found in a set of performance data.
• It can provide clues about the population’s characteristics.
• The visual presentation reflects how the process’s output varies and what proportion of
output falls outside of the process’s performance targets.
4. Run Chart
• A run chart is a data presentation that shows results of a process plotted over time.
• It might be used to show the number of hotel checkouts per hour, the number of employee
absentees per day, or the percentage of customers waiting in excess of one minute to be
seated.
5. Pareto Charts
• Pareto chart helps problem solvers zero in on the dominant rather than trivial problem.
• They are problem-analysis charts that use a histogram to illustrate the sources of problems.

SUPERVISORY MANAGEMENT Instructor’s Manual
• They typically list problem causes from left to right in descending order of seriousness.
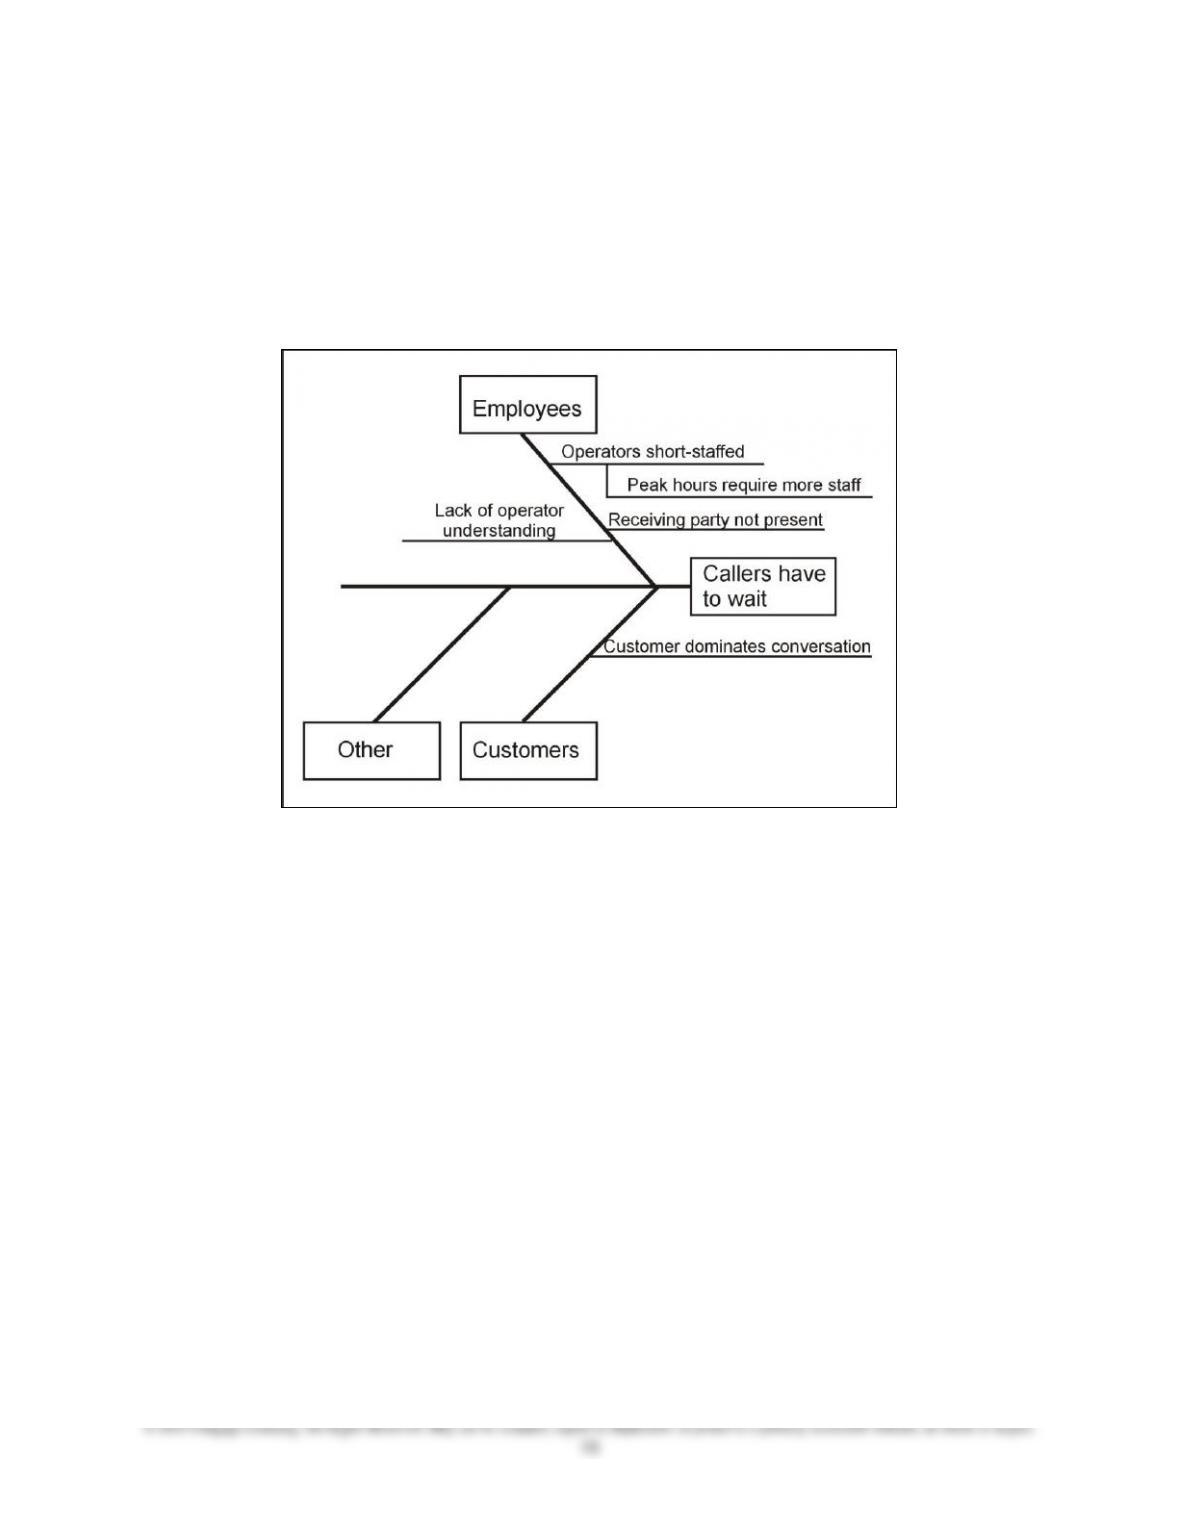
6. Cause-and-Effect diagram
• A useful tool for understanding and identifying the causes of performance problems is the
cause-and-effect diagram.
• This is also called a fishbone or Ishikawa diagram, named for the Japanese quality expert
who popularized it
• The diagram represents a graphical display of a chain of causes and effects.
7. Control Chart
• The control chart is the “backbone” of statistical process control (SPC) and displays the
“state of control” of a process.
• If a process is free from special cause variation, the process is said to be under control.
E. The Supervisor’s Role in Achieving Quality
• Lower-level managers and first-line supervisors have the critical role, because it is operating-
level personnel who directly perform the activities of producing the goods or services that
address customers’ needs.
• One survey confirmed the crucial role played by first-line supervisors.
• A written survey found that the quality of service employees delivered was strongly impacted
by the extent to which their supervisor:
o Emphasized the importance of high quality
o Provided information and support to help employees achieve it
o Provided meaningful feedback
• Motivating workers to perform high-quality work consistently is one of the most difficult jobs a
supervisor faces.
• Two ways to do this are to:
1. Let Employees Know You Expect Quality Performance
• Many firms try to inspect quality into their products or services rather than make it right the
first time.
• Fortunately, some companies and supervisors should emphasize the right way from the start
by stating their high quality expectations.
• The best place to make an impact regarding your quality expectations is with the new
employee.
• Sometimes a quality control specialist will help a line supervisor determine the quality of
workers’ performance by presenting run charts, histograms, or other statistical tools.
2. Involve Workers in Achieving and Controlling Quality

SUPERVISORY MANAGEMENT Instructor’s Manual
• Quality teams are an important part of the quality scene. These may include special cross-
functional teams and self-directed teams, or teams from within individual work groups.
• Problems (and opportunities) can be brought up by team members, team leaders, or higher
management.
• These quality teams are implemented formally and require top management’s approval and
commitment.
• Individual supervisors may, however, capture the spirit of employee involvement on their
own.
• Since workers are so directly involved in the actual work, they frequently have excellent
suggestions.
VI. Learning and Applying some Lean Concepts
• The Lean Approach consists of techniques and approaches aimed at eliminating waste. Lean
concepts can be applied to all types of business, not just manufacturing.
• The supervisor can support managements’ efforts in building a lean organization by focusing on
eliminating waste, just in time inventory control and adopting five S (5S) practices.
1. Eliminating Waste
• Eliminating waste is often considered by its narrowest definition—when material is misused
and must be discarded.
• A lean operation thinks more broadly about the elimination of waste. Lean operations view
waste as anything that does not add value.
• The lean organization takes the customer’s viewpoint of value. In a lean organization there
are seven types of waste:
o Overproducing is making too much too soon. Materials are purchased before they are
needed to serve the customer. Labor to produce the product is scheduled before it is
needed. Space is wasted storing the product until the customer needs it.
o Movement is another form of waste. If employees are walking from area to area
without adding value to the product, this is wasteful. The manager needs to carefully
observe the work area to determine if poor layout, work design, or product design is
the cause of the movement.
o Transportation within the same facility or from facility to facility can be wasteful. The
lean organization attempts to locate production, warehousing, and supplier facilities as
close together as possible.
o Waiting is a form of waste due to inactivity. . It is the role of the manager to
investigate the cause of inactivity and initiate corrective action.
o Examples of waste due to over processing include unnecessary inspections, adding
unnecessary steps or time to production, or outdated product designs. The supervisor
should work closely with product development and engineering personnel to eliminate
extra processing waste.
o Defects result in rework or scrap. The customer determines if the quality of the

SUPERVISORY MANAGEMENT Instructor’s Manual
product or service is acceptable. The product or service either meets the customers’
expectations or falls short of expectations. Shortfalls are defective. Rework requires
additional resources in order to correct the product.
o Reducing or eliminating the need for inventories is a challenging goal but lean
organizations seek to produce only the products needed by the customer, when they
are needed. This is a challenging endeavor. Holding excess inventory is costly.
2. Just-In-Time Inventory Control
• Just-in-time inventory control (JIT) system, pioneered by Toyota, is a system whereby
materials (inputs) arrive as close as feasible to the time they are needed in the production
process.
• Through enhanced technologies, companies’ link with their suppliers to keep them informed
about their up-to–the-minute needs.
• JIT enhances an organization’s flexibility and profitability by minimizing or in some cases
completely eliminating inventory holding and storage costs.
• Other companies like Wal-Mart, Home Depot, and Trader Joe’s also practice JIT from their
hundreds of suppliers.
3. Implementing the S5 Practices
• These practices promotes good housekeeping essential in a variety of production
environments.
• For the lean organization, adopting 5S is a key tool. The 5S’s are sort, straighten, shine,
standardize, and sustain.
o Sort, the first of the 5S’s, guides the supervisor to remove unneeded materials from the
work area. The supervisor works with the employees to keep only what is needed.
o Once the work team succeeds in removing the unneeded items, the employees are
ready for straighten. The end result is a neatly arranged and organized work area.
o The employees are ready to shine and clean the work area. The cleaning needs to be
thorough and complete.
o The cleaning process needs to be formalized and standardized. Standard procedures
for cleaning need to be written.
o The supervisor needs to make sure the employees are trained to follow the procedures.
In order to sustain the first four practices, the supervisor needs to periodically review
and evaluate the team’s performance.
o To motivate employees, the supervisor may choose to use rewards and incentives to
encourage sustaining good housekeeping.
VII. Promoting Employee Safety
• The subject of employee safety has been in the business limelight since 1970, primarily as a result
of the government’s passage of the Occupational Safety and Health Act (OSHA).
• Management has had an interest in employee safety for over a century because safety, efficiency,

SUPERVISORY MANAGEMENT Instructor’s Manual
and productivity are closely related.
• According to the 2011 Liberty Mutual Workplace Safety Index, the most disabling workplace
injuries and illnesses in 2009 amounted to $50.1 in direct workers compensation costs.
• The overall inflation adjusted direct costs of disabling workplace injuries decreased 4.6% between
1998 and 2009.
A. What the Occupational Safety and Health Administration Does
• The Occupational Safety and Health Administration (OSHA) is a federal agency created by
the Occupational Safety and Health Act in 1970 and went into operation in April 1971.
• To ensure uniformity and enforcement, the federal government stepped into the picture.
• OSHA ensures that state governments, labor, and management provide consistently safe and
healthy working conditions for employees.
• OSHA requires organizations to keep safety logs and records of illnesses and injuries incurred
on the job.
• OSHA also has the right to develop standards, to conduct inspections to see that standards are
met, and enforce compliance by issuing citations and penalties against organizations that fail to
comply.
• In addition, OSHA provides help by performing pre-investigations upon invitation from the
organization.
B. Factors Influencing Safety
• Several factors affect job safety.
1. Size of Organization
• The safest places to work are the smallest and largest organizations.
• In a small firm, the owner or manager is more personally involved with employees and tends
to take on the role of safety officer. Large firms have more resources available, such as
safety departments, whose sole mission is to improve employee safety.
• Medium-sized firms have neither the direct personal involvement of the top manager, nor the
resources to create full-fledged safety departments.
2. Type of Industry
• Some types of industry are safer than others.
• The rates are highest for general medical and surgical hospitals, general merchandise stores,
administrative and support services, and ambulatory health care services.
• Despite increased safety emphasis, some industries still suffer from a high incidence of
employee lost workdays due to job-related injuries/illnesses.
3. People

SUPERVISORY MANAGEMENT Instructor’s Manual
• The attitudes of managers and supervisors strongly influence the safety of work
performance.
• Moreover, employees’ attitudes, emotions, and physical factors also affect their safety
performance.
C. Causes of Accidents
• Basically, job-related accidents are caused by three types of factors: human, technical, and
environmental.
o Human factors include horseplay, fighting, drug use, poor understanding of equipment or
processes, risk taking, poor attitudes, and fatigue. Human factors account for most
work-related injuries.
o Technical factors include unsafe mechanical, chemical, and physical conditions, such as
defective tools and equipment, poor mechanical construction or design, or improper
personal protective equipment.
o Environmental factors are agents that surrounds the job, such as poor housekeeping,
inadequate lighting and ventilation, or management pressure to increase output.
D. The Supervisor’s Role in Promoting Safety
• Good safety practices among employees help the supervisor in many ways.
• Worker safety is definitely linked to productivity.
• Even though supervisors play a critical role in controlling safety, they cannot do it alone.
• Top management must be committed to such factors such as proper plant layout and design, safe
machinery and equipment, and good physical working conditions.
VIII. Chapter Review
The PowerPoint slides correlated with the Lecture Outline above are available on the Instructors CD-
ROM and on the product support website.
PowerPoint Slide 14-1 Chapter 14 Title
PowerPoint Slide 14-2 Learning Objectives
PowerPoint Slide 14-3 Learning Objectives (continued)
PowerPoint Slide 14-4 Productivity
PowerPoint Slide 14-5 Examples of Productivity Measurements (Text Exhibit 14-3)
PowerPoint Slide 14-6 Importance of Productivity
PowerPoint Slide 14-7 Groups Influencing Productivity
PowerPoint Slide 14-8 How Supervisors Can Improve Employee Productivity
PowerPoint Slide 14-9 How Supervisors Can Improve Employee Productivity (continued)
Visual Resources

SUPERVISORY MANAGEMENT Instructor’s Manual
PowerPoint Slide 14-10 Supervisor’s Role in Cost Control
PowerPoint Slide 14-11 Productivity Improvement Methods for Controlling Quality
PowerPoint Slide 14-12 Deming’s Fourteen Points for Quality
PowerPoint Slide 14-13 Deming’s Fourteen Points for Quality (continued)
PowerPoint Slide 14-14 Requirements to Win the Malcolm Baldrige National Quality Award
PowerPoint Slide 14-15 Requirements to Win the Malcolm Baldrige National Quality Award
(continued)
PowerPoint Slide 14-16 Reasons for Greater Quality Emphasis
PowerPoint Slide 14-17 Total Quality and Quality Control
PowerPoint Slide 14-18 The Total Quality Chain (Text Exhibit 14-14)
PowerPoint Slide 14-19 Understanding Variance in Controlling Quality
PowerPoint Slide 14-20 Understanding Variance in Controlling Quality (continued)
PowerPoint Slide 14-21 Tools for Controlling Quality
PowerPoint Slide 14-22 Type of Power Failures (Text Exhibit 14-15)
PowerPoint Slide 14-23 Flowchart of a Fast-Food Drive-Through Process (Text Exhibit 14-16)
PowerPoint Slide 14-24 Histogram Showing Frequency and Length of Time Taken by Home Office to
Process Loan Request (Text Exhibit 14-17)
PowerPoint Slide 14-25 Run Chart of Percentage of Restaurant Customers Waiting in Excess of 1
Minute to Be Seated (Text Exhibit 14-18)
PowerPoint Slide 14-26 Tools for Controlling Quality
PowerPoint Slide 14-27 Pareto Chart of Customers’ Complaints about Restaurants (Text Exhibit 14-
19)
PowerPoint Slide 14-28 Cause-and-Effect Diagram for “Why Tables Are Not Cleared Quickly” (Text
Exhibit 14-20)
PowerPoint Slide 14-29 Example of a Control Chart (Text Exhibit 14–21)
PowerPoint Slide 14-30 Supervisor’s Role in Achieving Quality
PowerPoint Slide 14-31 Characteristics of Effective Employee Involvement Teams (Text Exhibit 14-
22)
PowerPoint Slide 14-32 Lean Approach
PowerPoint Slide 14-33 OSHA
PowerPoint Slide 14-34 Factors Influencing Safety
PowerPoint Slide 14-35 Causes of Accidents
PowerPoint Slide 14-36 What Supervisors Can Do to Improve Safety
PowerPoint Slide 14-37 What Supervisors Can Do to Improve Safety (continued)
PowerPoint Slide 14-38 What Supervisors Can Do to Improve Safety (continued)
PowerPoint Slide 14-39 Important Terms
1. Explain what happened to U.S. productivity in 2007.
In the 1980s productivity in the U.S. stagnated. As U.S. productivity suffered, Japanese and other
foreign competitors stole market share with their high-quality products. The 1990s saw a dramatic
Solutions to the Questions for Review & Discussion
SUPERVISORY MANAGEMENT Instructor’s Manual
turnaround as U.S. companies built new facilities, upgraded technology, transformed production
processes and work methods, and invested heavily in employee training. U.S. productivity generally
remained strong, helping firms keep costs low and enabling them to weather the recent global
financial crises and economic storms. U.S. productivity in 2007 was the highest in the world.
2. Do you believe that management and unions must always be on opposite sides of the productivity
issue? Why or why not?
3. Identify some of the steps that supervisors can take to improve their department’s productivity.
4. How does quality control differ from total quality? Explain. Describe the role of variance in
controlling quality.
Total quality is the entire system of policies, procedures, and guidelines that an organization installs
to attain and maintain quality. It confronts quality in advance and throughout the operating process.
Quality control is a narrower process and consists of the measurements designed to see if the desired
quality is being met. It typically uncovers problems after they have occurred.
The nature of processes is to exhibit variation. The two types of variations that exist are common
cause and special cause. Common cause variations are general, routine variations that are built into
the system, while special cause variations are not routine or expected. Effective control of quality
can have two focuses: reducing common cause variation and reducing special cause variation.
5. Identify each of the following tools in controlling quality: Pareto chart, run chart, and flowchart.
Some important tools in managing quality are flow charts, histograms, run charts, Pareto charts,
6. Explain the supervisor’s role in supporting lean concepts.
The supervisor can support managements’ efforts in building a lean organization by focusing on
eliminating waste, just in time inventory control and adopting five S (5S) practices. The 5S’s are
sort, straighten, shine, standardize, and sustain.

SUPERVISORY MANAGEMENT Instructor’s Manual
7. What does OSHA do?
8. Describe some ways the supervisor impacts safety performance.
Since the supervisor is held accountable for safety, it is important that he or she promotes good
safety control. When accidents occur the supervisor must spend time filling out accident reports,
attending meetings to investigate the accident, and in some cases temporary or full-time
replacements must be recruited, selected, and trained. All these activities cause a strain on the
company, and sometimes productivity suffers.
The supervisor plays a vital role in safety prevention, and there are several things that he or she can
do to improve safety: establish and communicate safety goals for the department, prohibit use of
unsafe or damaged equipment, refuse to tolerate horseplay, encourage reporting of unsafe conditions,
and enforce the rules when they are broken.
Skill Builder 14.1
Determining Productivity Measurements
Works with SCANS competencies: Interpersonal Skill, Information
Instructions:
• For each of the organizations shown, identify some important productivity measures that managers
could use to measure the efficiency of their organization. (Hint: Think broadly, including measures
that go beyond profitability or cost measures.)
• Meet with groups of four to six other students and discuss your items.
• Present your results to the whole class.
(a) Bank. Operating costs, employee salary
(b) Community college. Student retention rate, student evaluation of faculty, GPA of graduates at
senior colleges
(c) Large laundry/dry cleaners. Percent damaged items, number of items processed per employee
(d) Hospital. Operating costs, number of hospital-borne infections, lab accuracy rate
(e) Restaurant. Operating costs, percent of food wastage
Solutions to the Skill Builders

SUPERVISORY MANAGEMENT Instructor’s Manual
Skill Builder 14.2
Quality Survey
Works with SCANS competencies: Information, Resources, Systems
Visit a local fast food restaurant, such as McDonald’s, Burger King, or Wendy’s and order a meal.
Instructions:
• During your visit, perform a quality analysis of the store, including but not limited to:
(a) external store appearance, including shrubbery, cleanliness, and upkeep of outer building and
parking lot
(b) drive-through, including ease, speed, and accuracy
(c) cleanliness of inner store, including tables, floors, and restrooms
(d) employee factors, including appearance, friendliness, and efficiency
(e) service factors, including speed and accuracy
(f) food quality, including taste, freshness, temperature, and portion size
• Assume that you were store manager and wanted to improve the areas that you found to be weak.
Outline the corrective actions that you would take.
• Meet with other student groups of five to six students to discuss your findings.
• Student groups will have varied experiences. Check to see if there are consistencies among student
responses.
Fast food restaurant chains live or die on their brand reputation. Customers want to know that the
McDonald’s they visit in California will have the same menu choices and quality standards as the
McDonald’s they visit in New York, or Washington, or Alabama. Ask the groups to rate the local
restaurant they visited against others from previous experience.
Skill Builder 14.3
Implementing Lean 5S Practices
Works with SCANS competencies: Interpersonal Skill, Information, Resources, Systems
One of the cornerstones of lean organizations is the effective implementation of 5S practices. The first
three of these is sort, straighten, and shine. To accomplish sort, the employees need to discard unneeded
items and the straighten practice requires organizing the needed items. The third practice of shine is
cleaning the work area until it shines. After the employees accomplish the first three practices they need
to recognize this is not a onetime effort. Lacking a plan to sustain these practices, in time unneeded items
will creep back into the work area. The work area will revert to a disorganized condition. It will be dirty
and need cleaning.
After the employees complete the first three practices, the supervisor needs to focus on accomplishing the
fourth and fifth practice of standardize and sustain. Implementing the practices of standardize and sustain,
the supervisor is on a path to build a permanent5S practice. The practice of standardize requires the
supervisor write standard operating procedures and checklists for the first three practices. For the fifth
practice of sustain, the supervisor formulates a method to evaluate employee performance and provide

SUPERVISORY MANAGEMENT Instructor’s Manual
incentives to encourage employee success. These practices need to be formalized and structured so they
become part of the employees work routine.
• Meet with groups of students to discuss strategies for assigning the first three practices to
employees. Will you assign the work by area, by task or by employee preference? Will you rotate
assignments?
• How will you motivate the employees to continue to sort, straighten and shine? How will you
evaluate employee performance?
Skill Builder 14.4
Increasing Safety Performance
Works with SCANS competencies: Interpersonal Skill, Information, Resources, Systems
Instructions:
• Outline a plan for bringing your employees’ safety performance next year up to the average of
other stores in the chain. You may assume your boss has approved a one-time $1,000 safety budget
allocation to spend as needed to help you achieve this goal.
• Meet with a group of other students to share your ideas. Your instructor may ask you to select a
spokesperson to summarize the ideas of your team members.
The first step in improving quality would be defining the problem. Why have there been so many
accidents? A good first step would be for the supervisor to conduct a safety audit. Is any equipment
unsafe? Do employees know the importance of safety equipment?
Perhaps the store should conduct a safety seminar to update all employees on safety policies and
procedures. The supervisor should communicate to employees that safety is a priority goal. Also, use the
employee’s performance review to stress that safety performance will be linked to rewards. The
supervisor should ask employees to recommend safety improvements. It may even be possible to involve
them in the decision on how to allocate the emergency safety budget.
Skill Builder 14.5
Clarence, an Ally in Improving Labor Productivity
Works with SCANS competencies: Interpersonal Skill, Information, Resources
After reading the situation explained in the text, ask your students to follow the following instructions to
answer the questions:
• How can Sarah gain Clarence’s support to eliminate his job? Develop a plan of action to gain
Clarence’s support.
• Team up with another student and share your plans with each other.
• Based on what you both have shared, come to a consensus on how best to approach Clarence and
prepare a role play to perform in front of the class to demonstrate how Sarah can be successful.
Solutions to the Case
SUPERVISORY MANAGEMENT Instructor’s Manual
Case 14-1
Using Quality Tools
Form a group of three to five students and, based on the conversation between Nagy and his staff:
1. Draw a cause-and-effect diagram.
PowerPoint Slide 14-38: “Cause-and-Effect Diagram” also presents this solution.
2. Perform a Pareto analysis of the data collected.
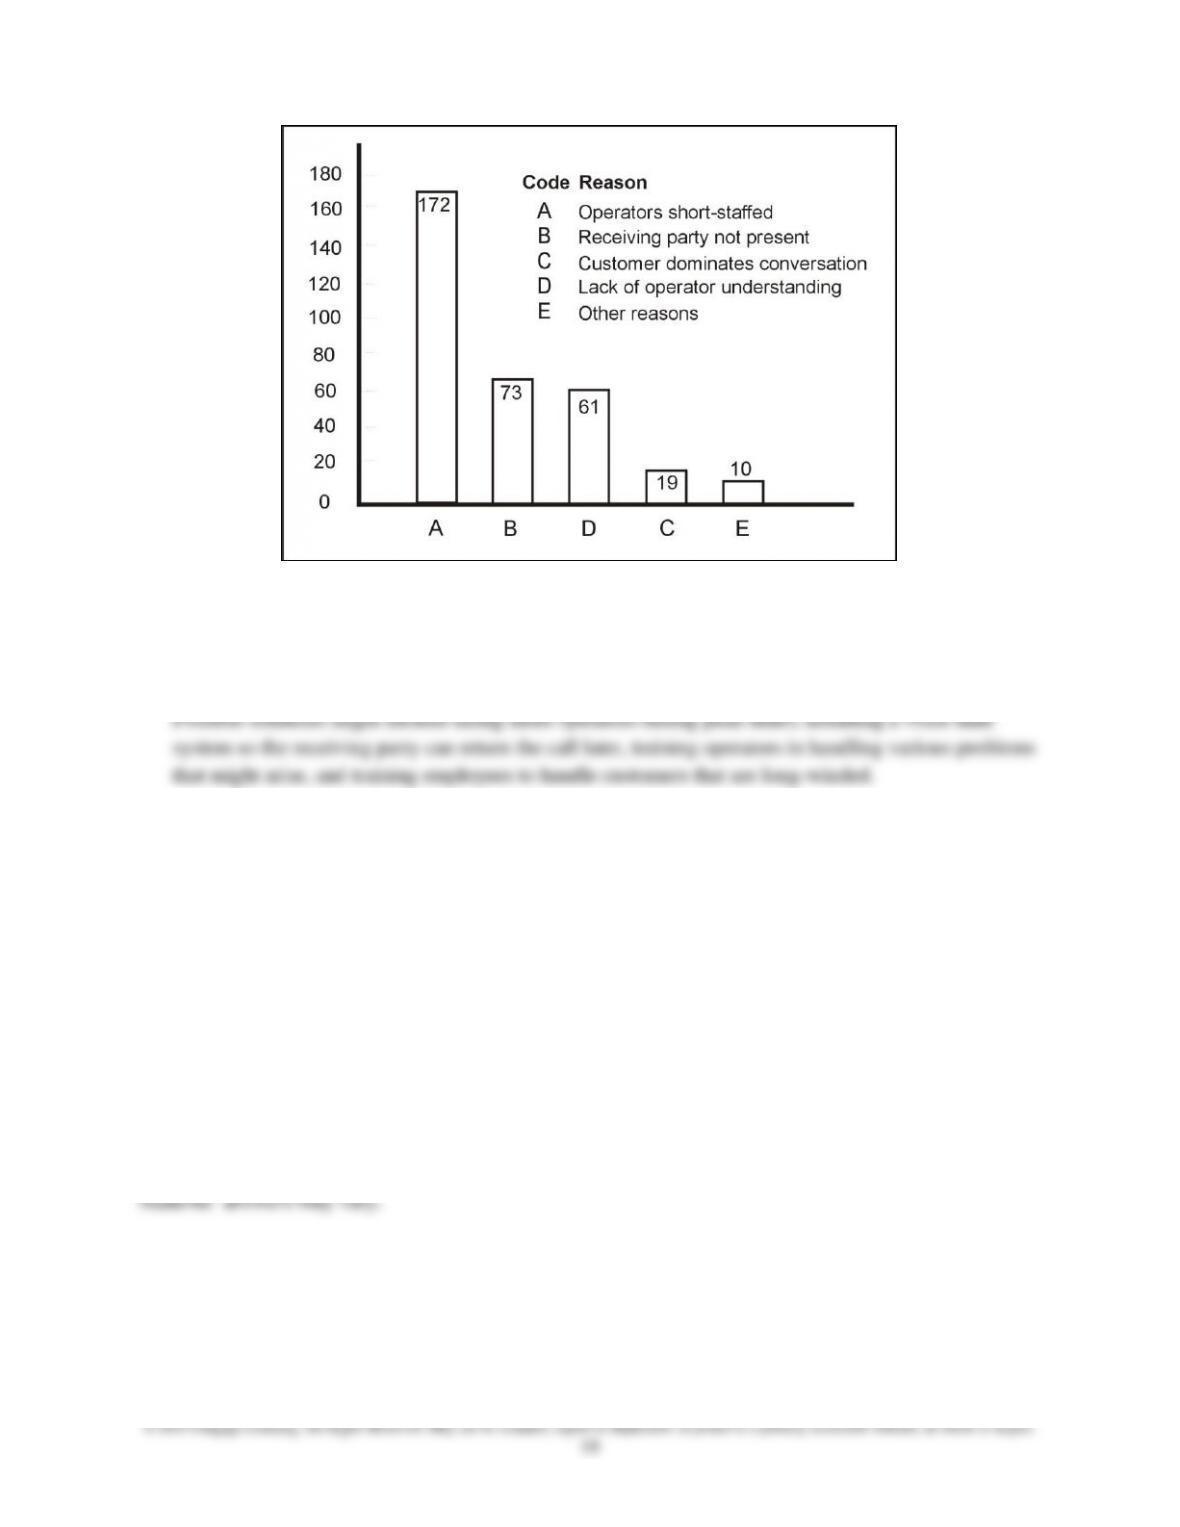
SUPERVISORY MANAGEMENT Instructor’s Manual
PowerPoint Slide 14-39: “Pareto Analysis” also presents this solution.
3. Develop some possible actions that the company might take to improve the situation.
Case 14.2
Eliminating Waste
Answer the following questions based on the conversation between the President and the consultant.
• Assume you are a supervisor working for the Healthy Beverage Company. How will you go about
explaining the 7 wastes to your employees?
• Form groups of three to five students and brainstorm ways to reduce movement. Wasted movement
occurs when an employee is walking without purpose. The employee is not adding value to the
product. Why would this occur and how can it be corrected?
• Form groups of three to five students and brainstorm ways to reduce waiting. What are some of the
possible causes for employee waiting?