
Glen Mount Furniture Company
Case 3
Financial Leverage
Purpose: The potential impact of changes in the debt level on earnings per share is the central focus of
the case. However, the instructor can derive educational benefits that go well beyond this point. The
central figure in the case is frustrated by security analyst’s short-term emphasis on earnings per share and
their lack of concern for the long-term fundamentals associated with his firm. This rather common
situation can be drawn upon to make for a more dynamic discussion process. The student is given ample
opportunities to calculate EPS under different financial leverage strategies and to examine debt ratios, and
degrees of leverage.
Relation to Text: The case should follow Chapter 5. Because the case has some elementary valuation
considerations as well, it also could be used later in the course.
Complexity: The case is moderately complex. It should require 1 hour.
Solutions
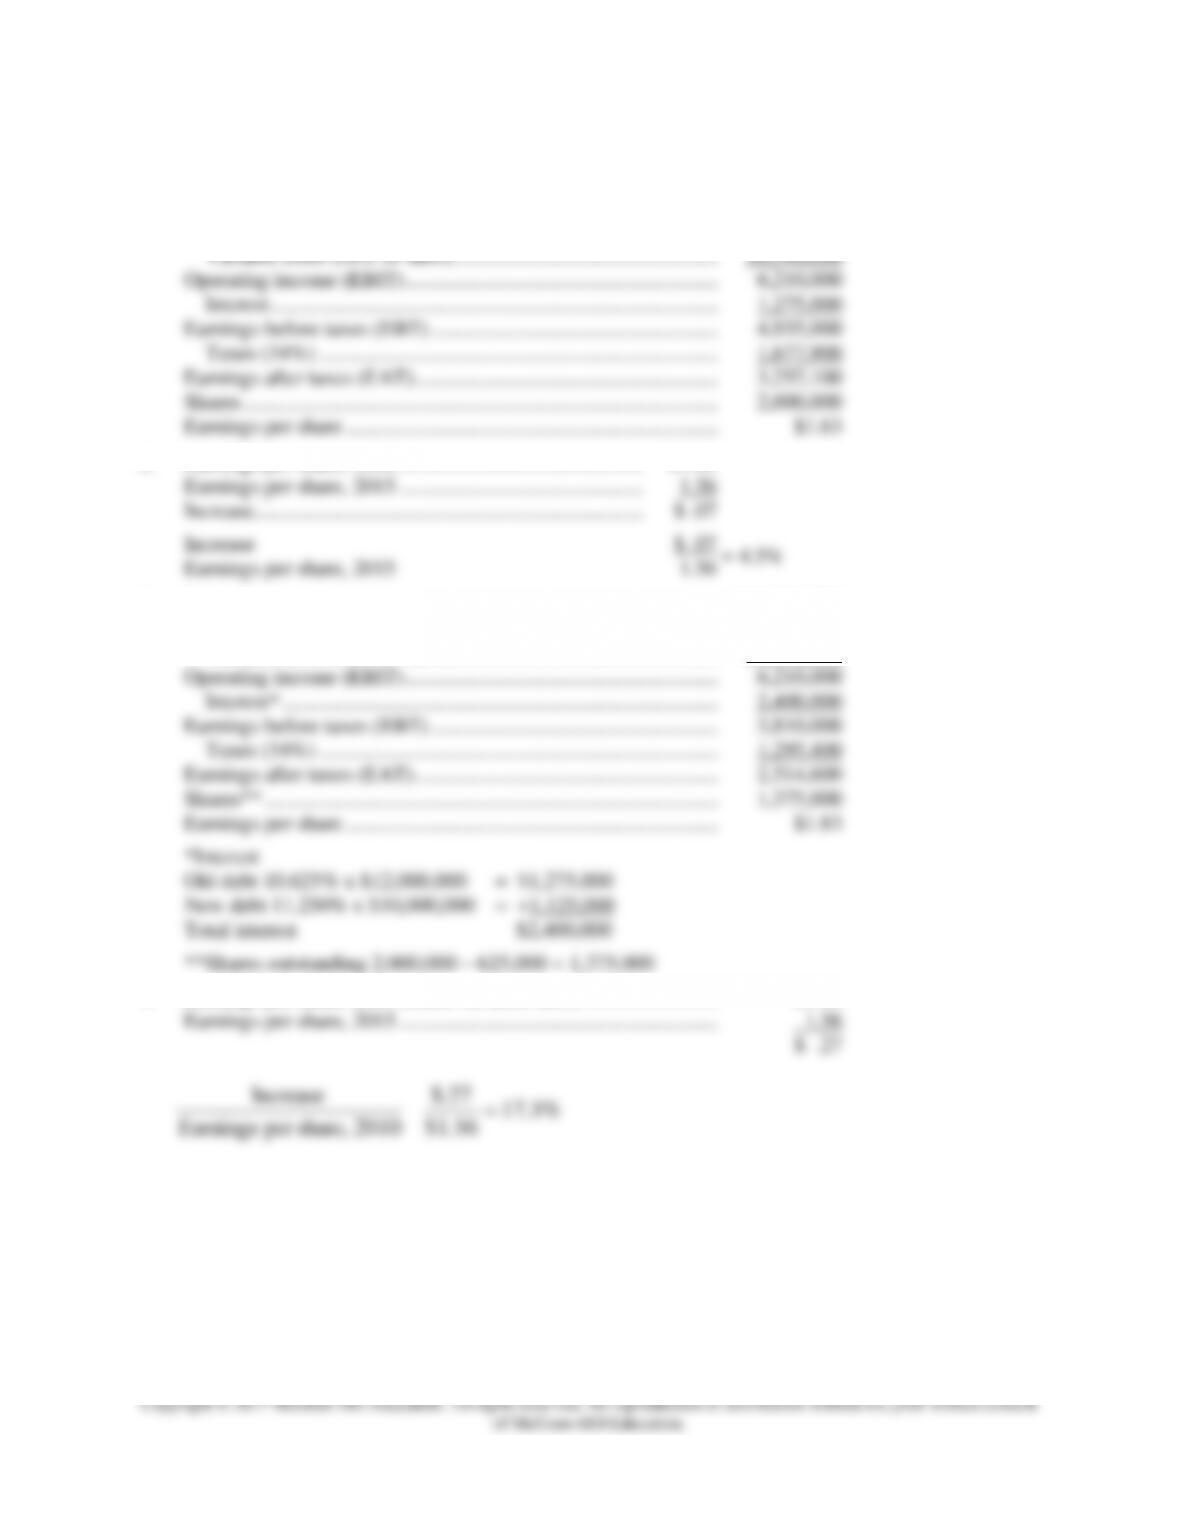
1.
Sales ($45,500,000 + $500,000 …………………………………………….
$45,500,000
Fixed costs ………………………………………………………………………
12,900,000
Variable costs (58% of sales) …………………………………………….
26,390,000
Operating income (EBIT) ……………………………………………………..
6,210,000
Interest ……………………………………………………………………………
1,275,000
Earnings before taxes (EBT) …………………………………………………
4,935,000
Taxes (34%) ……………………………………………………………………
1,677,900
Earnings after taxes (EAT) ……………………………………………………
3,257,100
Shares ………………………………………………………………………………..
2,000,000
Earnings per share ……………………………………………………………….
$1.63
2.
Earnings per share, 2016 ………………………………………..
$1.63
Earnings per share, 2015 ………………………………………..
1.56
Increase ………………………………………………………………..
$ .07
Increase
$ .07
= 4.5%
Earnings per share, 2015
1.56
3.
Sales ………………………………………………………………………………….
$45,500,000
Fixed costs ………………………………………………………………………
12,900,000
Variable costs (58% of sales) …………………………………………….
26,390,000
Operating income (EBIT) ……………………………………………………..
6,210,000
Interest* ………………………………………………………………………….
2,400,000
Earnings before taxes (EBT) …………………………………………………
3,810,000
Taxes (34%) ……………………………………………………………………
1,295,400
Earnings after taxes (EAT) ……………………………………………………
2,514,600
Shares** …………………………………………………………………………….
1,375,000
Earnings per share ……………………………………………………………….
$1.83
*Interest
Old debt 10.625% x $12,000,000
= $1,275,000
New debt 11.250% x $10,000,000
= +1,125,000
Total interest
$2,400,000
**Shares outstanding 2,000,000 – 625,000 = 1,375,000
4.
Earnings per share, 2016 (based on more debt) ………………………
$1.83
Earnings per share, 2015 ……………………………………………………..
1.56
$ .27
%3.17
56.1$
27$.
2010share,perEarnings
Increase =
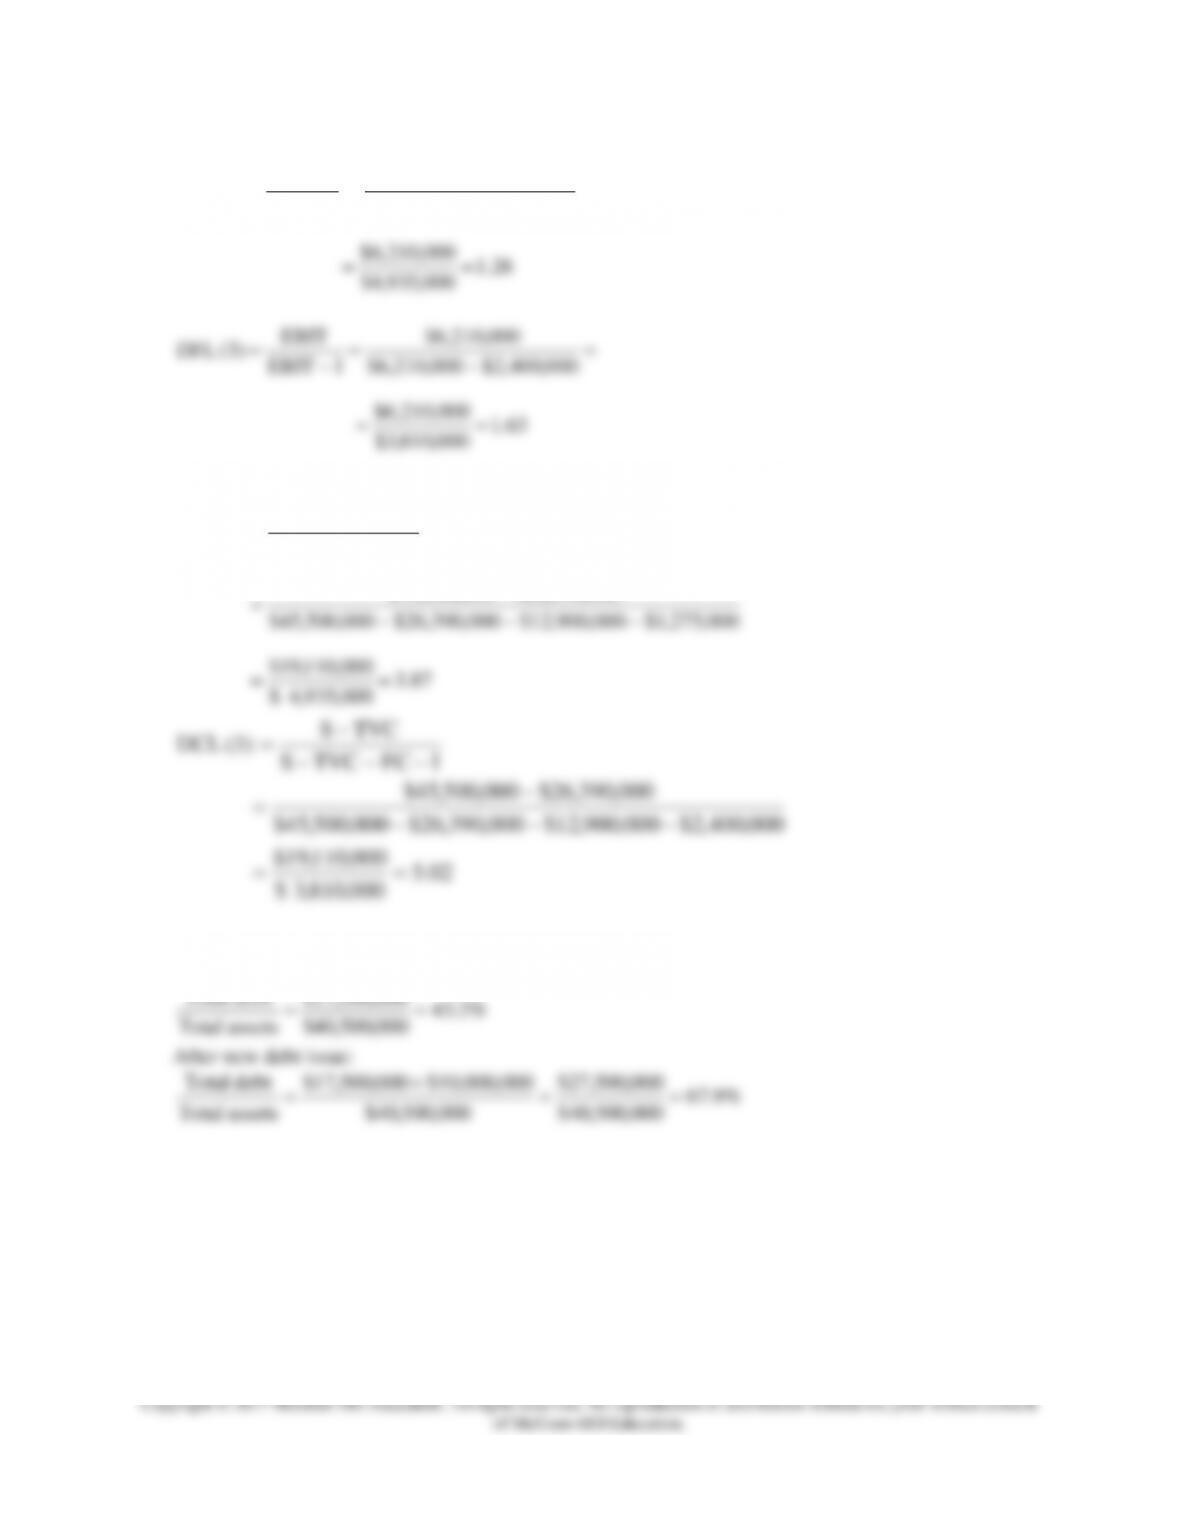
26.1
000,935,4$
000,210,6$
000,275,1$000,210,6$
000,210,6$
I–EBIT
EBIT
(1) DFL.5
==
=
−
==
63.1
000,810,3$
000,210,6$
==
000,390,26$000,500,45$
IFCTVCS
TVCS
(1)DCL6.
−
−−−
−
=
7. From Figure 2:
%2.43
000,500,40$
000,500,17$
assetsTotal
debtTotal ==
After new debt issue:
%9.67
000,500,40$
000,500,27$
000,500,40$
000,000,10$000,500,17$
assetsTotal
debtTotal ==
+
=
8. There are two conflicting factors that could influence the stock price.
On the positive side, earnings per share would be twenty cents higher with more debt ($1.83 versus
$1.63).
Based on a current price-earnings ratio of about 10 (the repurchase price for the shares is for $16