
Chem-Med Company
Case 2
Ratio Analysis
Purpose: The case allows the student to go into financial analyses in more depth than in possible with
end-of-chapter problems. In addition to computing a series of ratios, the student must consider industry
data and trends for the purpose of evaluating relative performance. The student must also make use of the
Du Pont system of analysis. Of special interest are the debt and performance covenants established by the
potential financier. Finally, the student is forced to identify the impact of extraordinary income on ratio
analysis and how it can distort one year’s performance.
Relation to Text: The case should follow Chapter 3.
Complexity: The case is moderately complex. It should require 1-1½ hours.
Solutions
1. Sales Growth = (Sales this year – Sales last year) / Sales last year
for 2015
$ 3,814
–
$3,051
/
$3,051
=
+
25%
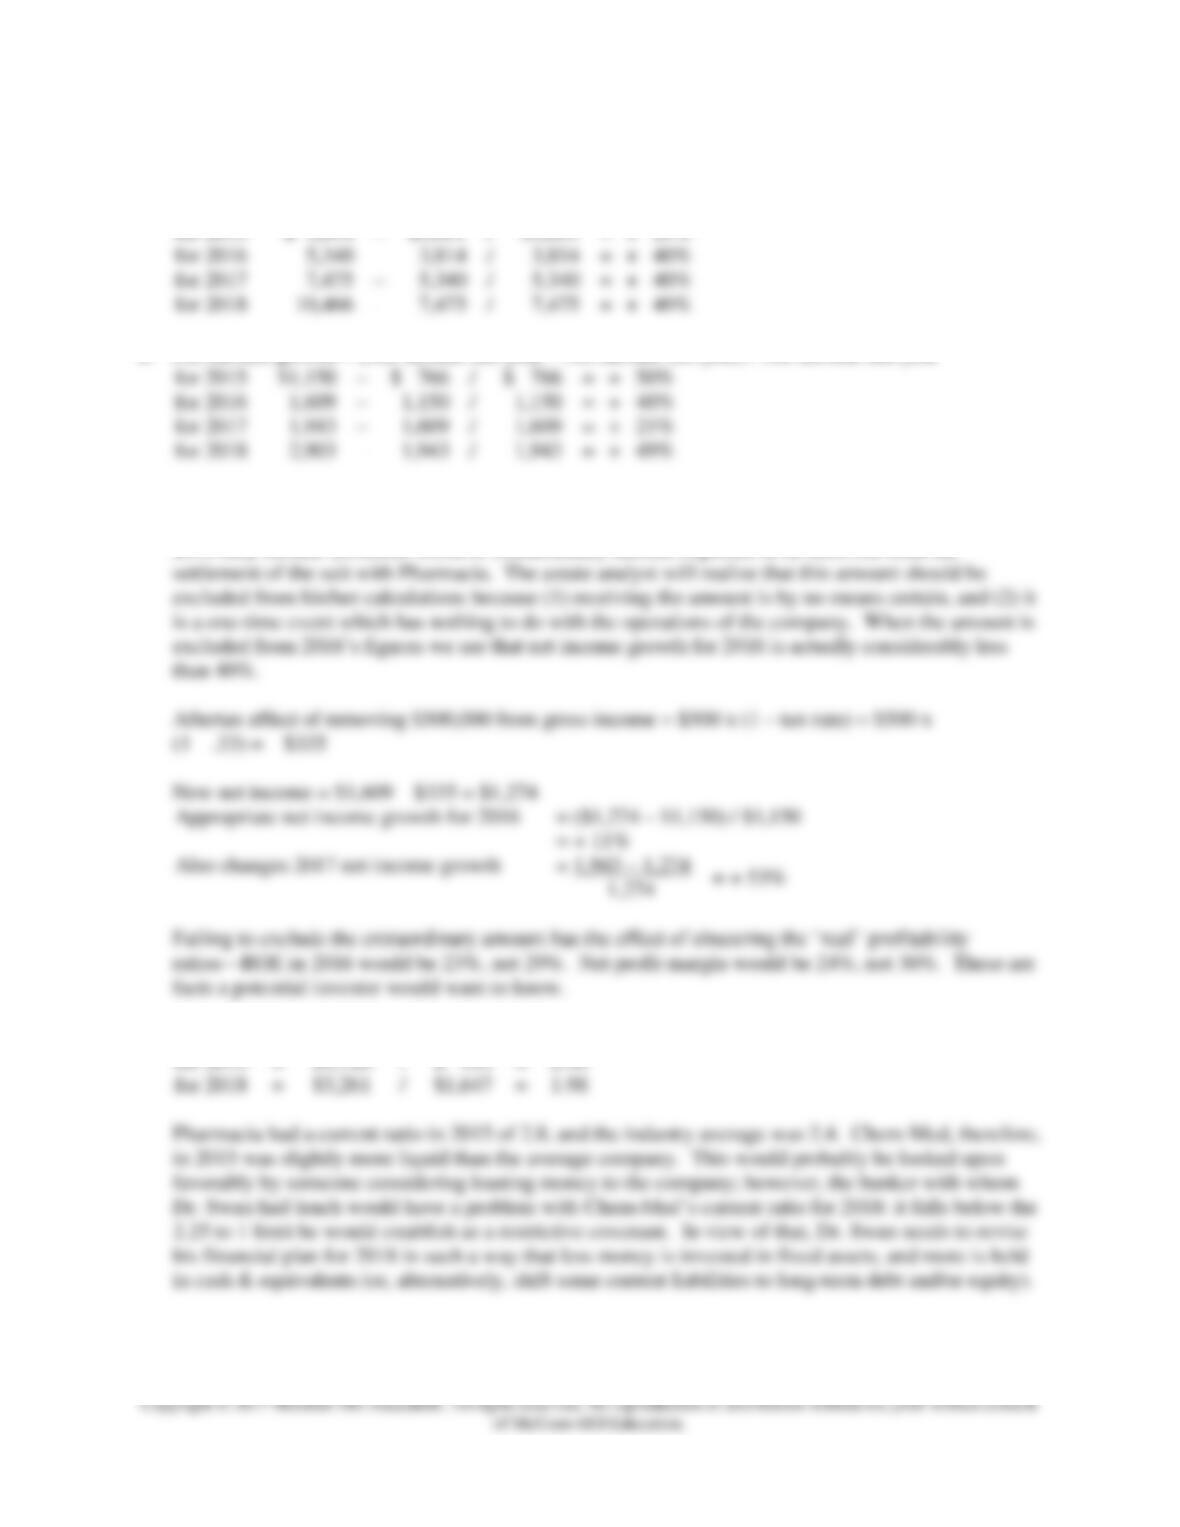
for 2016
5,340
–
3,814
/
3,814
=
+
40%
for 2017
7,475
–
5,340
/
5,340
=
+
40%
for 2018
10,466
–
7,475
/
7,475
=
+
40%
2. Net income growth = (Net income this year – Net income last year) / Net Income last year
for 2015
$1,150
–
$ 766
/
$ 766
=
+
50%
for 2016
1,609
–
1,150
/
1,150
=
+
40%
for 2017
1,943
–
1,609
/
1,609
=
+
21%
for 2018
2,903
–
1,943
/
1,943
=
+
49%
According to Dr. Swan’s estimates net income growth will exceed sales growth in 2015, match sales
growth in 2016, then slack off and rebound in 2018. However, Dr. Swan’s figures are misleading: in
2016 they include $500,000 worth of extraordinary income expected to be received from the
Appropriate net income growth for 2016
= ($1,274 – $1,150) / $1,150
= + 11%
Also changes 2017 net income growth
3. Chem-Med’s current ratio = Current Assets / Current Liabilities:
for 2015
=
$1,720
/
$ 593
=
2.90
for 2018
=
$3,261
/
$1,647
=
1.98
Pharmacia had a current ratio in 2015 of 2.8, and the industry average was 2.4. Chem-Med, therefore,
in 2015 was slightly more liquid than the average company. This would probably be looked upon
favorably by someone considering loaning money to the company; however, the banker with whom
Dr. Swan had lunch would have a problem with Chem-Med’s current ratio for 2018: it falls below the
2.25 to 1 limit he would establish as a restrictive covenant. In view of that, Dr. Swan needs to revise
his financial plan for 2018 in such a way that less money is invested in fixed assets, and more is held
in cash & equivalents (or, alternatively, shift some current liabilities to long-term debt and/or equity).
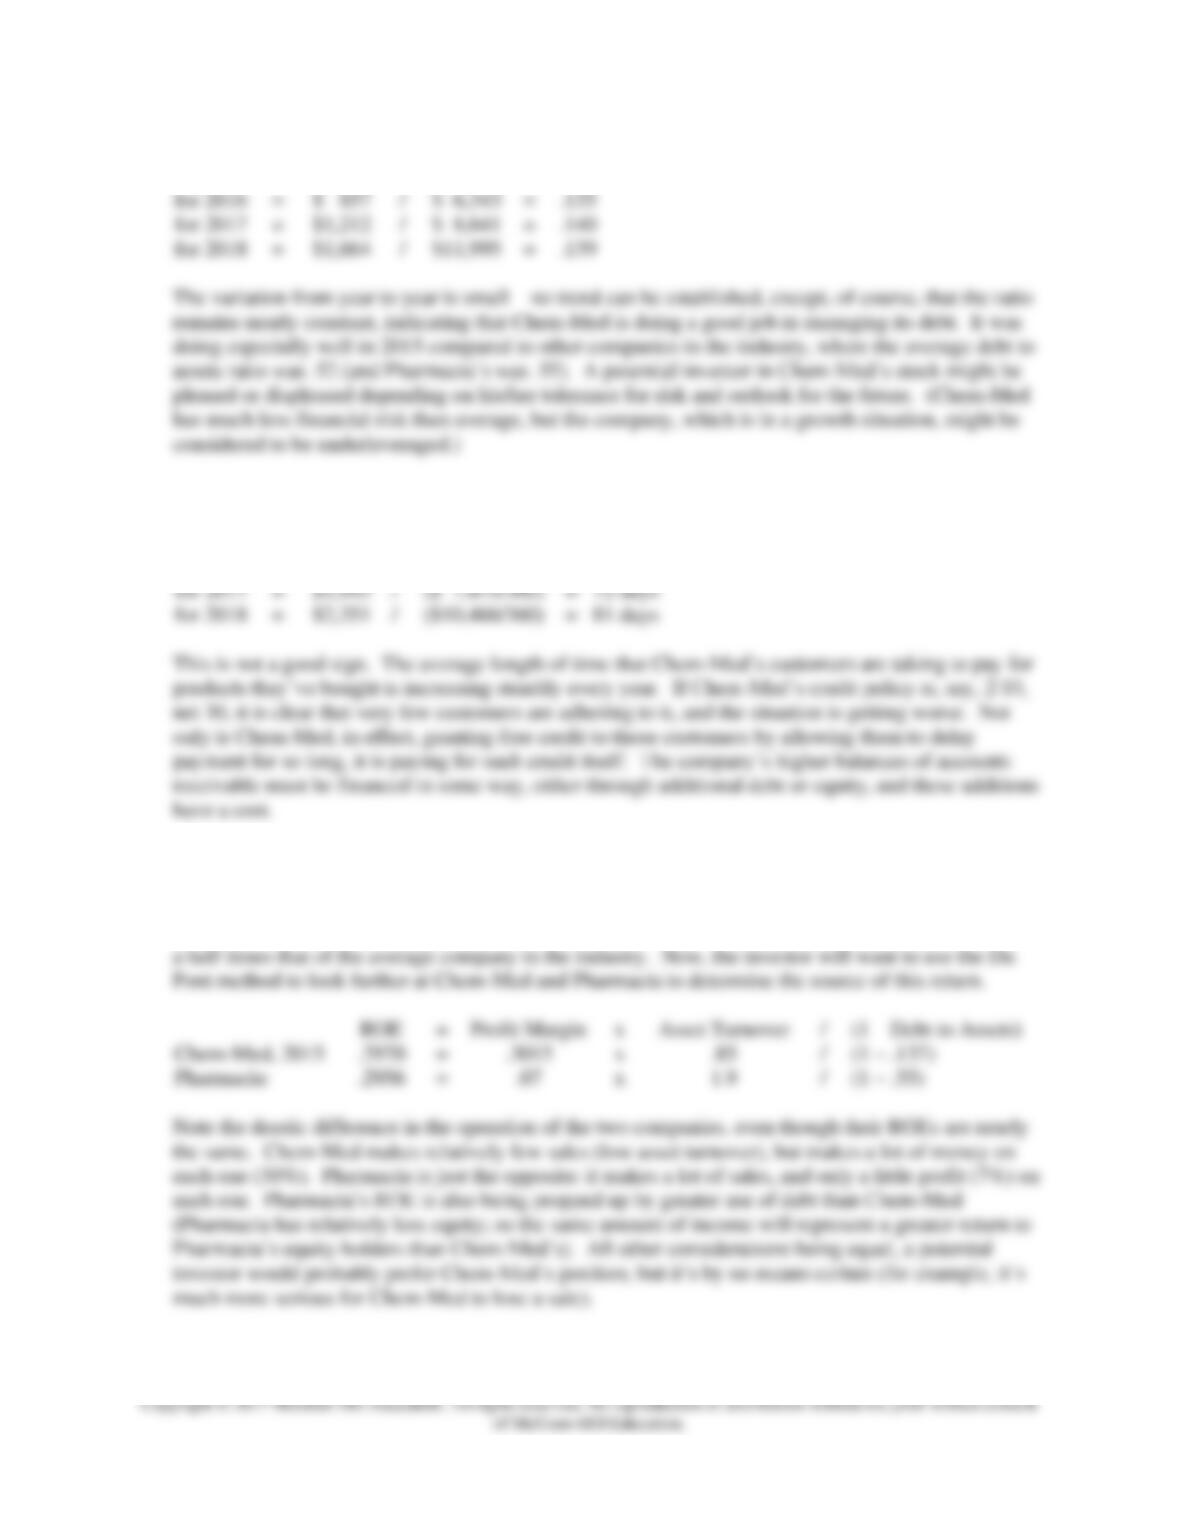
4. Chem-Med’s total debt to assets ratio = total liabilities / total assets
for 2015
=
$ 614
/
$ 4,491
=
.137
for 2016
=
$ 857
/
$ 6,343
=
.135
for 2017
=
$1,212
/
$ 8,641
=
.140
for 2018
=
$1,664
/
$11,995
=
.139
5. Chem-Med’s average accounts receivable collection period = accounts receivable / sales per day
for 2015
=
$ 564
/
($ 3,814/360)
=
53 days
for 2016
=
$ 907
/
($ 5,340/360)
=
61 days
for 2017
=
$1,495
/
($ 7,475/360)
=
72 days
for 2018
=
$2,351
/
($10,466/360)
=
81 days
6. Chem-Med’s return on equity ratio = net income / total equity for 2015 = $1,150 / $3,877 = 29.7%
Pharmacia’s ROE in 2015 was 29.7%, and the industry average was only 12.3%. A potential investor
in Chem-Med would be very pleased; Chem-Med is offering a handsome return that’s almost two and
ROE
=
Profit Margin
x
Asset Turnover
/
(1 – Debt to Assets)
Chem-Med, 2015
.2970
=
.3015
x
.85
/
(1 – .137)
Pharmacia:
.2956
=
.07
x
1.9
/
(1 – .55)