Problem 5-4 Problem 5-11
Spreadsheet Templates
Copyright © 2011 McGraw-Hill/Irwin and ANSRSource. (www.ansrsourceindia.com)
Spreadsheet Templates by Block, Hirt and Danielsen
Operating and Financial Leverage
Foundations of Financial Management
MAIN MENU – CHAPTER 5
Problem 5-4
Objective: Break-even analysis
Student Name:
Course Name:
Student ID:
Course Number:
Draw two break-even graphs–one for a conservative firm using labor-intensive production and another for a
capital-intensive firm. Assuming these companies compete within the same industry and have identical sales,
explain the impact of changes in sales volume on both firms’ profits.
Based on the following assumtions draw two break-even graphs.
Labor Capital
Intensive Intensive
Selling price $12.00 $12.00
Variable cost per unit $8.00 $5.00
Fixed costs $200,000 $300,000
Foundations of Financial Management
Block, Hirt and Danielsen
Solution
Problem 5-4
Instructions
Select the appropriate range required to draw the graph.
Complete the tables below for both the Labor-Intensive and capital-intensive firms.
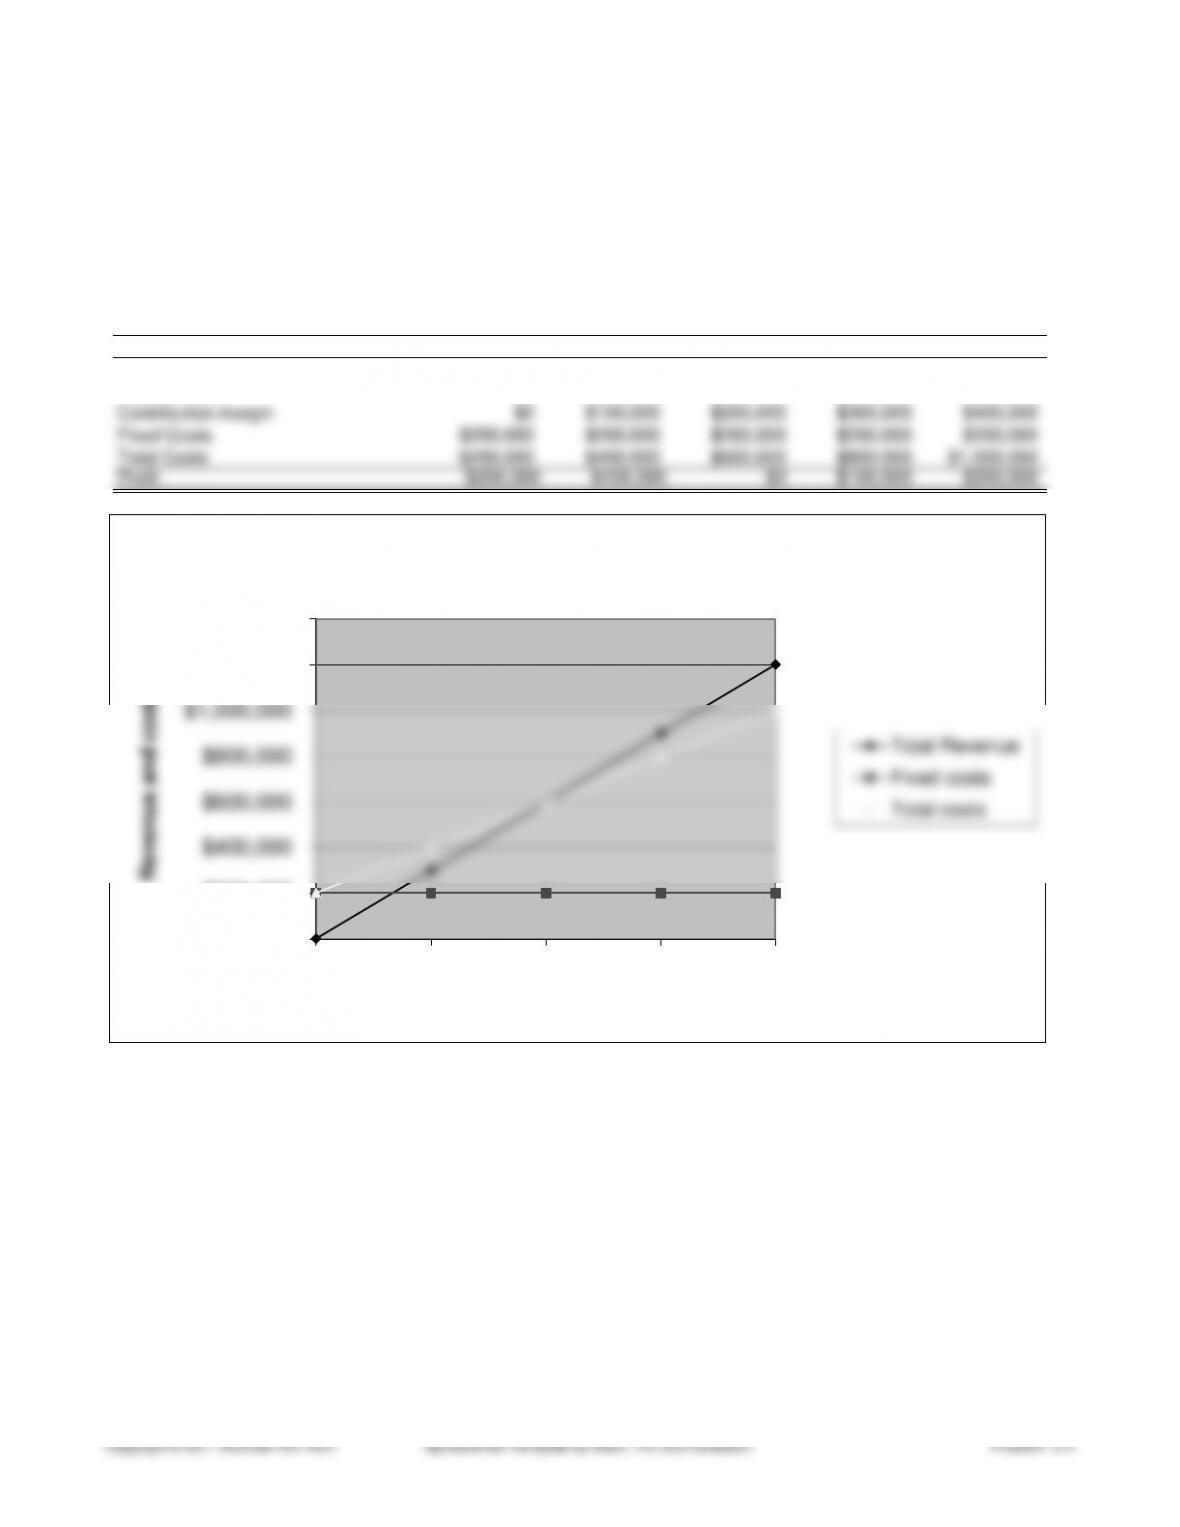
Labor-Intensive Company
Units 0 25,000 50,000 75,000 100,000
Total Revenue $0 $300,000 $600,000 $900,000 $1,200,000
Variable costs $0 $200,000 $400,000 $600,000 $800,000
Contribution margin $0 $100,000 $200,000 $300,000 $400,000
Fixed Costs $200,000 $200,000 $200,000 $200,000 $200,000
Total Costs $200,000 $400,000 $600,000 $800,000 $1,000,000
Profit $200,000 $100,000 $0 $100,000 $200,000
Labor-Intensive Company
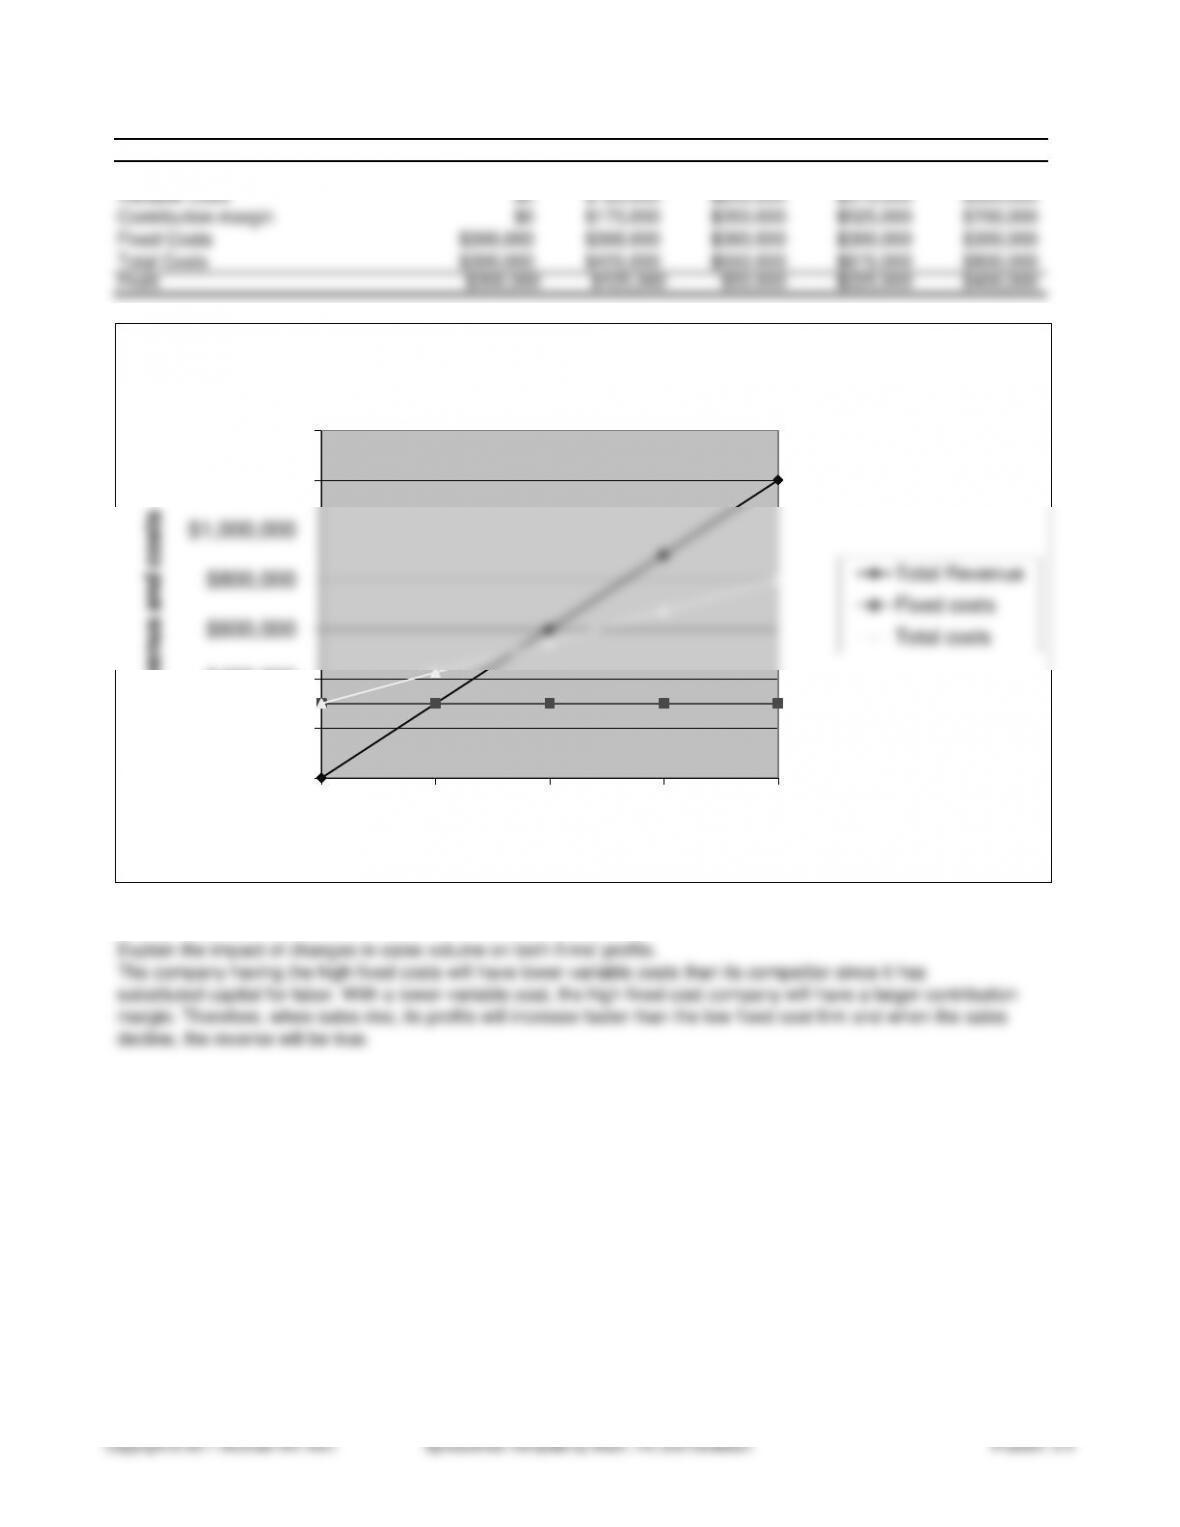
Units 0 25,000 50,000 75,000 100,000
Total Revenue $0 $300,000 $600,000 $900,000 $1,200,000
Variable costs $0 $125,000 $250,000 $375,000 $500,000
Contribution margin $0 $175,000 $350,000 $525,000 $700,000
Fixed Costs $300,000 $300,000 $300,000 $300,000 $300,000
Total Costs $300,000 $425,000 $550,000 $675,000 $800,000
Profit $300,000 $125,000 $50,000 $225,000 $400,000
$600,000
$800,000
$1,000,000
$1,200,000
$1,400,000
Capital-Intensive Company
Total Revenue
Fixed costs
Total costs
Problem 5-11
Objective: Degree of leverage
Student Name:
Course Name:
Student ID:
Course Number:
The Harding Company manufactures skates. The company’s income statement for 2010 is as follows:
Sales (10,000 skates @ $50 each) $500,000
Less: Variable costs (10,000 skates at $20) 200,000
Fixed costs 150,000
Earnings before interest and taxes (EBIT) 150,000
Interest expense 60,000
Earnings before taxes (EBT) 90,000
Income tax expense (40%) 36,000
Earnings after taxes (EAT) $54,000
Given this income statement, compute the following:
a. Degree of operating leverage.
b. Degree of financial leverage.
c. Degree of combined leverage.
d. Break-even point in units (number of skates).
HARDING COMPANY
Income Statement
For the Year Ended December 31, 2010
Foundations of Financial Management
Block, Hirt and Danielsen
Solution
Problem 5-11
Instructions
Using the Income Statement (above) and the information (below), compute the degree of operating leverage,
degree of financial leverage, degree of combined leverage, and the break-even point in units.
Information:
Unit sales 10,000
Selling price $50
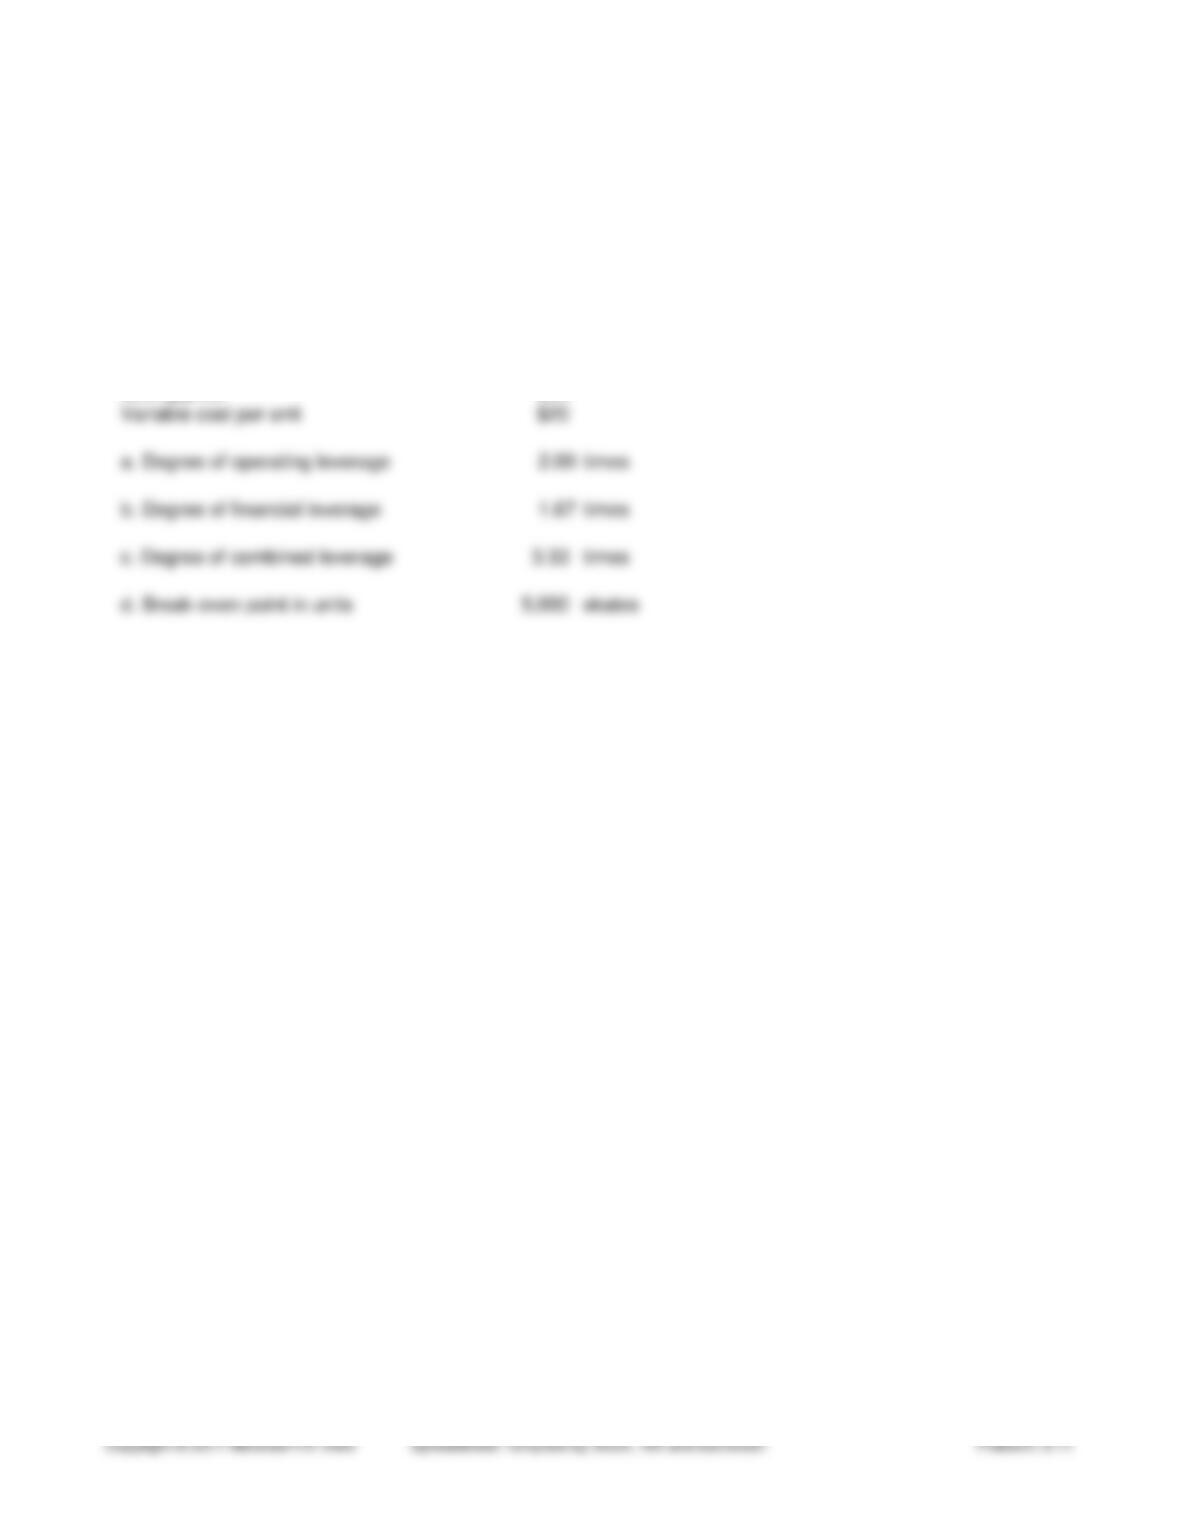
Variable cost per unit $20
a. Degree of operating leverage 2.00 times
b. Degree of financial leverage 1.67 times
c. Degree of combined leverage 3.33 times
d. Break-even point in units 5,000 skates