
Problem 3-22 Problem 3-23 Problem 3-24
Problem 3-36 Problem 3-37
Financial Analysis
Spreadsheet Templates by Block, Hirt and Danielsen
Copyright © 2011 McGraw-Hill/Irwin and ANSR Source India Pvt Ltd. (www.ansrsourceindia.com)
Spreadsheet Templates
Foundations of Financial Management
MAIN MENU – CHAPTER 3
Problem 3-22
Objective: Overall ratio analysis
Student Name:
Course Name:
Student ID:
Course Number:
The balance sheet for Bryan Corporation is shown below. Sales for the year were $3,040,000, with 75 percent of
sales sold on credit.
Cash $50,000 Accounts payable $220,000
Accounts receivable 280,000 Accrued taxes 80,000
Inventory 240,000 Bonds payable (long term) 118,000
Plant and equipment 380,000 Common stock 100,000
Paid-in-capital 150,000
Retained earnings 282,000
Total assets $950,000 Total liabilities and equity $950,000
Compute the following ratios:
a. Current ratio.
b. Quick ratio.
c. Debt-to-total-assets ratio.
d. Asset turnover.
e. Average collection period.
Liabilities and Equity
Assets
Balance Sheet 201X
BRYAN CORPORATION
Foundations of Financial Management
Block, Hirt and Danielsen
Solution
Problem 3-22
Instructions
Enter formulas to calculate the following ratios. If possible, use cell references to the balance sheet.
Use a 360 day year.
a. Current ratio 1.9 times
b. Quick ratio 1.1 times
c. Debt-to-total-assets ratio 44.00%
d. Asset turnover 3.20 times
e. Average collection period 44.21 days
Problem 3-23
Objective: Debt-utilization ratios
Student Name:
Course Name:
Student ID:
Course Number:
The Lancaster Corporation’s income statement is given below.
a. What is the times interest earned ratio?
b. What would be the fixed charge coverage ratio?
Sales $200,000
Cost of goods sold 116,000
Gross profit 84,000
Fixed charges (other than interest) 24,000
Income before interest and taxes 60,000
Interest 12,000
Income before taxes 48,000
Taxes (35%) 16,800
Income after taxes $31,200
LANCASTER CORPORATION
Foundations of Financial Management
Block, Hirt and Danielsen
Solution
Problem 3-23
Instructions
Enter formulas to calculate the following ratios. If possible, use cell references to the income statement.
a. Times interest earned 5 times
b. Fixed charge coverage 2.33 times
Problem 3-24
Objective: Debt utilization and Du Pont system of analysis
Student Name:
Course Name:
Student ID:
Course Number:
Using the income statement for J. Lo Wedding Gowns below, compute the following ratios:
a. The interest coverage.
b. The fixed charge coverage.
The total assets for this company equal $160,000. Set up the equation for the Du Pont system of ratio analysis,
and compute the answer to part c below using ratio 2 b. on page 59 in the text.
c. Return on assets (investment).
Sales $200,000
Less: Cost of goods sold 90,000
Gross profit $110,000
Less: Selling and administrative expense 40,000
Less: Lease expense 10,000
Operating profit* $60,000
Less: Interest expense 5,000
Earnings before taxes $55,000
Less: Taxes (40%) 22,000
Earnings after taxes $33,000
*Equals income before interest and taxes.
J. LO WEDDING GOWNS
Foundations of Financial Management
Block, Hirt and Danielsen
Income Statement
Solution
Problem 3-24
Instructions
Enter formulas to calculate the following ratios. If possible, use cell references to the income statement.
a. Times interest earned 12 times
b. Fixed charge coverage 4.67 times
c. Return on assets :
Profit Margin
16.50%
x
Total assets turnover
1.25
20.63%
Problem 3-36
Objective: Comparing all the ratios
Student Name:
Course Name:
Student ID:
Course Number:
Using the financial statements for the Snider Corporation, calculate the 13 basic ratios
found in the chapter.
Current assets:
Cash $50,000
Marketable securities 20,000
Accounts receivable (net) 160,000
Inventory 200,000
Total current assets $430,000
Investments 60,000
Plant and equipment 600,000
Less: Accumulated depreciation (190,000)
Net plant and equipment 410,000
Total assets $900,000
Current liabilities:
Accounts payable $90,000
Notes payable 70,000
Accrued taxes 10,000
Total current liabilities 170,000
Long-term liabilities:
Bonds payable 150,000
Total liabilities $320,000
Assets
Liabilities and Stockholders’ Equity
December 31, 2010
Foundations of Financial Management
Block, Hirt and Danielsen
SNIDER CORPORATION
Balance Sheet
Stockholders’ equity:
Preferred stock, $50 par value 100,000
Common stock, $1 par value 80,000
Capital paid in excess of par 190,000
Retained earnings 210,000
Total stockholders’ equity 580,000
Total liabilities and stockholders’ equity $900,000
SNIDER CORPORATION
Income Statement
For the Year Ending December 31, 2010
Sales (on credit) $1,980,000
Less: Cost of goods sold 1,280,000
Gross profit 700,000
Less: Selling and administrative expenses 475,000 *
Operating profit (EBIT) 225,000
Less: Interest expense 25,000
Earnings before taxes (EBT) 200,000
Less: Taxes 80,000
Earnings after taxes (EAT) $120,000
*Includes $35,000 in lease payments.
Solution
Problem 3-36
Instructions
Enter formulas to calculate the following ratios.
Use a 360 day year.
Profitability ratios
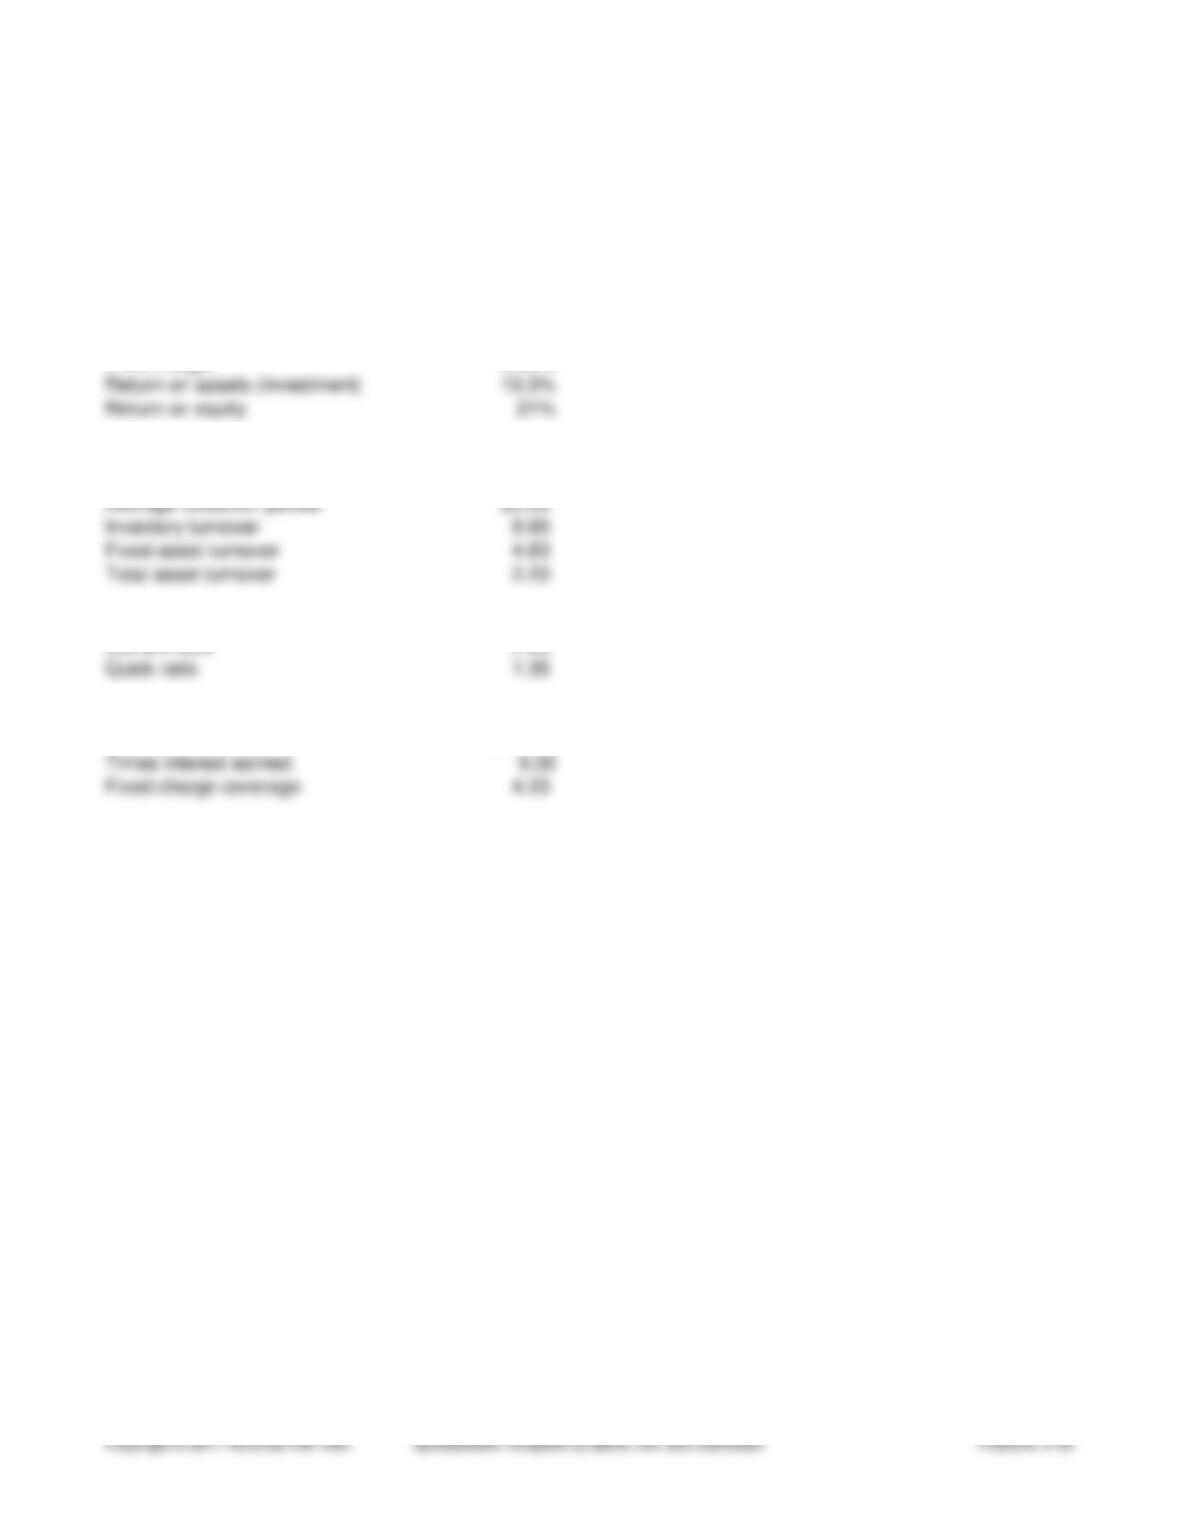
Profit margin 6.06%
Return on assets (investment) 13.3%
Return on equity 21%
Assets utilization ratios
Receivable turnover 12.38
Average collection period 29.09
Inventory turnover 9.90
Fixed asset turnover 4.83
Total asset turnover 2.20
Liquidity ratios
Current ratio 2.53
Quick ratio 1.35
Debt utilization ratios
Debt to total assets 35.56%
Times interest earned 9.00
Fixed charge coverage 4.33
Copyright © 2011 McGraw-Hill/ Irwin Spreadsheet Template by Block, Hirt and Danielsen Problem: 3-36
Problem 3-37
Objective: Ratio computation and analysis
Student Name:
Course Name:
Student ID:
Course Number:
Given the financial statements for Jones Corporation and Smith Corporation:
a. To which company would you, as credit manager for a supplier, approve the extension of (short-term) trade
credit? Why? Compute all ratios before answering.
b. In which one would you buy stock? Why?
JONES CORPORATION
Current Assets Liabilities
Cash $20,000 Accounts payable $100,000
Accounts receivable 80,000 Bonds payable (long-term) 80,000
Inventory 50,000
Long-Term Assets Stockholders’ Equity
Fixed Assets $500,000 Common stock $150,000
Less: Accumulated Depreciation (150,000) Paid-in capital 70,000
Net fixed assets* 350,000 Retained earnings 100,000
Total assets $500,000 Total liabilities and equity $500,000
Sales (on credit) $1,250,000
Cost of goods sold 750,000
Gross profit 500,000
Selling and Administrative expense†257,000
Less: Depreciation expense 50,000
Operating Profit 193,000
Interest expense 8,000
Earnings before taxes 185,000
Tax expense 92,500
Net Income $92,500
* Use net fixed assets in computing fixed asset turnover.
† Includes $7,000 in lease payments.
SMITH CORPORATION
Foundations of Financial Management
Block, Hirt and Danielsen
Current Assets Liabilities
Cash $35,000 Accounts payable $75,000
Marketable securities 7,500 Bonds payable (long-term) 210,000
Accounts receivable 70,000
Inventory 75,000
Long-Term Assets Stockholders’ Equity
Fixed Assets $500,000 Common stock $75,000
Less: Accumulated Depreciation (250,000) Paid-in capital 30,000
Net fixed assets* 250,000 Retained earnings 47,500
Total assets $437,500 Total liabilities and equity $437,500
Sales (on credit) $1,000,000
Cost of goods sold 600,000
Gross profit 400,000
Selling and Administrative expense†224,000
Less: Depreciation expense 50,000
Operating Profit 126,000
Interest expense 21,000
Earnings before taxes 105,000
Tax expense 52,500
Net Income $52,500
* Use net fixed assets in computing fixed asset turnover.
† Includes $7,000 in lease payments.
Solution
Problem 3-37
Instructions
Enter formulas to calculate the following ratios. If possible, use cell references to the financial statements.
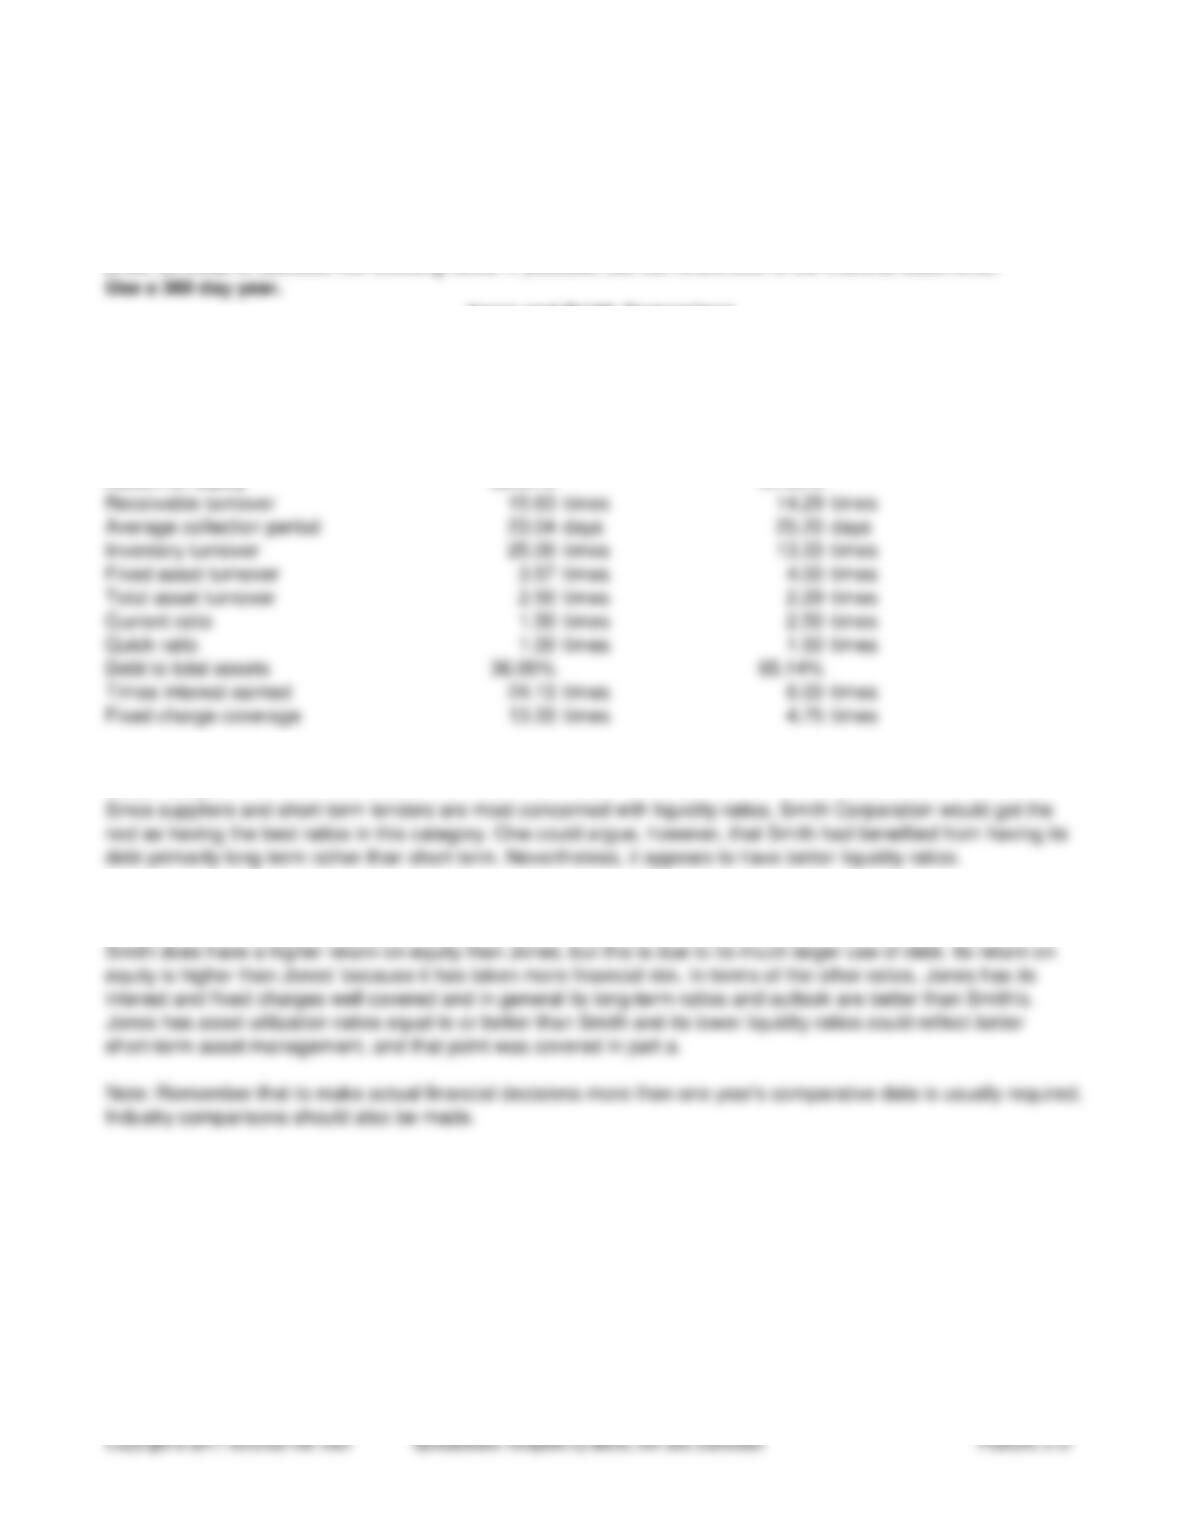
Use a 360 day year.
One way of analyzing the situation for each company is to compare the respective ratios for each, On examining
those ratios which would be most important to a supplier or short-term lender and a stockholder.
Jones Corp. Smith Corp.
Profit margin 7.40% 5.25%
Return on assets 18.50% 12.00%
Return on equity 28.91% 34.43%
Receivable turnover 15.63 times 14.29 times
Average collection period 23.04 days 25.20 days
Inventory turnover 25.00 times 13.33 times
Fixed asset turnover 3.57 times 4.00 times
Total asset turnover 2.50 times 2.29 times
Current ratio 1.50 times 2.50 times
Quick ratio 1.00 times 1.50 times
Debt to total assets 36.00% 65.14%
Times interest earned 24.13 times 6.00 times
Fixed charge coverage 13.33 times 4.75 times
a. To which company would you, as credit manager for a supplier, approve the extension of (short-term) trade
credit? Why?
Since suppliers and short-term lenders are most concerned with liquidity ratios, Smith Corporation would get the
nod as having the best ratios in this category. One could argue, however, that Smith had benefited from having its
debt primarily long term rather than short term. Nevertheless, it appears to have better liquidity ratios.
b. In which one would you buy stock? Why?
Industry comparisons should also be made.
Jones and Smith Comparison