19. We are given the profit margin. Remember that:
ROA = PM(TAT)
We can calculate the ROA from the internal growth rate formula, and then use the ROA in this
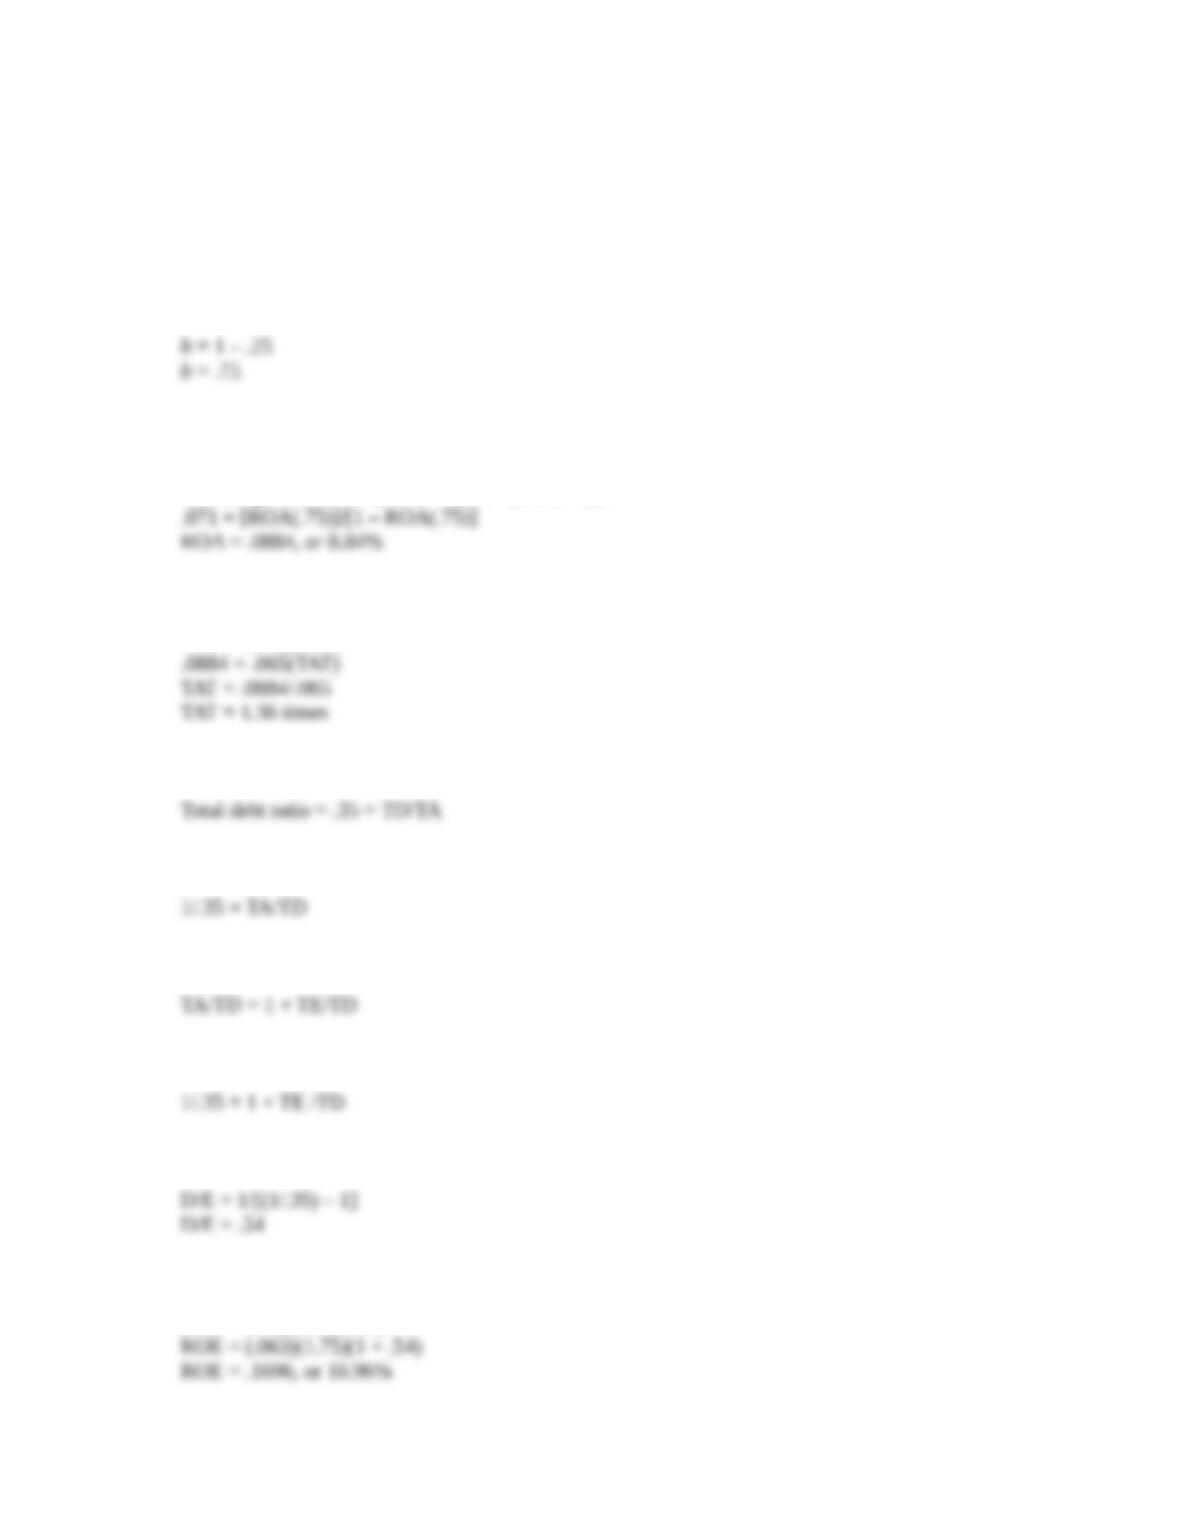
equation to find the total asset turnover. The retention ratio is:
Using the internal growth rate equation to find the ROA, we get:
Internal growth rate = (ROA × b)/[1 – (ROA × b)]
Plugging ROA and PM into the equation we began with and solving for TAT, we get:
ROA = (PM)(TAT)
20. We should begin by calculating the D/E ratio. We calculate the D/E ratio as follows:
Inverting both sides we get:
Next, we need to recognize that:
Substituting this into the previous equation, we get:
Subtracting 1 (one) from both sides and inverting again, we get:
With the D/E ratio, we can calculate the EM and solve for ROE using the DuPont identity:
ROE = (PM)(TAT)(EM)
Now we can calculate the retention ratio as:
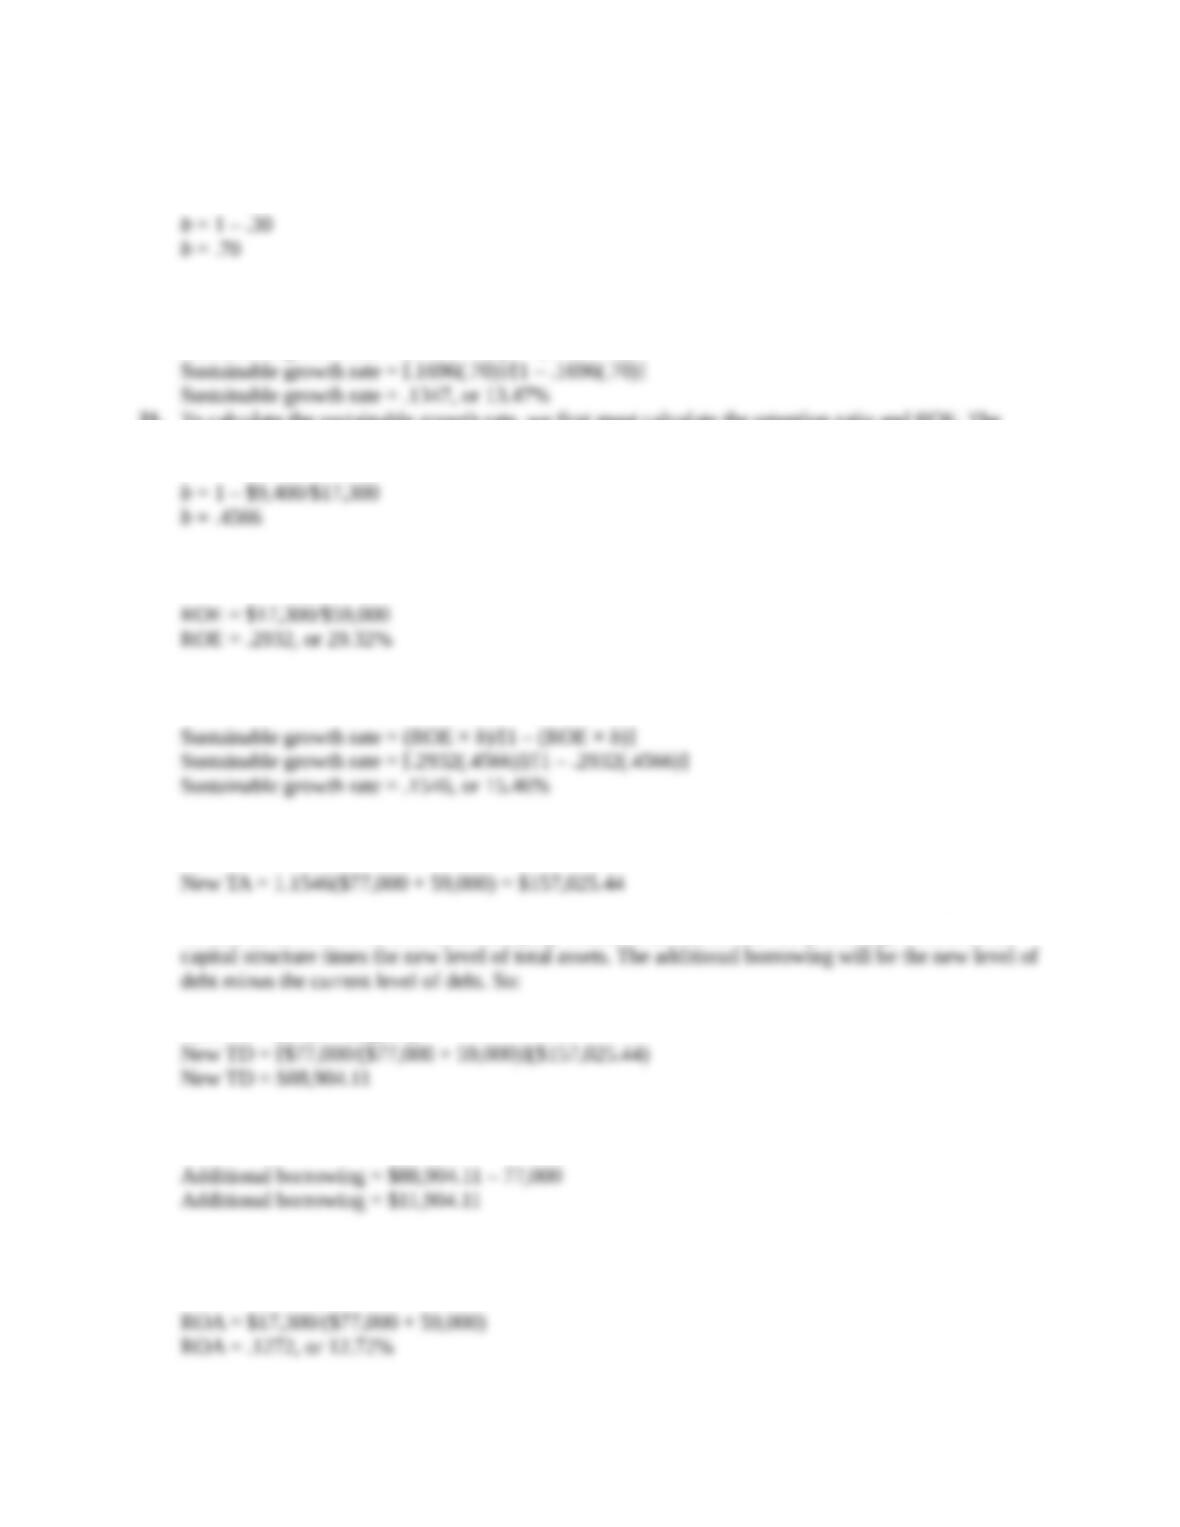
Finally, putting all the numbers we have calculated into the sustainable growth rate equation, we get:
Sustainable growth rate = (ROE × b)/[1 – (ROE × b)]
21. To calculate the sustainable growth rate, we first must calculate the retention ratio and ROE. The
retention ratio is:
And the ROE is:
So, the sustainable growth rate is:
If the company grows at the sustainable growth rate, the new level of total assets is:
To find the new level of debt in the company’s balance sheet, we take the percentage of debt in the
New TD = [D/(D + E)](TA)
And the additional borrowing will be:
The growth rate that can be supported with no outside financing is the internal growth rate. To
calculate the internal growth rate, we first need the ROA, which is:
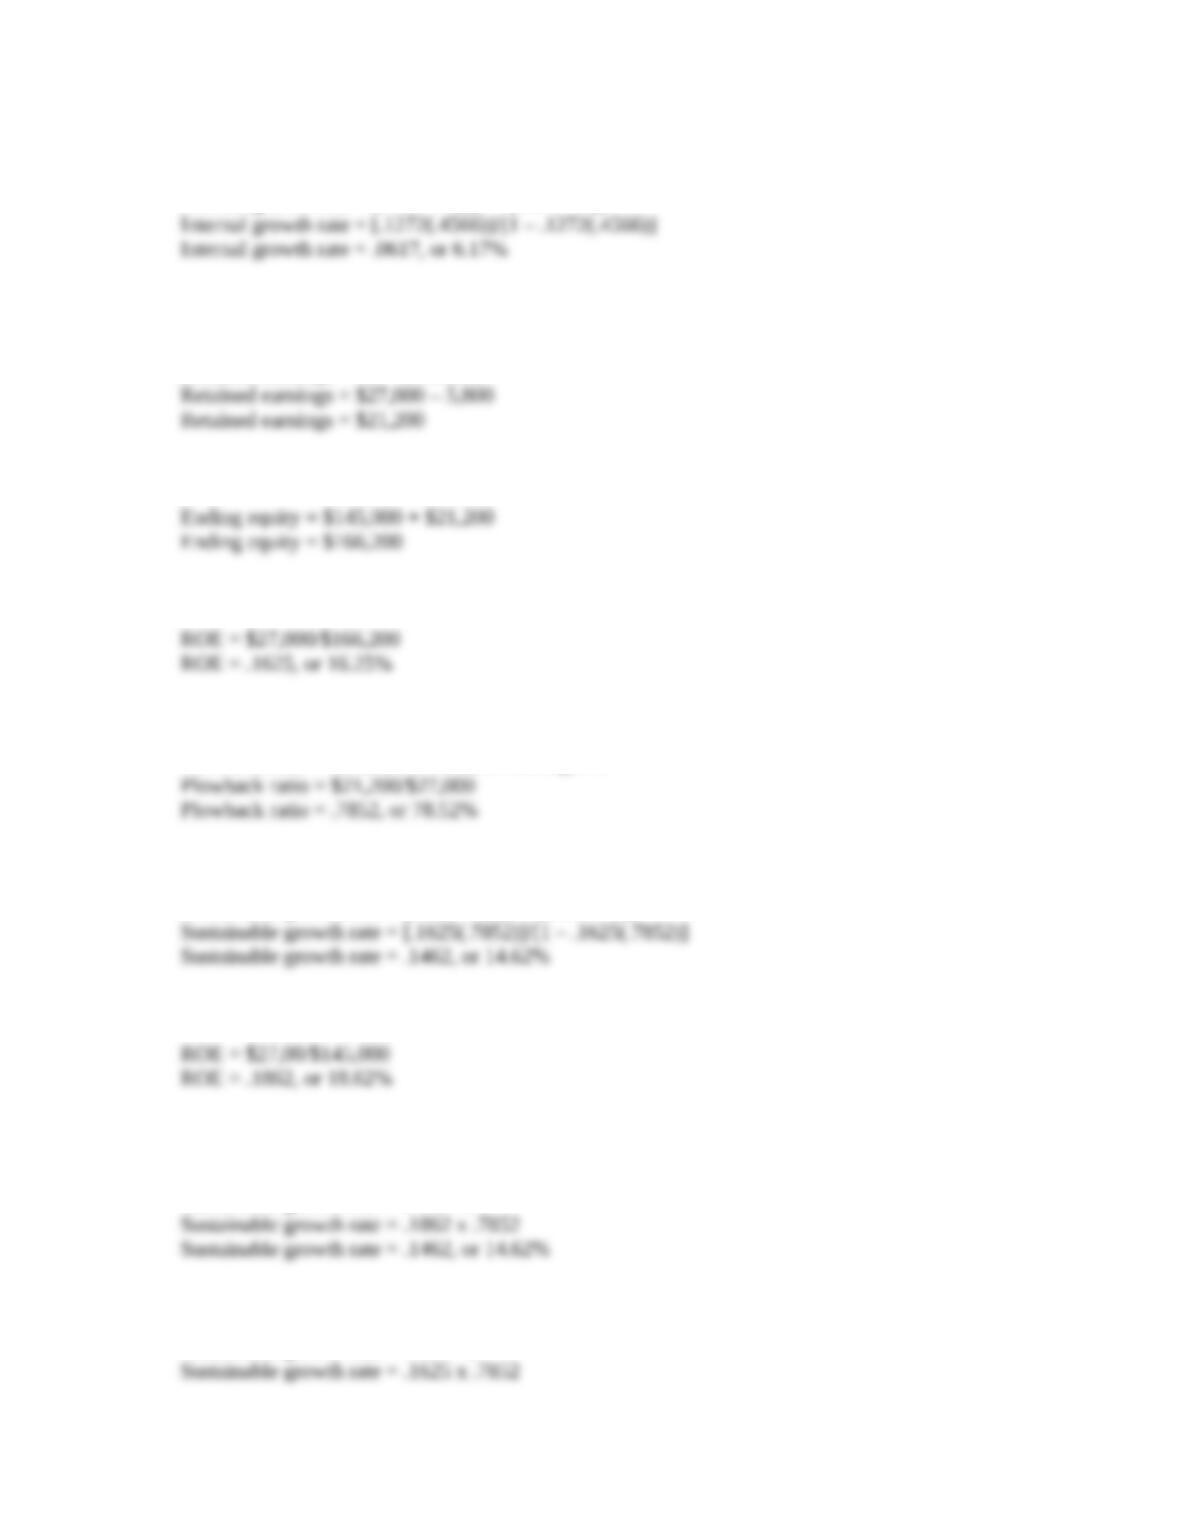
This means the internal growth rate is:
Internal growth rate = (ROA × b)/[1 – (ROA × b)]
22. Since the company issued no new equity, shareholders’ equity increased by retained earnings.
Retained earnings for the year were:
Retained earnings = NI – Dividends
So, the equity at the end of the year was:
The ROE based on the end of period equity is:
The plowback ratio is:
Plowback ratio = Addition to retained earnings/NI
Using the equation presented in the text for the sustainable growth rate, we get:
Sustainable growth rate = (ROE × b)/[1 – (ROE × b)]
The ROE based on the beginning of period equity is
Using the shortened equation for the sustainable growth rate and the beginning of period ROE, we
get:
Sustainable growth rate = ROE × b
Using the shortened equation for the sustainable growth rate and the end of period ROE, we get:
Sustainable growth rate = ROE × b
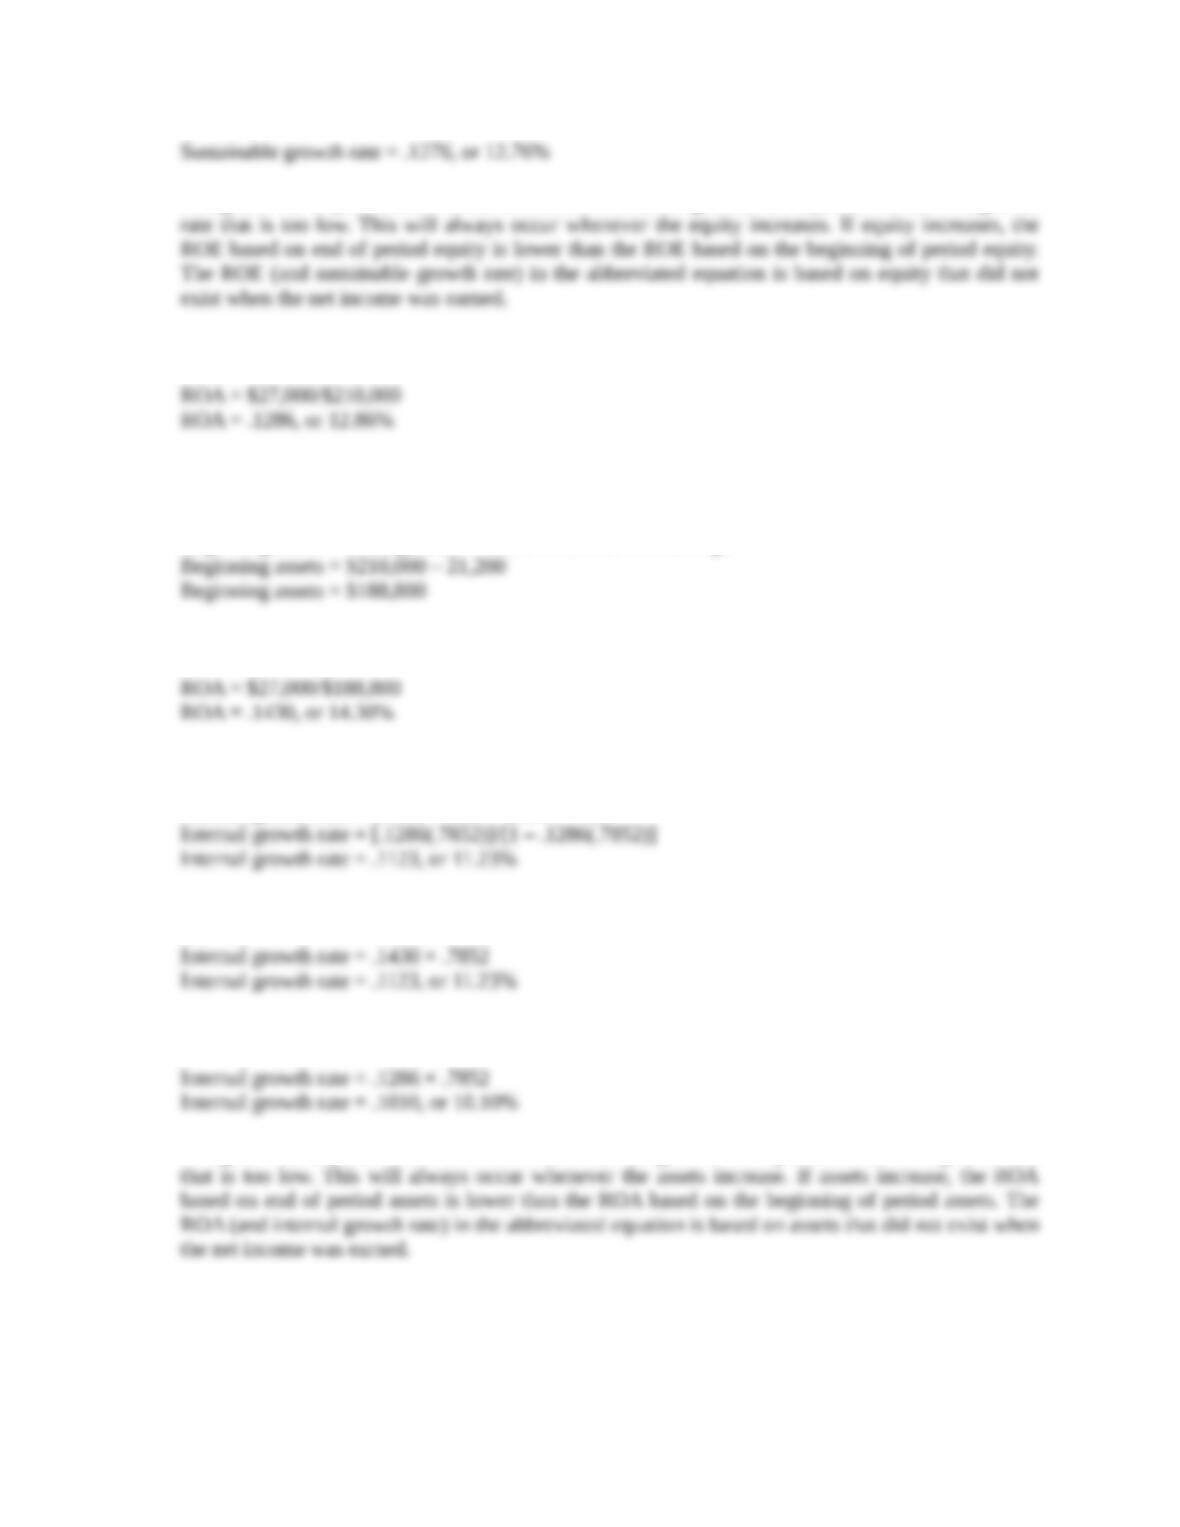
Using the end of period ROE in the shortened sustainable growth rate equation results in a growth
23. The ROA using end of period assets is:
The beginning of period assets had to have been the ending assets minus the addition to retained
earnings, so:
Beginning assets = Ending assets – Addition to retained earnings
And the ROA using beginning of period assets is:
Using the internal growth rate equation presented in the text, we get:
Internal growth rate = (ROA × b)/[1 – (ROA × b)]
Using the formula ROA × b, and beginning of period assets:
Using the formula ROA × b, and end of period assets:
Using the end of period ROA in the shortened internal growth rate equation results in a growth rate
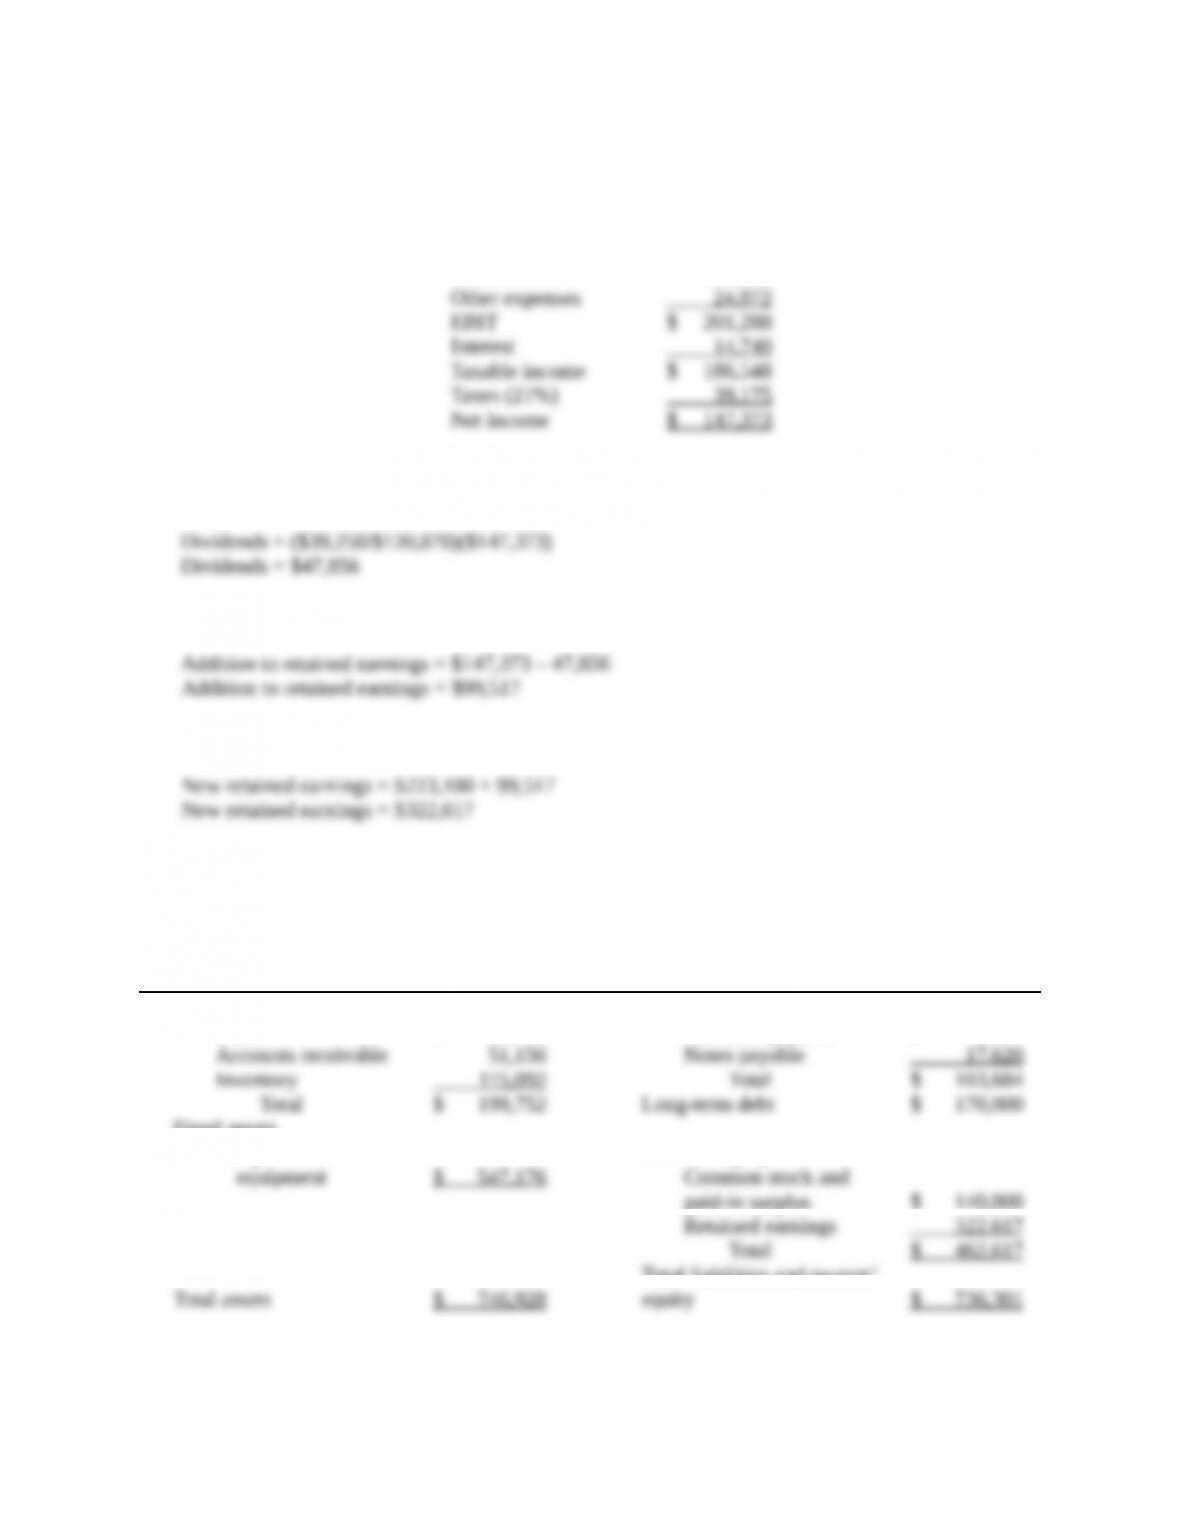
24. Assuming costs vary with sales and a 20 percent increase in sales, the pro forma income statement
will look like this:
Pro Forma Income Statement
Sales $ 1,176,912
Costs 951,552
The payout ratio is constant, so the dividends paid this year is the payout ratio from last year times
net income, or:
And the addition to retained earnings will be:
The new retained earnings on the pro forma balance sheet will be:
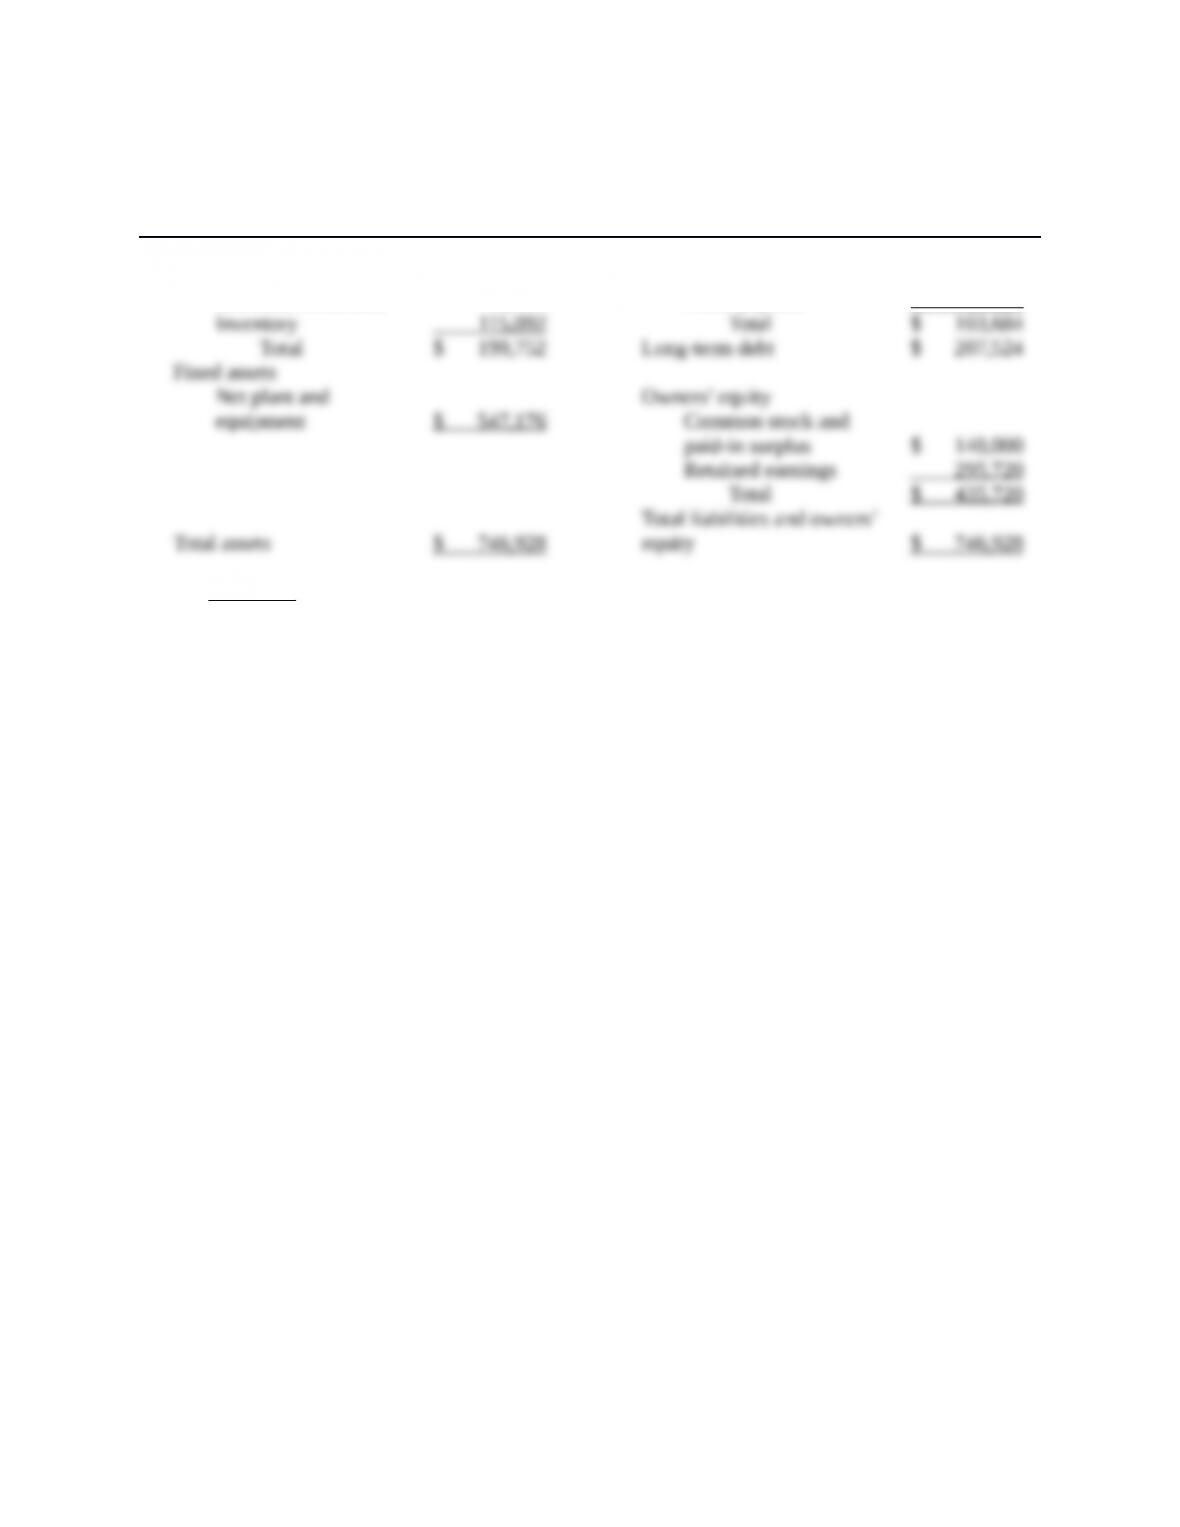
The pro forma balance sheet will look like this:
Pro Forma Balance Sheet
Assets Liabilities and Owners’ Equity
Current assets Current liabilities
Cash $ 33,504 Accounts payable $ 86,064
Fixed assets
Net plant and Owners’ equity
paid-in surplus $ 140,000
Total liabilities and owners’
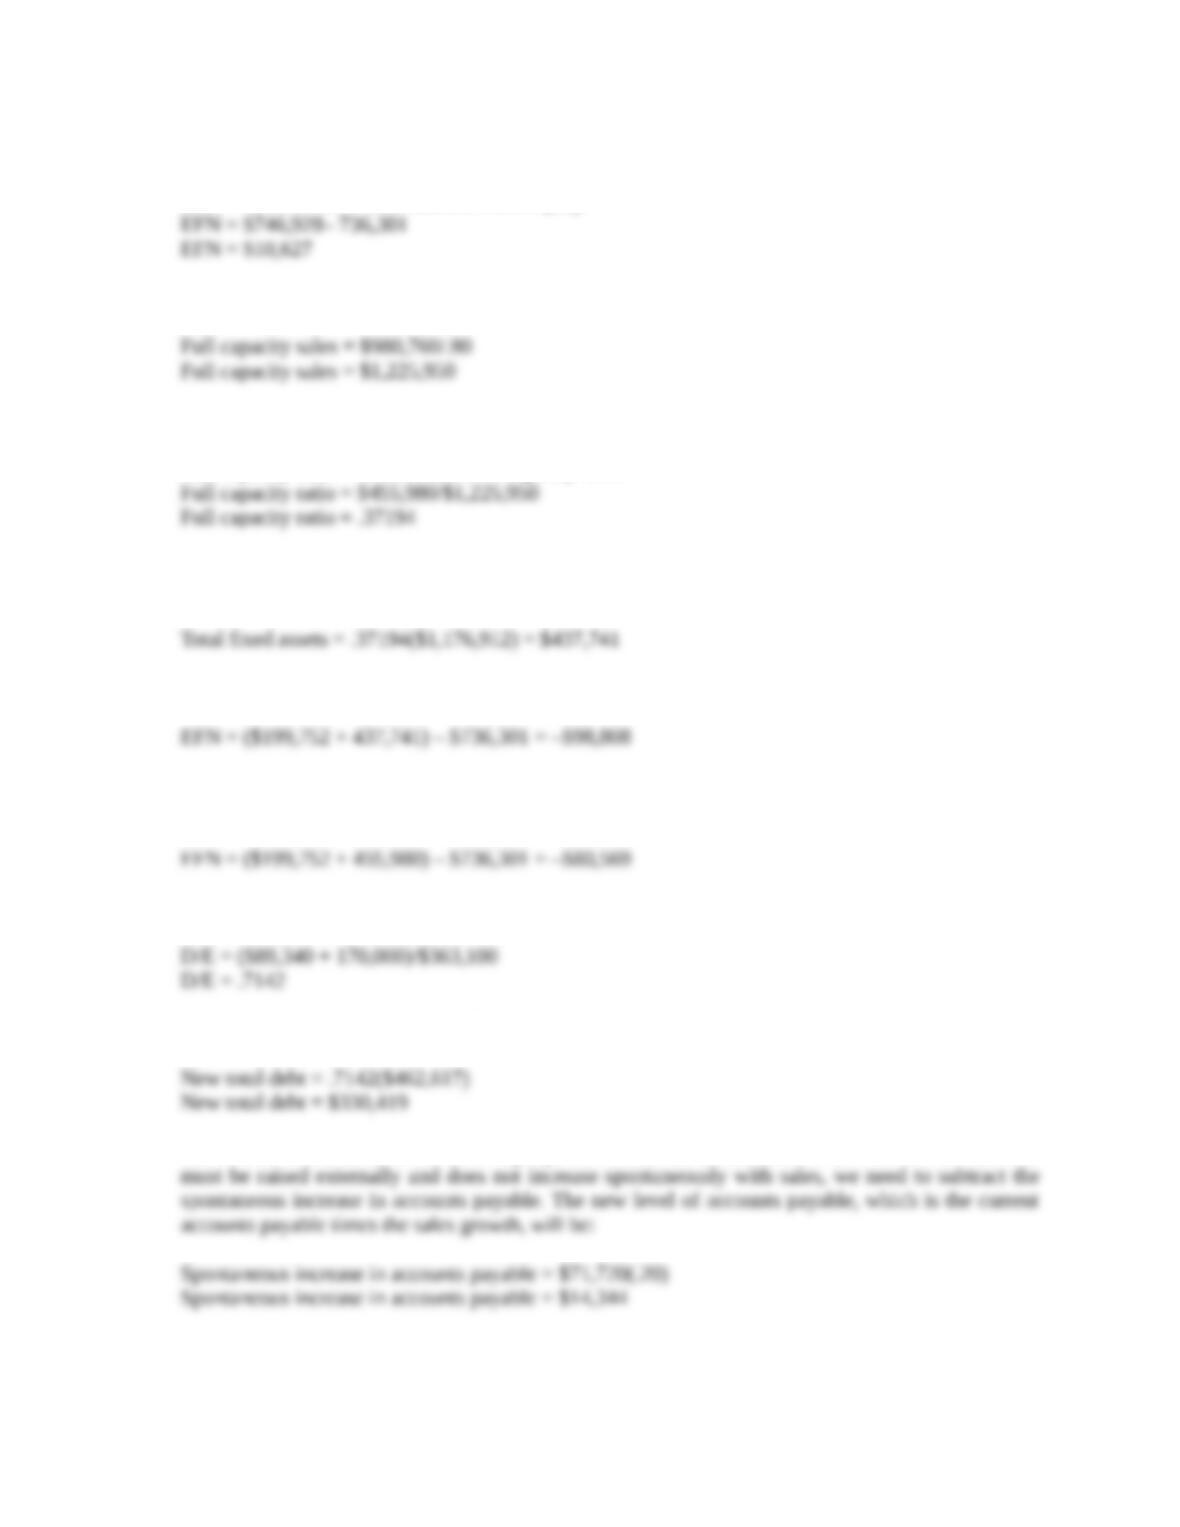
So the EFN is:
EFN = Total assets – Total liabilities and equity
25. First, we need to calculate full capacity sales, which is:
The full capacity ratio at full capacity sales is:
Full capacity ratio = Fixed assets/Full capacity sales
The fixed assets required at the projected sales figure is the full capacity ratio times the projected
sales level:
So, EFN is:
Note that this solution assumes that fixed assets are decreased (sold) so the company has a 100
percent fixed asset utilization. If we assume fixed assets are not sold, the answer becomes:
26. The D/E ratio of the company is:
So the new total debt amount will be:
This is the new total debt for the company. Given that our calculation for EFN is the amount that
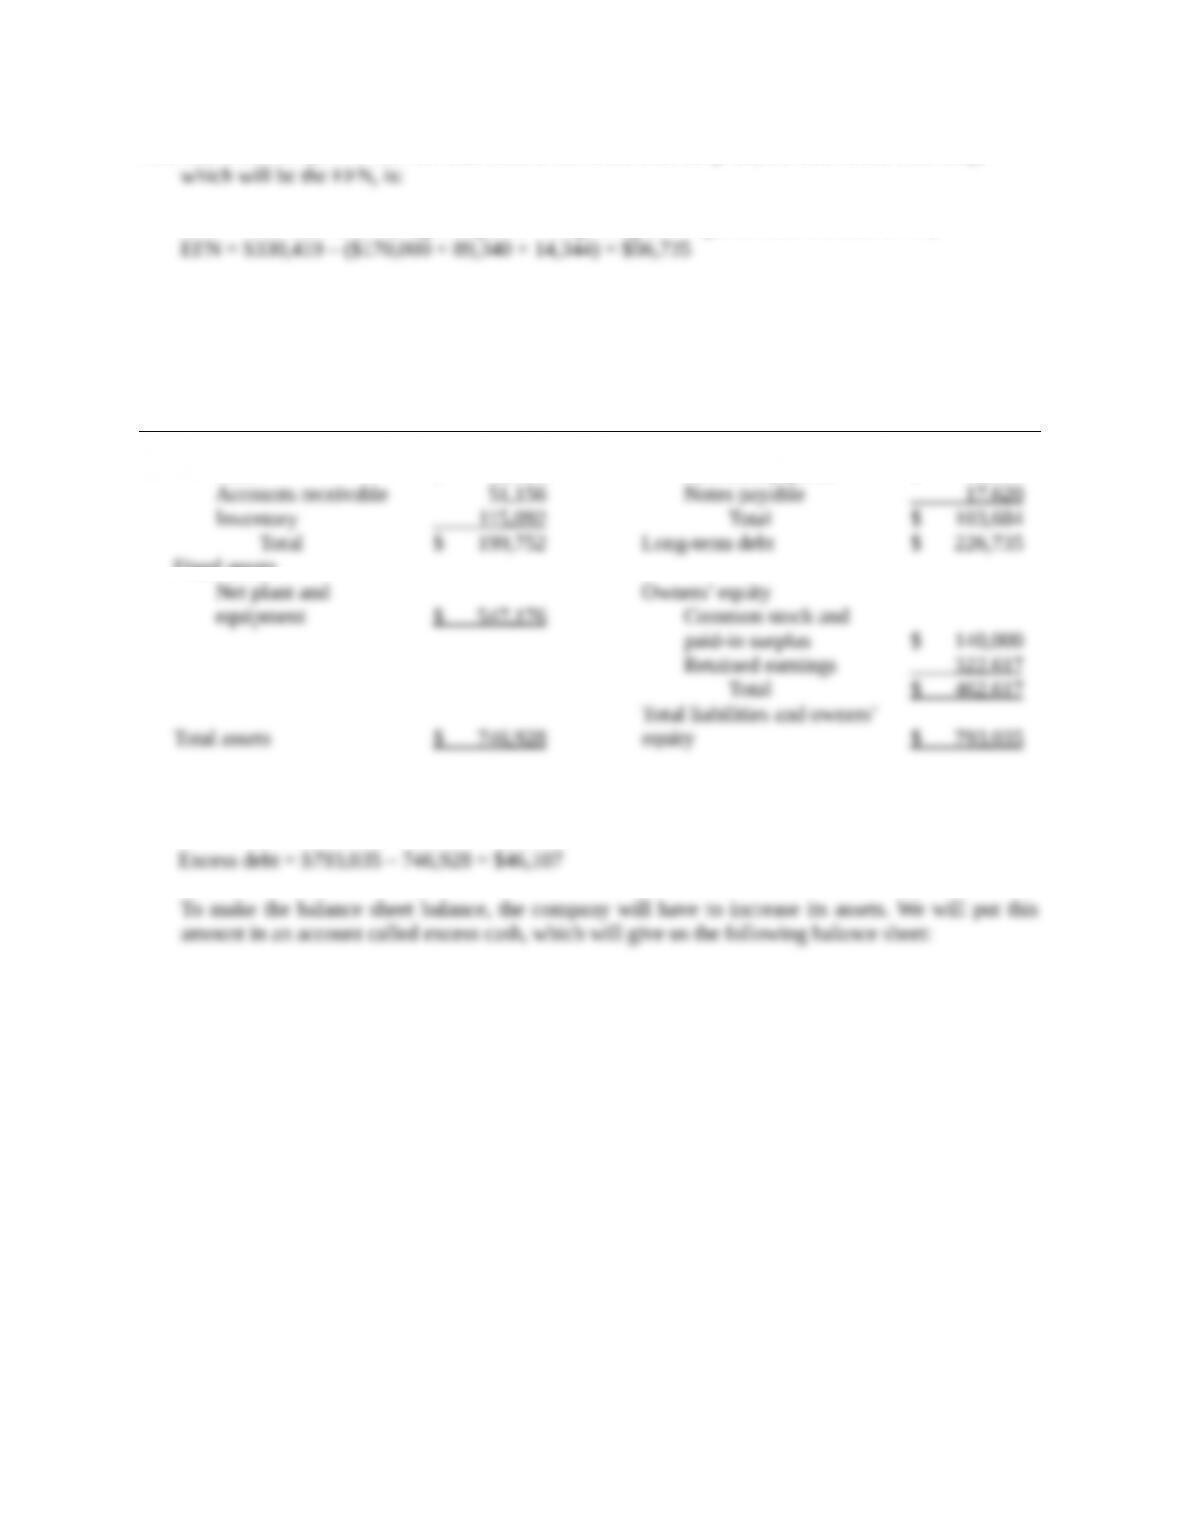
This means that $14,344 of the new total debt is not raised externally. So, the debt raised externally,
EFN = New total debt – (Beginning LTD + Beginning CL + Spontaneous increase in AP)
The pro forma balance sheet with the new long-term debt will be:
Pro Forma Balance Sheet
Assets Liabilities and Owners’ Equity
Current assets Current liabilities
Cash $ 33,504 Accounts payable $ 86,064
Fixed assets
The funds raised by the debt issue can be put into an excess cash account to make the balance sheet
balance. The excess debt will be:
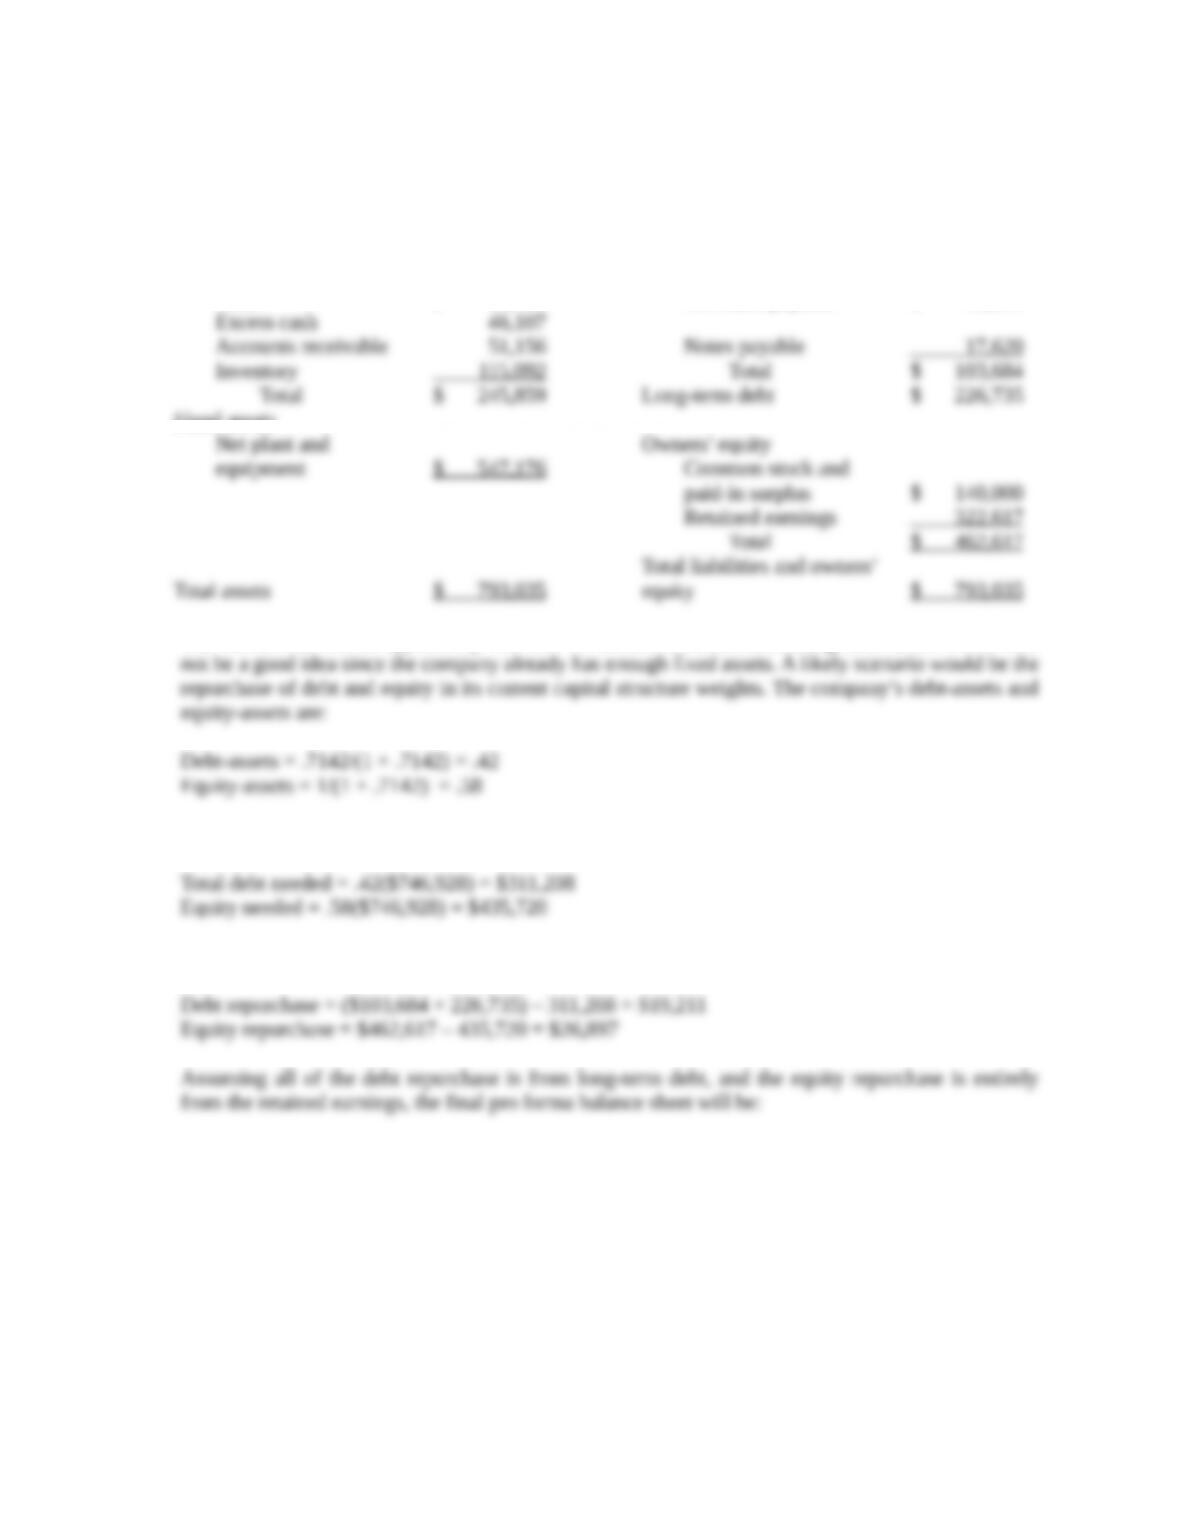
CROSBY INC.
Pro Forma Balance Sheet
Assets Liabilities and Owners’ Equity
Current assets Current liabilities
Cash $ 33,504 Accounts payable $ 86,064
Fixed assets
The excess cash has an opportunity cost that we discussed earlier. Increasing fixed assets would also
So, the amount of debt and equity needed will be:
So, the repurchases of debt and equity will be:
Pro Forma Balance Sheet
Assets Liabilities and Owners’ Equity
Current assets Current liabilities
Cash $ 33,504 Accounts payable $ 86,064
Accounts receivable 51,156 Notes payable 17,620
Challenge