
CHAPTER 13
THE BETA FOR COLGATE-PALMOLIVE
NOTE: The example below shows the results from early 2017. The actual answer to the case will
change based on current market conditions.
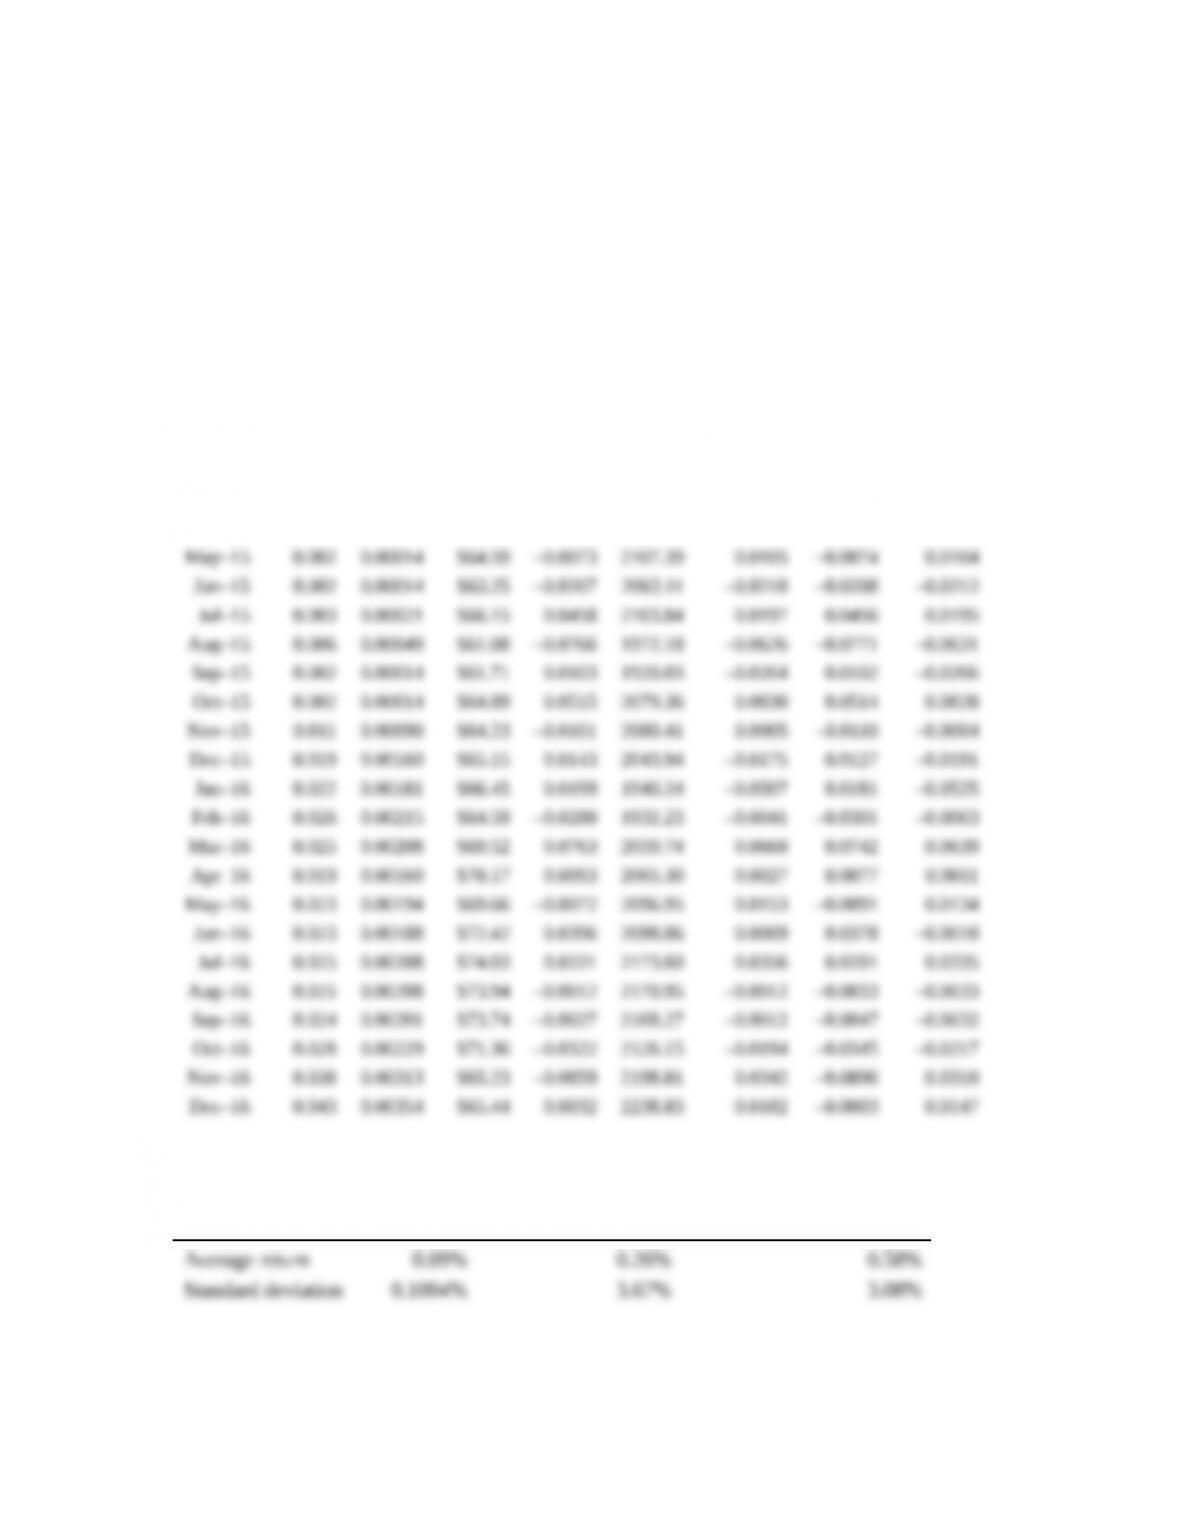
1. The information used for the analysis is presented below. Note that the risk-free rate (3-month T-bill
rate) is expressed as an annual rate. It is necessary to find the monthly rate, so this rate is divided by
12.
Risk-
free
Monthl
y
Risk-
free
Stock
price Return
S&P
500
S&P 500
return
Stock
risk
premium
S&P risk
premium
Dec–11 $41.27 1257.60
Jan–12 0.003 0.00021 $40.79 –0.0117 1312.41 0.0436 –0.0119 0.0434
Feb–12 0.008 0.00063 $41.89 0.0271 1365.68 0.0406 0.0265 0.0400
Mar–12 0.007 0.00056 $43.96 0.0494 1408.47 0.0313 0.0488 0.0308
Apr–12 0.007 0.00056 $44.77 0.0183 1397.91 –0.0075 0.0177 –0.0081
May–12 0.008 0.00063 $44.48 –0.0065 1310.33 –0.0627 –0.0071 –0.0633
CHAPTER 13 C-2
Apr–14 0.003 0.00021 $63.69 0.0430 1883.95 0.0062 0.0428 0.0060
May–14 0.003 0.00021 $64.73 0.0163 1923.57 0.0210 0.0161 0.0208
Jun–14 0.003 0.00028 $64.52 –0.0032 1960.23 0.0191 –0.0035 0.0188
Jul–14 0.003 0.00021 $60.31 –0.0653 1930.67 –0.0151 –0.0655 –0.0153
Aug–14 0.003 0.00021 $61.58 0.0210 2003.37 0.0377 0.0208 0.0374
Sep–14 0.002 0.00014 $62.04 0.0076 1972.29 –0.0155 0.0074 –0.0157
Oct–14 0.002 0.00014 $63.98 0.0312 2018.05 0.0232 0.0311 0.0231
Nov–14 0.002 0.00014 $66.57 0.0405 2067.56 0.0245 0.0404 0.0244
Dec–14 0.003 0.00021 $66.19 –0.0057 2058.90 –0.0042 –0.0060 –0.0044
Jan–15 0.003 0.00021 $64.93 –0.0190 1994.99 –0.0310 –0.0192 –0.0312
Feb–15 0.002 0.00014 $68.10 0.0489 2104.50 0.0549 0.0487 0.0548
Mar–15 0.003 0.00021 $66.68 –0.0209 2067.89 –0.0174 –0.0211 –0.0176
Apr–15 0.002 0.00014 $65.06 –0.0243 2085.51 0.0085 –0.0244 0.0084
Using the Excel functions for the average return and standard deviation, the table below shows the
averages and standard deviations for each of the series.
Last 36 months Risk-free Colgate S&P 500
CHAPTER 13 C-3
Last 60 months Risk-free Colgate S&P 500
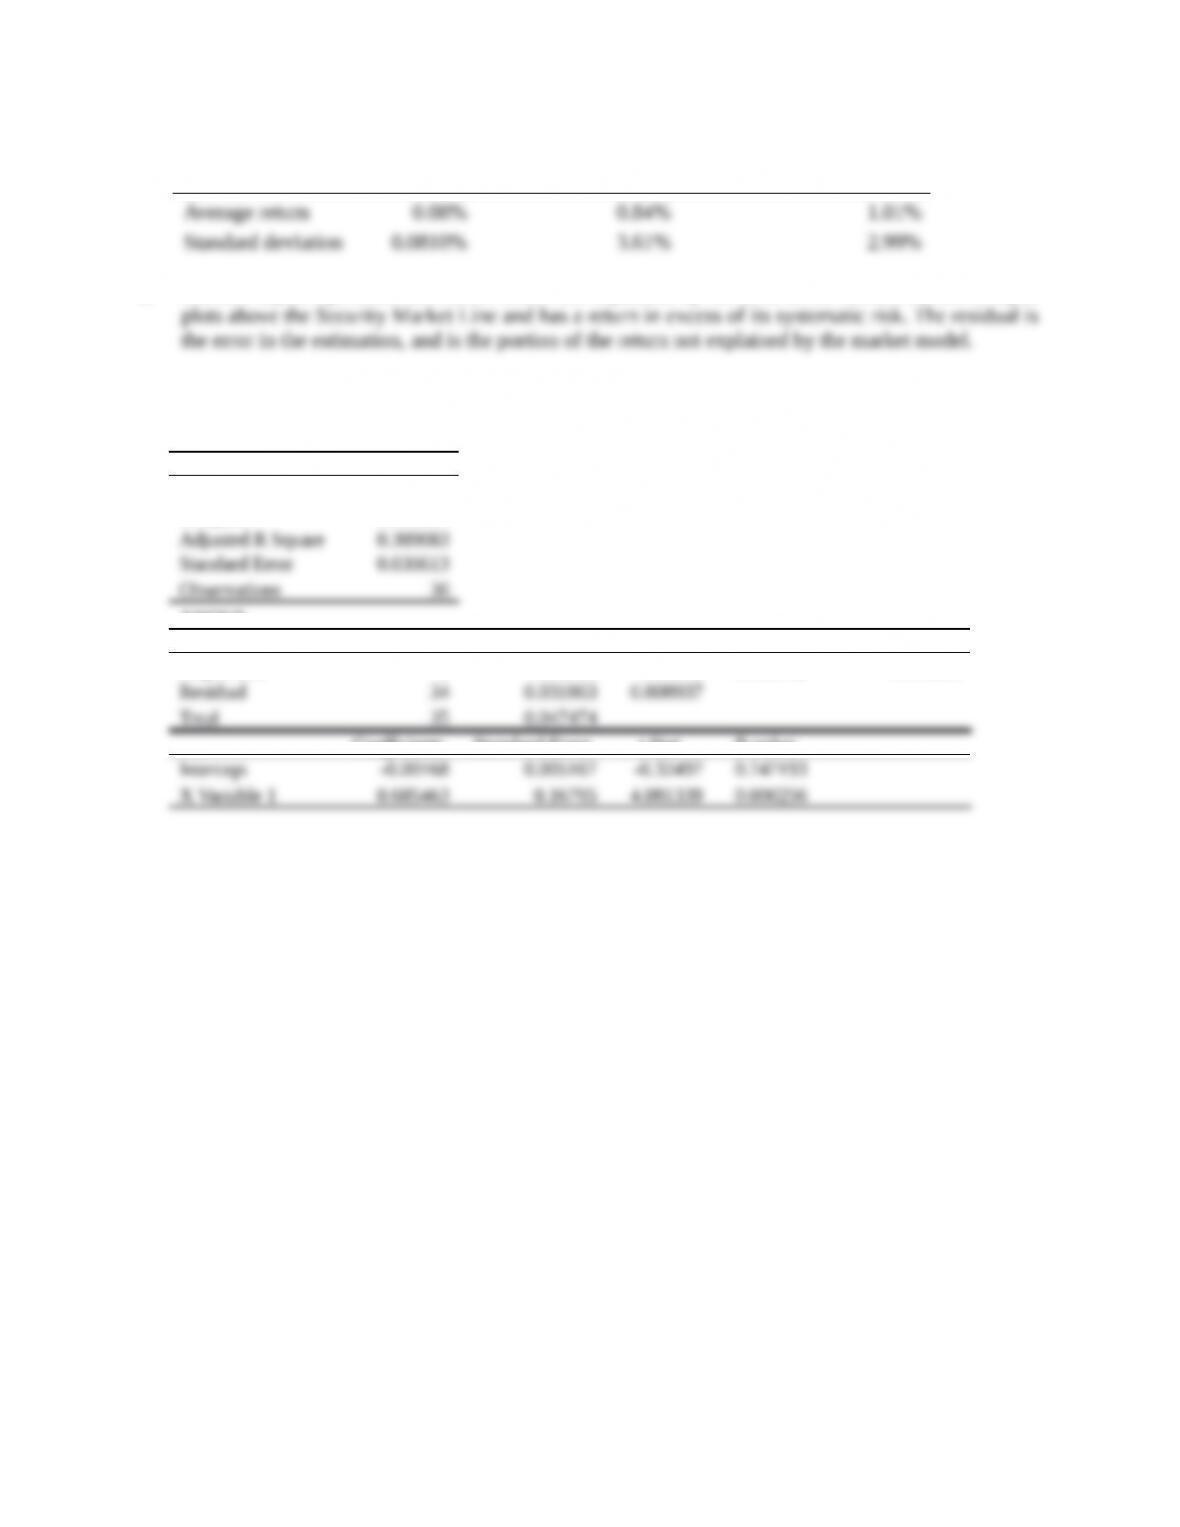
2. Jensen’s alpha represents the excess return not explained by the beta of the stock. A positive alpha
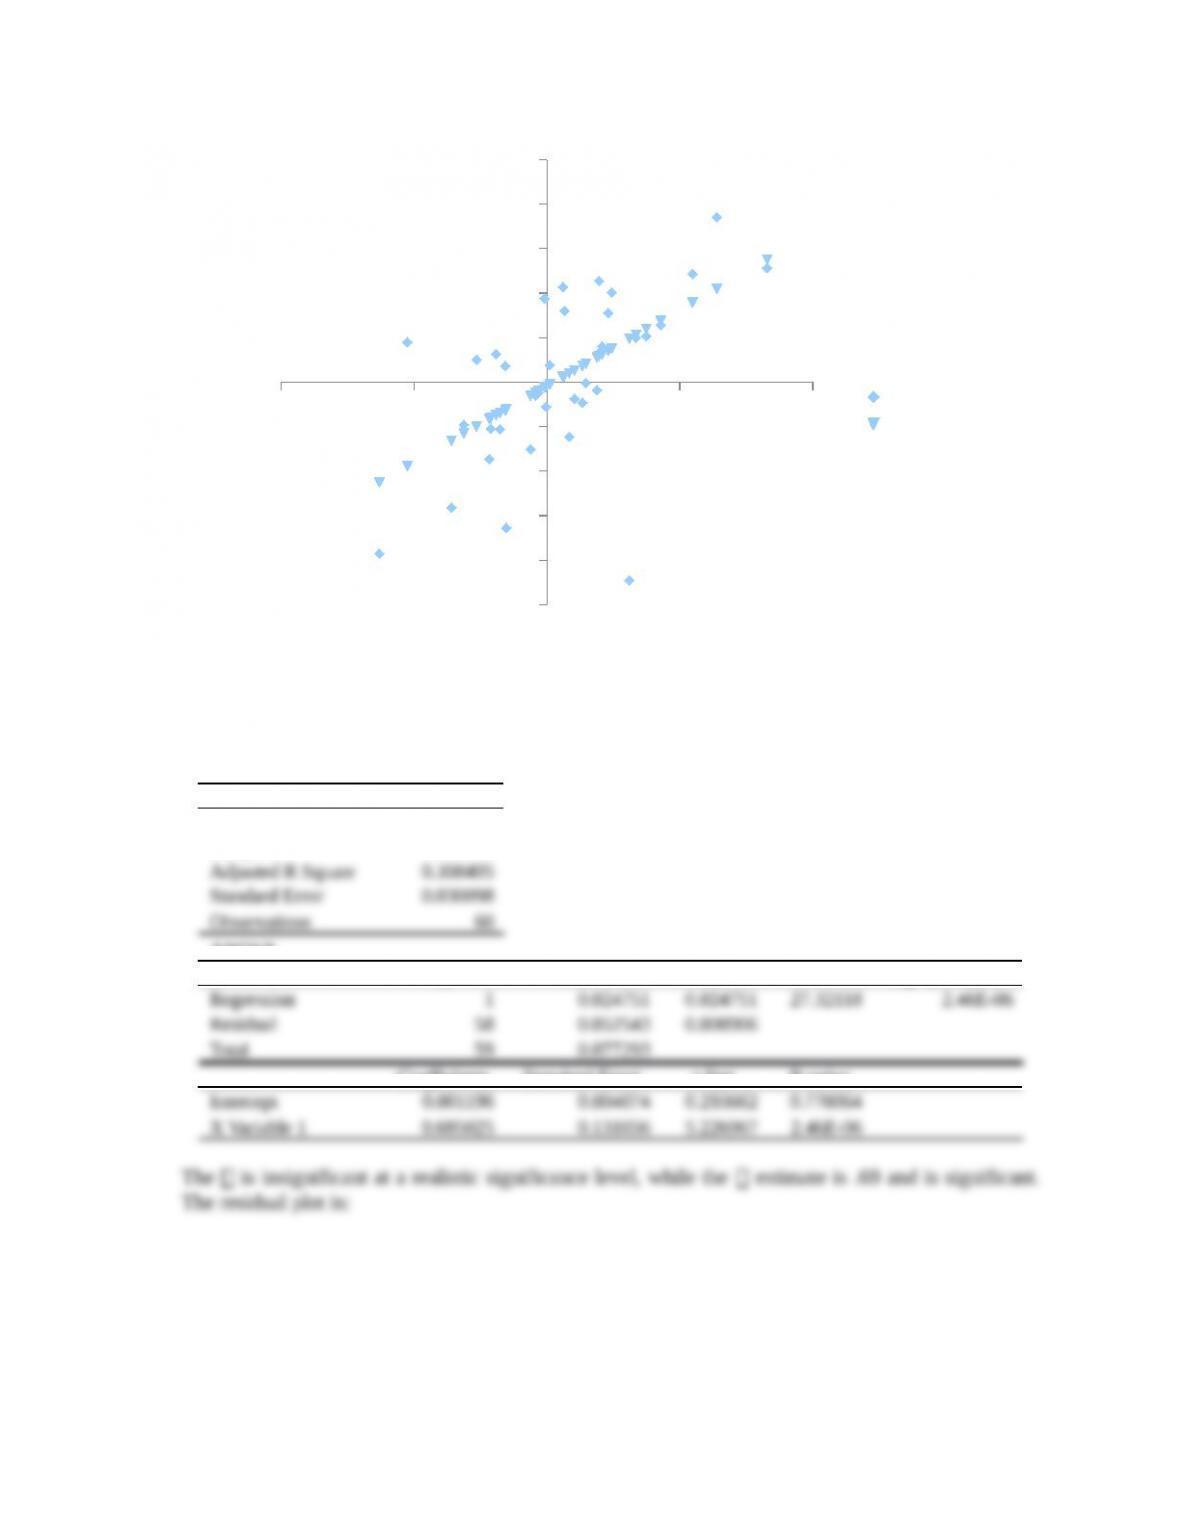
3. The relevant output from Excel for this period is:
SUMMARY OUTPUT
Regression Statistics
Multiple R 0.573431
R Square 0.328824
ANOVA
df SS MS F Significance F
Regression 1 0.01561 0.01561 16.65732 0.000256
Coefficients Standard Error t Stat P-value
The is insignificant at a realistic significance level, while the estimate is .69 and is significant.
The residual plot is:
CHAPTER 13 C-4
-0.1000 -0.0500 0.0000 0.0500 0.1000
-0.1000
-0.0800
-0.0600
-0.0400
-0.0200
0.0000
0.0200
0.0400
0.0600
0.0800
0.1000
Y
Predicted Y
X Variable 1
Y
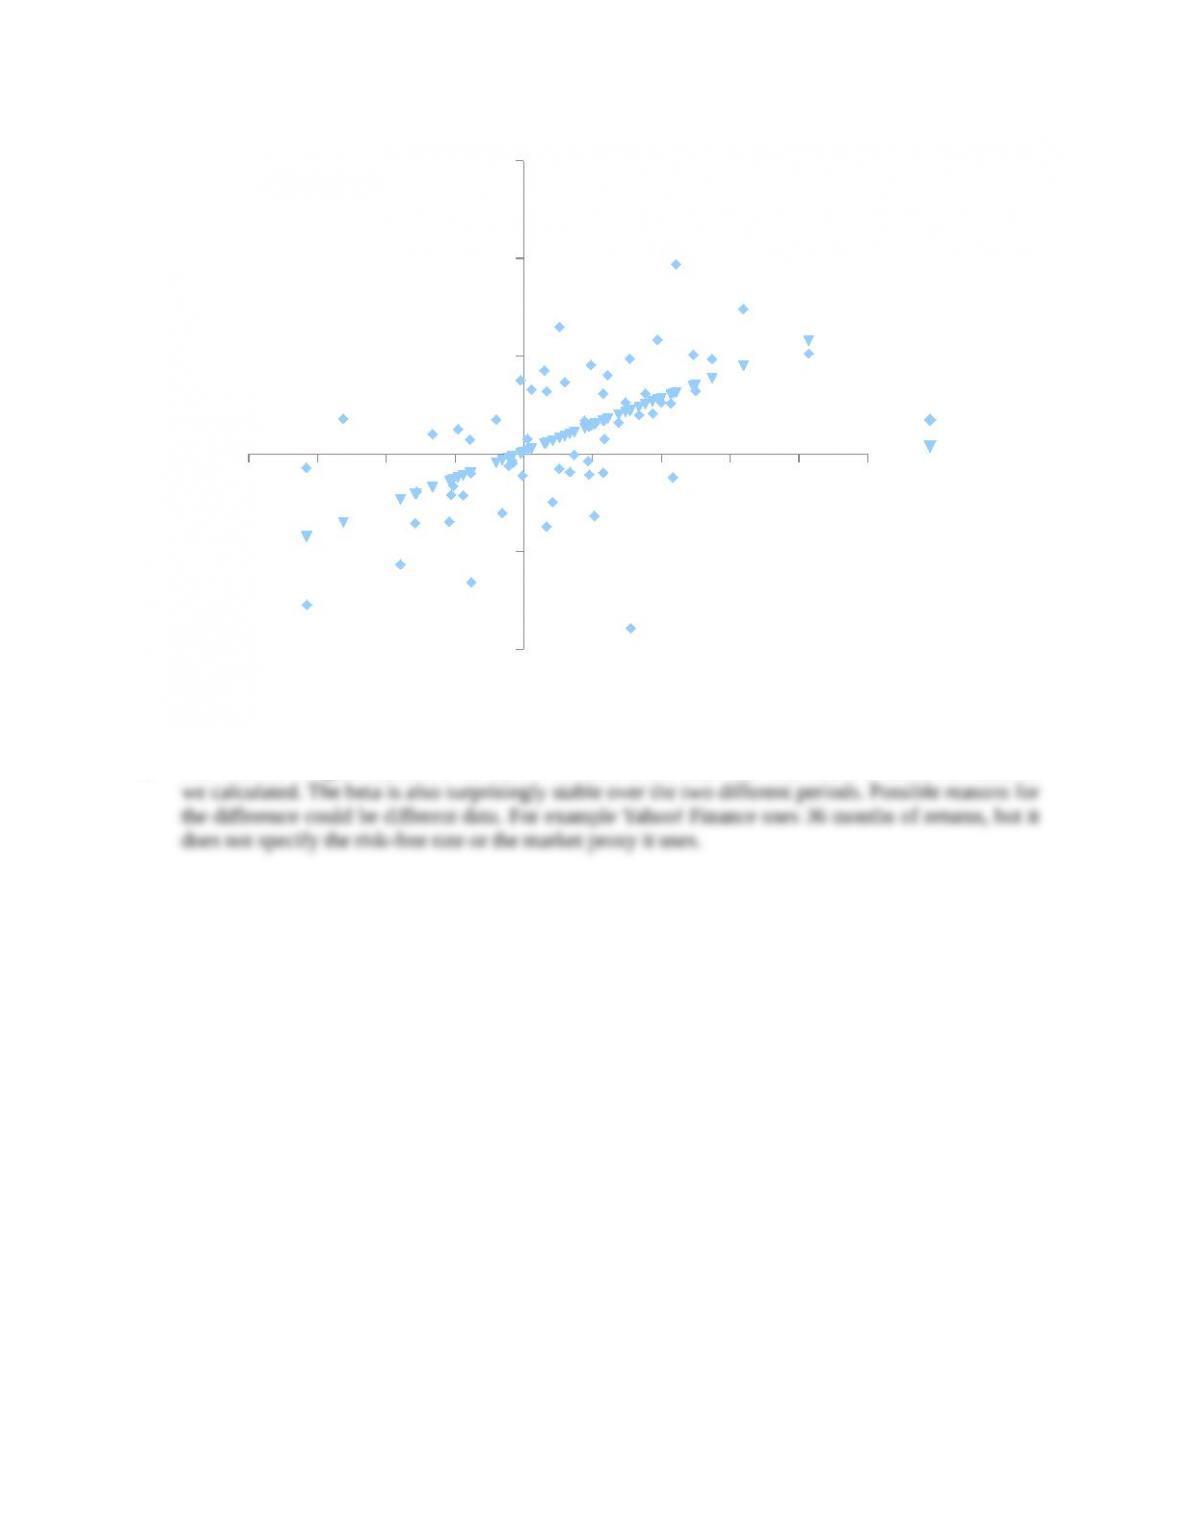
4. The relevant output from Excel for this period is:
SUMMARY OUTPUT
Regression Statistics
Multiple R 0.565876
R Square 0.320216
Adjusted R Square 0.308495
Standard Error 0.030098
Observations 60
ANOVA
df SS MS F Significance F
Coefficients Standard Error t Stat P-value
The is insignificant at a realistic significance level, while the estimate is .69 and is significant.
The residual plot is:
CHAPTER 13 C-5
-0.0800–0.0600–0.0400–0.02000.0000 0.0200 0.0400 0.0600 0.0800 0.1000
-0.1000
-0.0500
0.0000
0.0500
0.1000
0.1500
Y
Predicted Y
X Variable 1
Y
5. The beta for Colgate-Palmolive on Yahoo! Finance at the time was .68, which is about the same as

CHAPTER 25 C-6