© The McGraw-Hill Companies, Inc., 2018. All rights reserved.
Solutions Manual, Chapter 5 71
Problem 5-29 (continued)
3. The major factor would be the sensitivity of the company’s operations to
cyclical movements in the economy. Because the new equipment will
increase the CM ratio, in years of strong economic activity, the company
will be better off with the new equipment. However, in economic
4. No information is given in the problem concerning the new variable
expenses or the new contribution margin ratio. Both of these items must
be determined before the new break-even point can be computed. The
computations are:
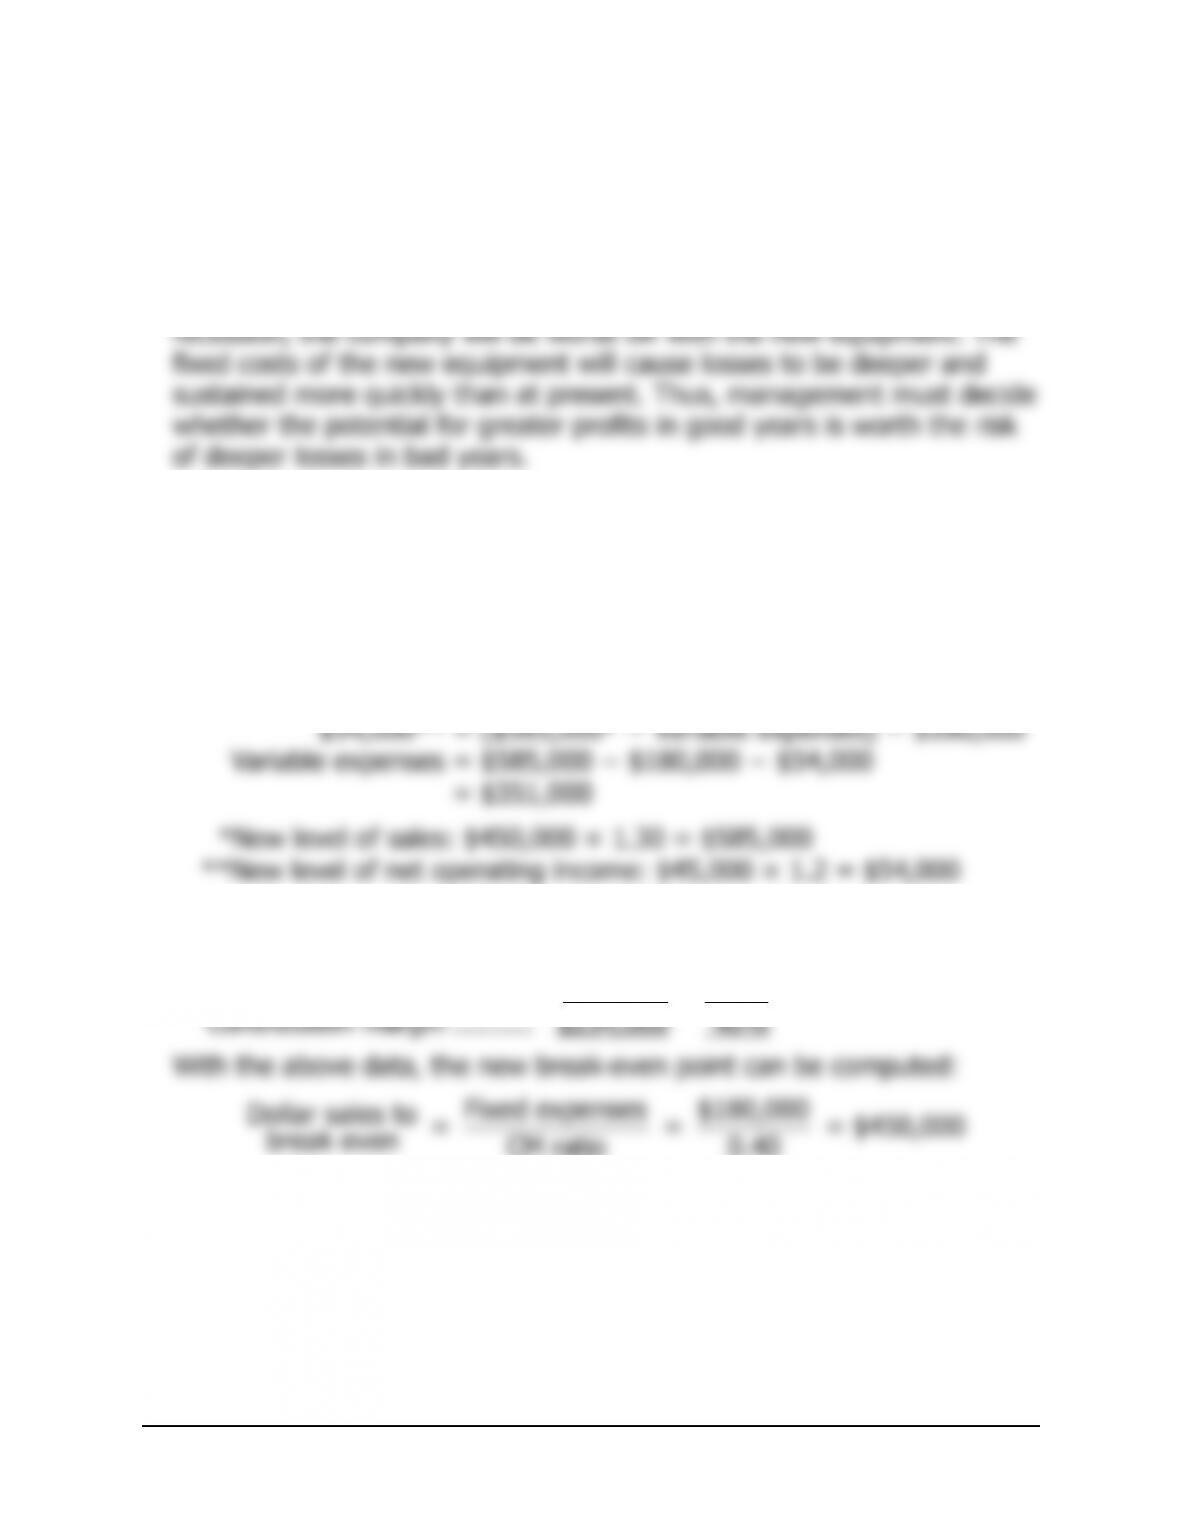
New variable expenses:
Profit = (Sales − Variable expenses) − Fixed expenses
New CM ratio:
Sales ………………………….. $585,000 100%
V
ariable expenses …………. 351,000 60%
© The McGraw-Hill Companies, Inc., 2018. All rights reserved.
72 Managerial Accounting, 16th Edition
Problem 5-29 (continued)
The greatest risk is that the increases in sales and net operating income
predicted by the marketing manager will not happen and that sales will
remain at their present level. Note that the present level of sales is
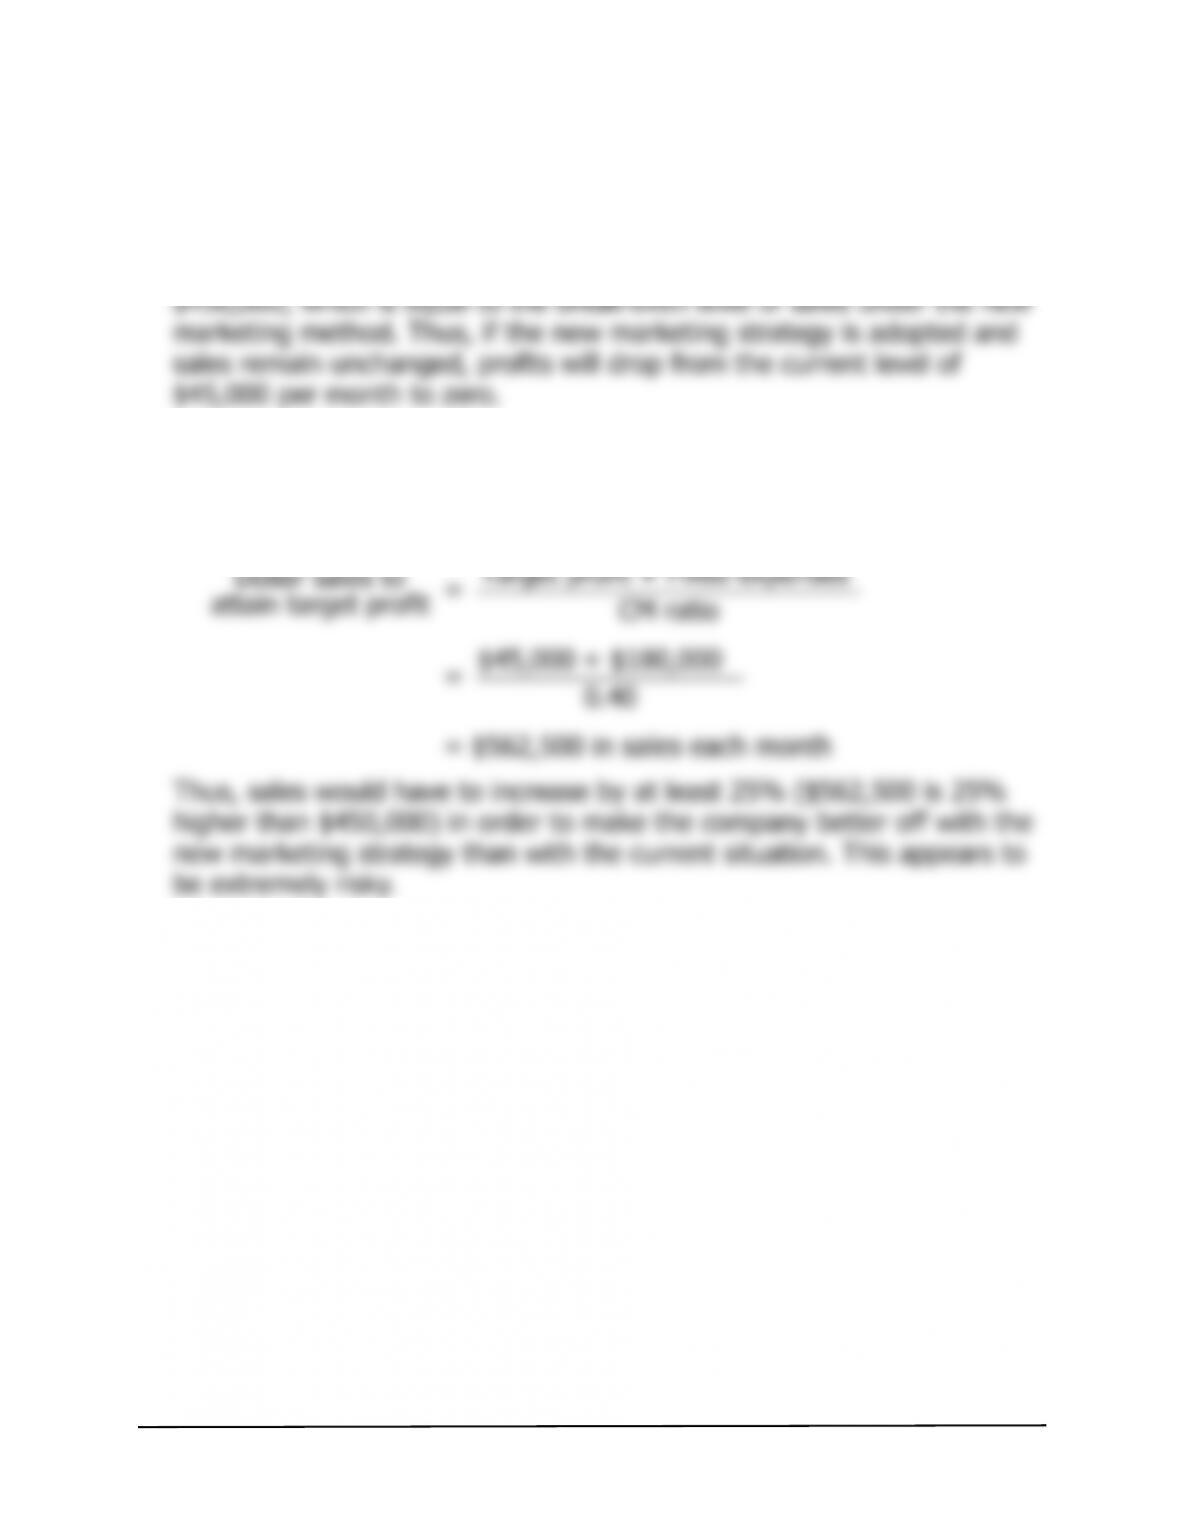
It would be a good idea to compare the new marketing strategy to the
current situation more directly. What level of sales would be needed
under the new method to generate at least the $45,000 in profits the
company is currently earning each month? The computations are:
© The McGraw-Hill Companies, Inc., 2018. All rights reserved.
Solutions Manual, Chapter 5 73
Problem 5-30 (60 minutes)
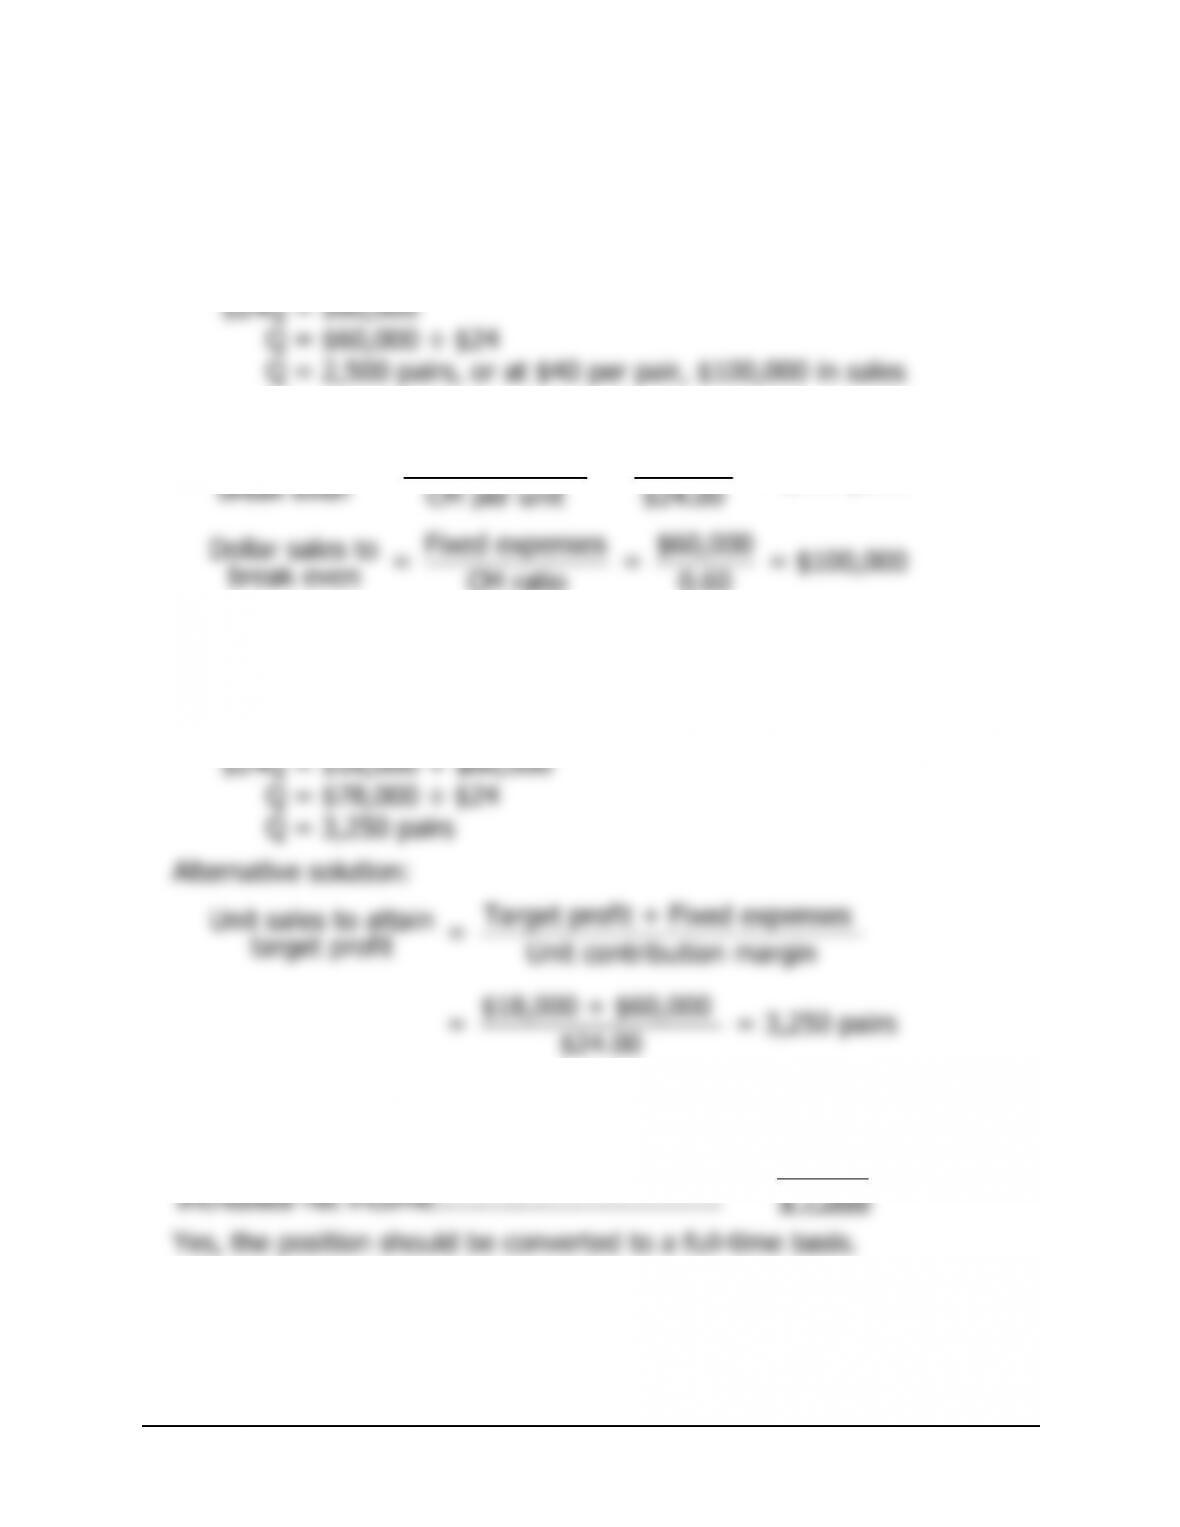
1. Profit = Unit CM × Q − Fixed expenses
$0 = ($40 − $16) × Q − $60,000
$0 = ($24) × Q − $60,000
Alternative solution:
Fixed expenses $60,000
Unit sales to = = = 2,500 pairs
2. See the graphs at the end of this solution.
3. Profit = Unit CM × Q − Fixed expenses
$18,000 = $24 × Q − $60,000
4. Incremental contribution mar
g
in:
$25,000 increased sales × 60% CM ratio …. $15,000
Incremental fixed salary cost …………………… 8,000
© The McGraw-Hill Companies, Inc., 2018. All rights reserved.
74 Managerial Accounting, 16th Edition
Problem 5-30 (continued)
5. a. Contribution margin $72,000
Degree of = = = 6
b. 6 × 50% sales increase = 300%
increase
in net operating income.
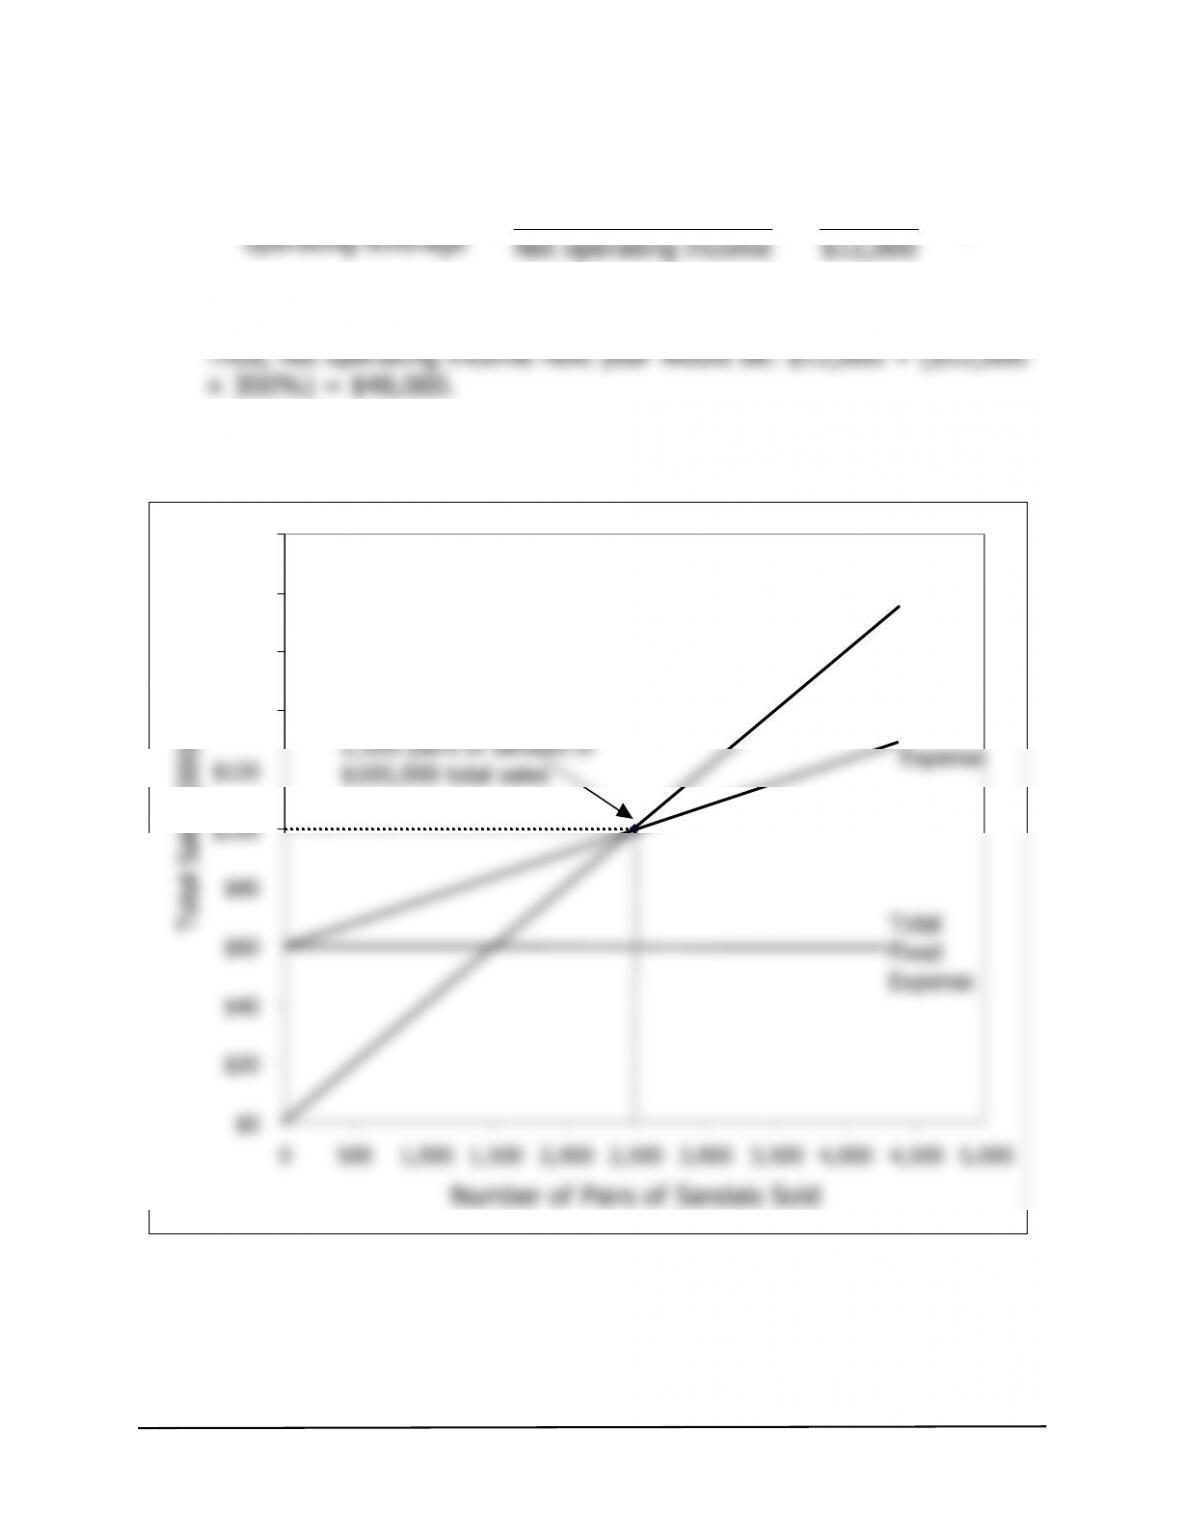
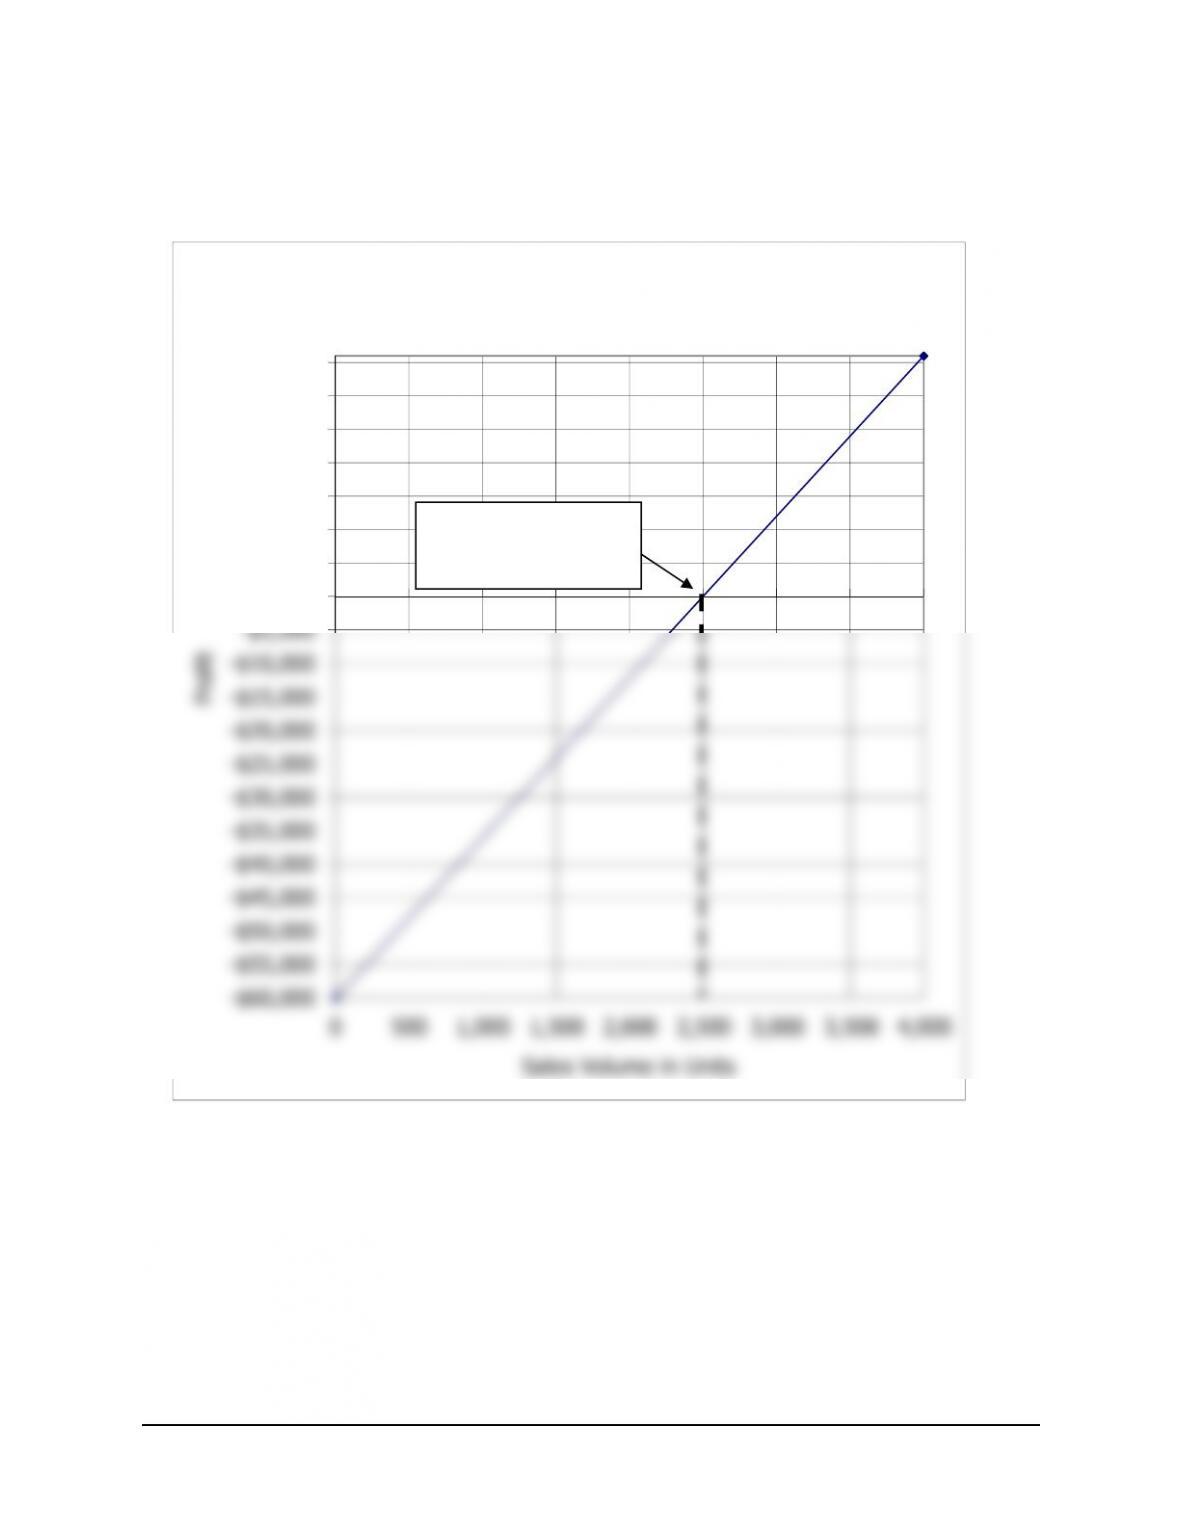
2. Cost-volume-profit graph:
$140
$160
$180
$200
Break–even point:
Total Sales
Total
© The McGraw-Hill Companies, Inc., 2018. All rights reserved.
Solutions Manual, Chapter 5 75
Problem 5-30 (continued)
Profit graph:
$0
$5,000
$10,000
$15,000
$20,000
$25,000
$30,000
$35,000
Profit Graph
Break-even point:
2,500 sandals
© The McGraw-Hill Companies, Inc., 2018. All rights reserved.
76 Managerial Accounting, 16th Edition
Problem 5-31 (30 minutes)
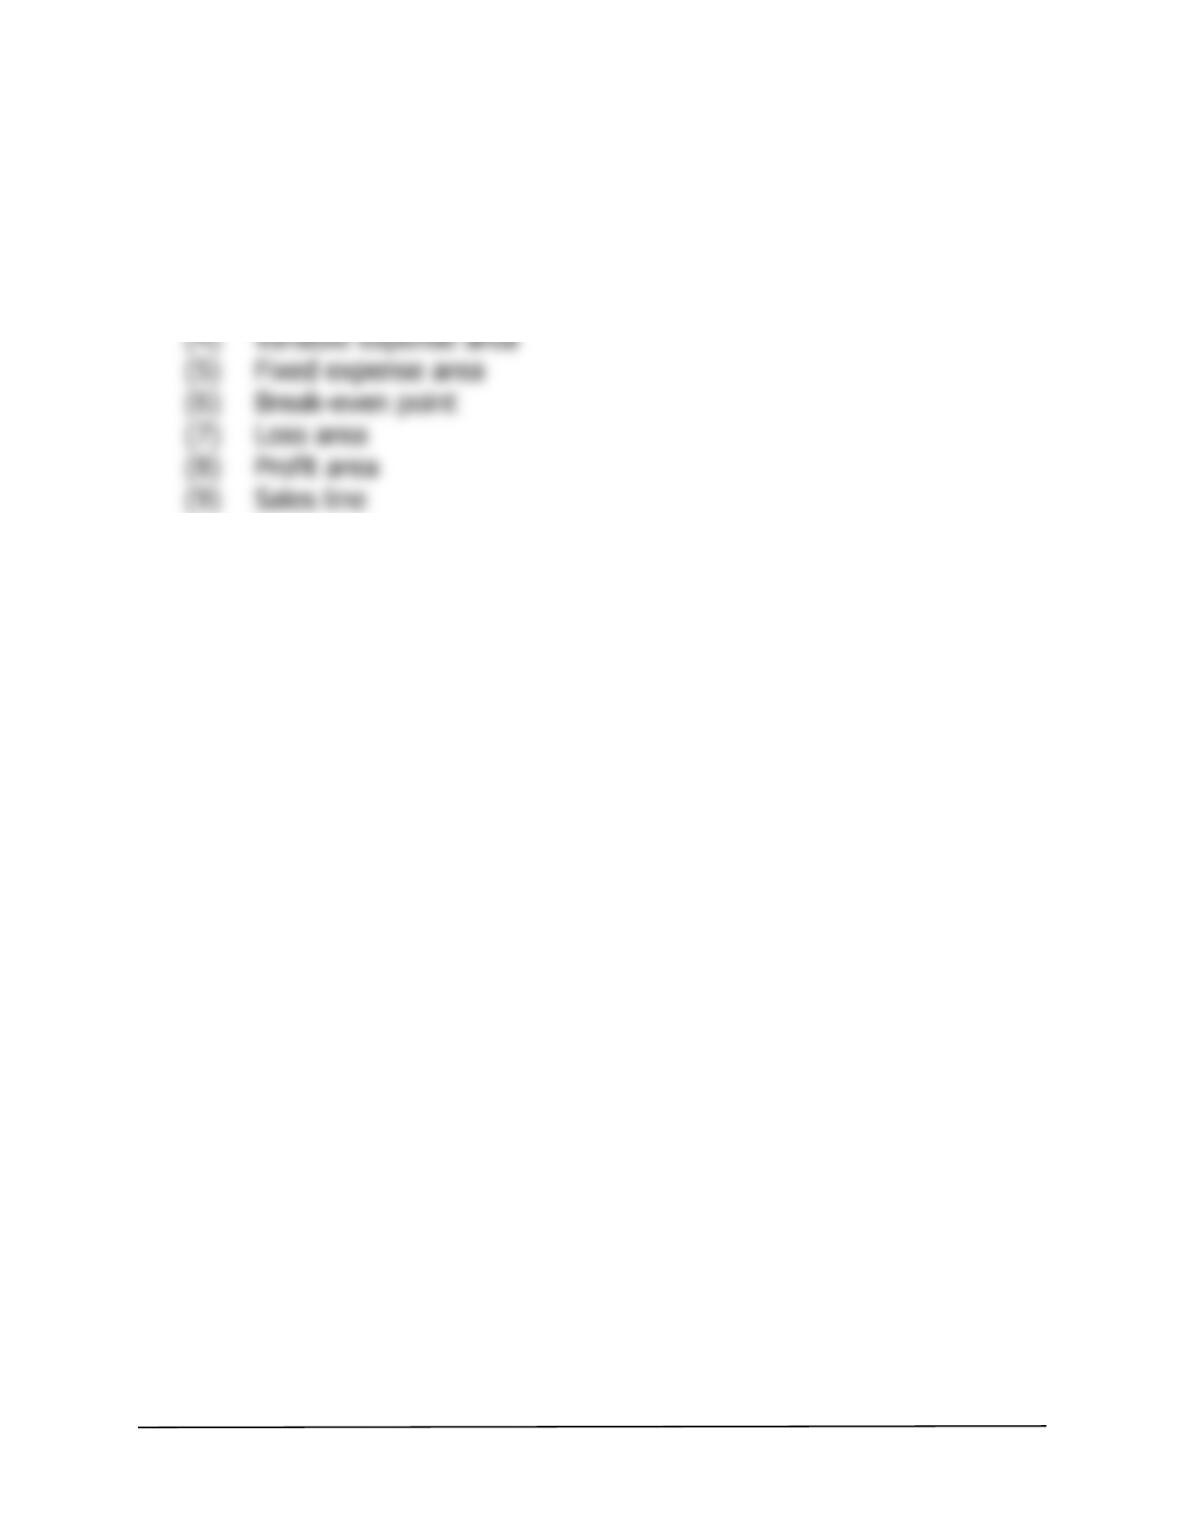
1. (1) Dollars
(2)
V
olume of output, expressed in units, % of capacity, sales,
or some other measure
(3)
T
otal expense line
V
© The McGraw-Hill Companies, Inc., 2018. All rights reserved.
Solutions Manual, Chapter 5 77
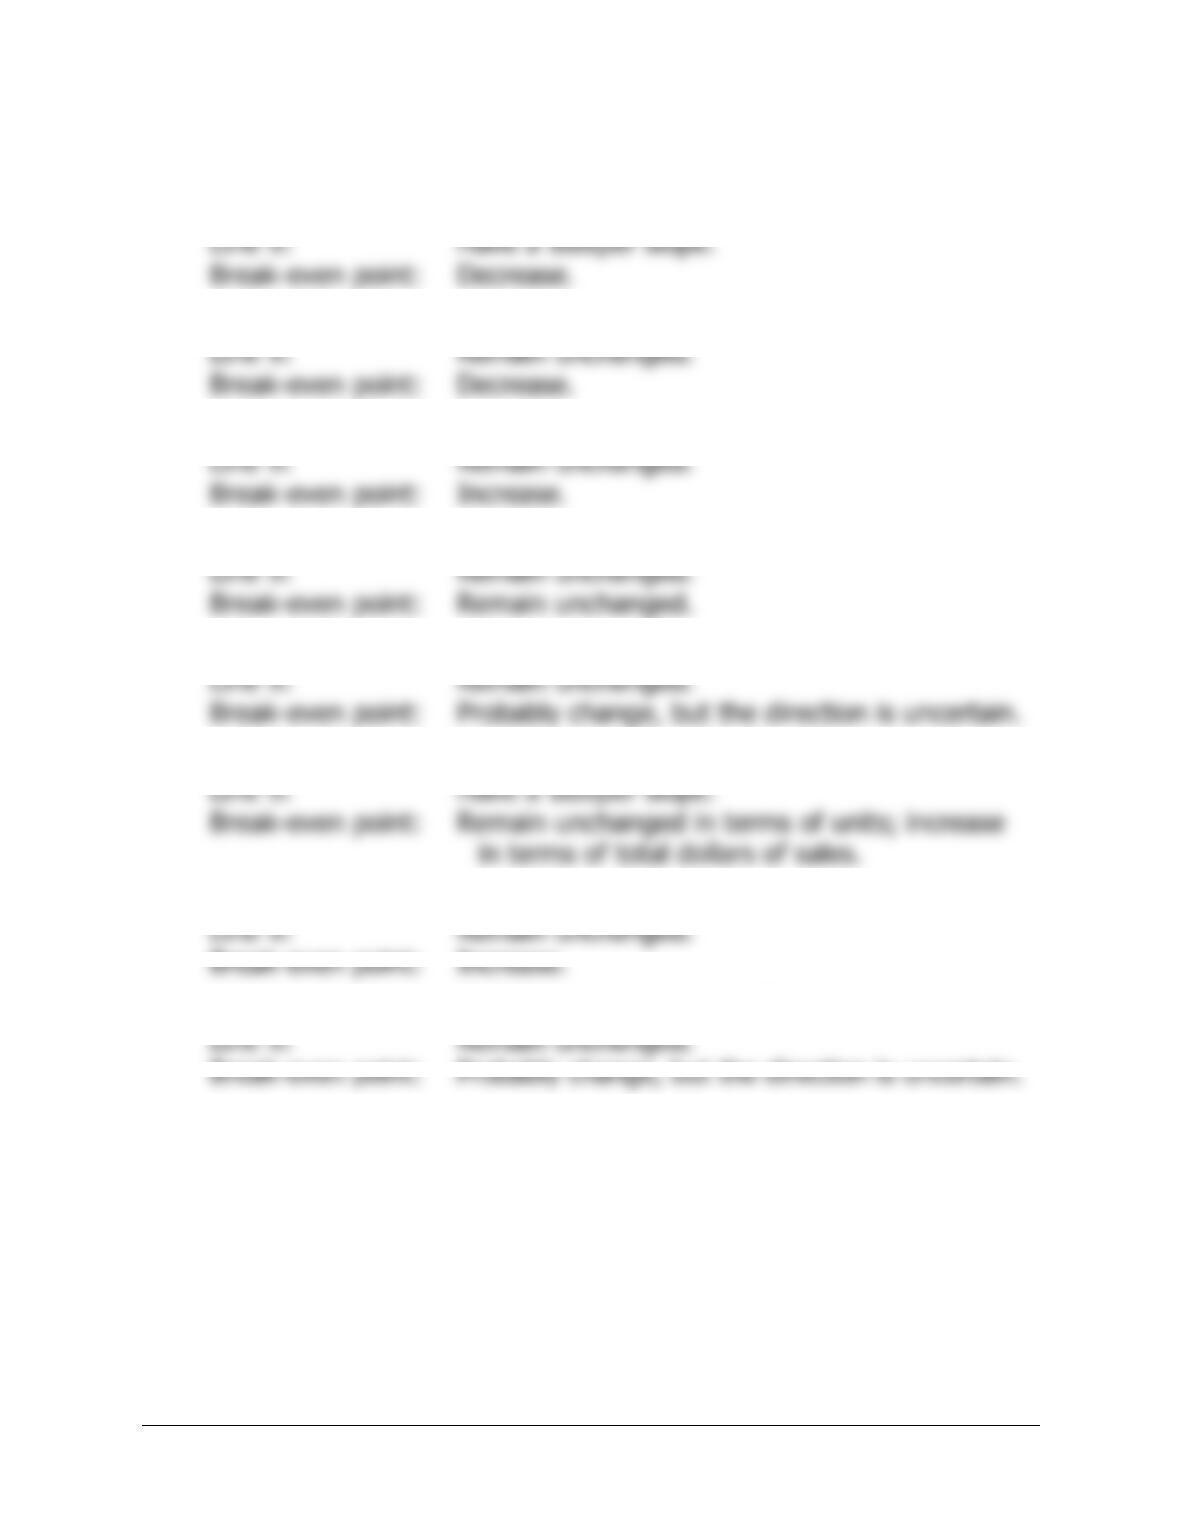
Problem 5-31 (continued)
2. a. Line 3: Remain unchan
g
ed.
b. Line 3: Have a flatter slope.
g
c. Line 3: Shift upward.
g
d. Line 3: Remain unchan
g
ed.
g
g
e. Line 3: Shift downward and have a steeper slope.
g
f. Line 3: Have a steeper slope.
g
g
. Line 3: Shift upward.
Line 9: Remain unchan
g
ed.
h. Line 3: Shift upward and have a flatter slope.
g
© The McGraw-Hill Companies, Inc., 2018. All rights reserved.
78 Managerial Accounting, 16th Edition
Case 5-32 (60 minutes)
Note: This is a problem that will challenge the very best students’ conceptual
and analytical skills. However, working through this case will yield substantial
dividends in terms of a much deeper understanding of critical management
accounting concepts.
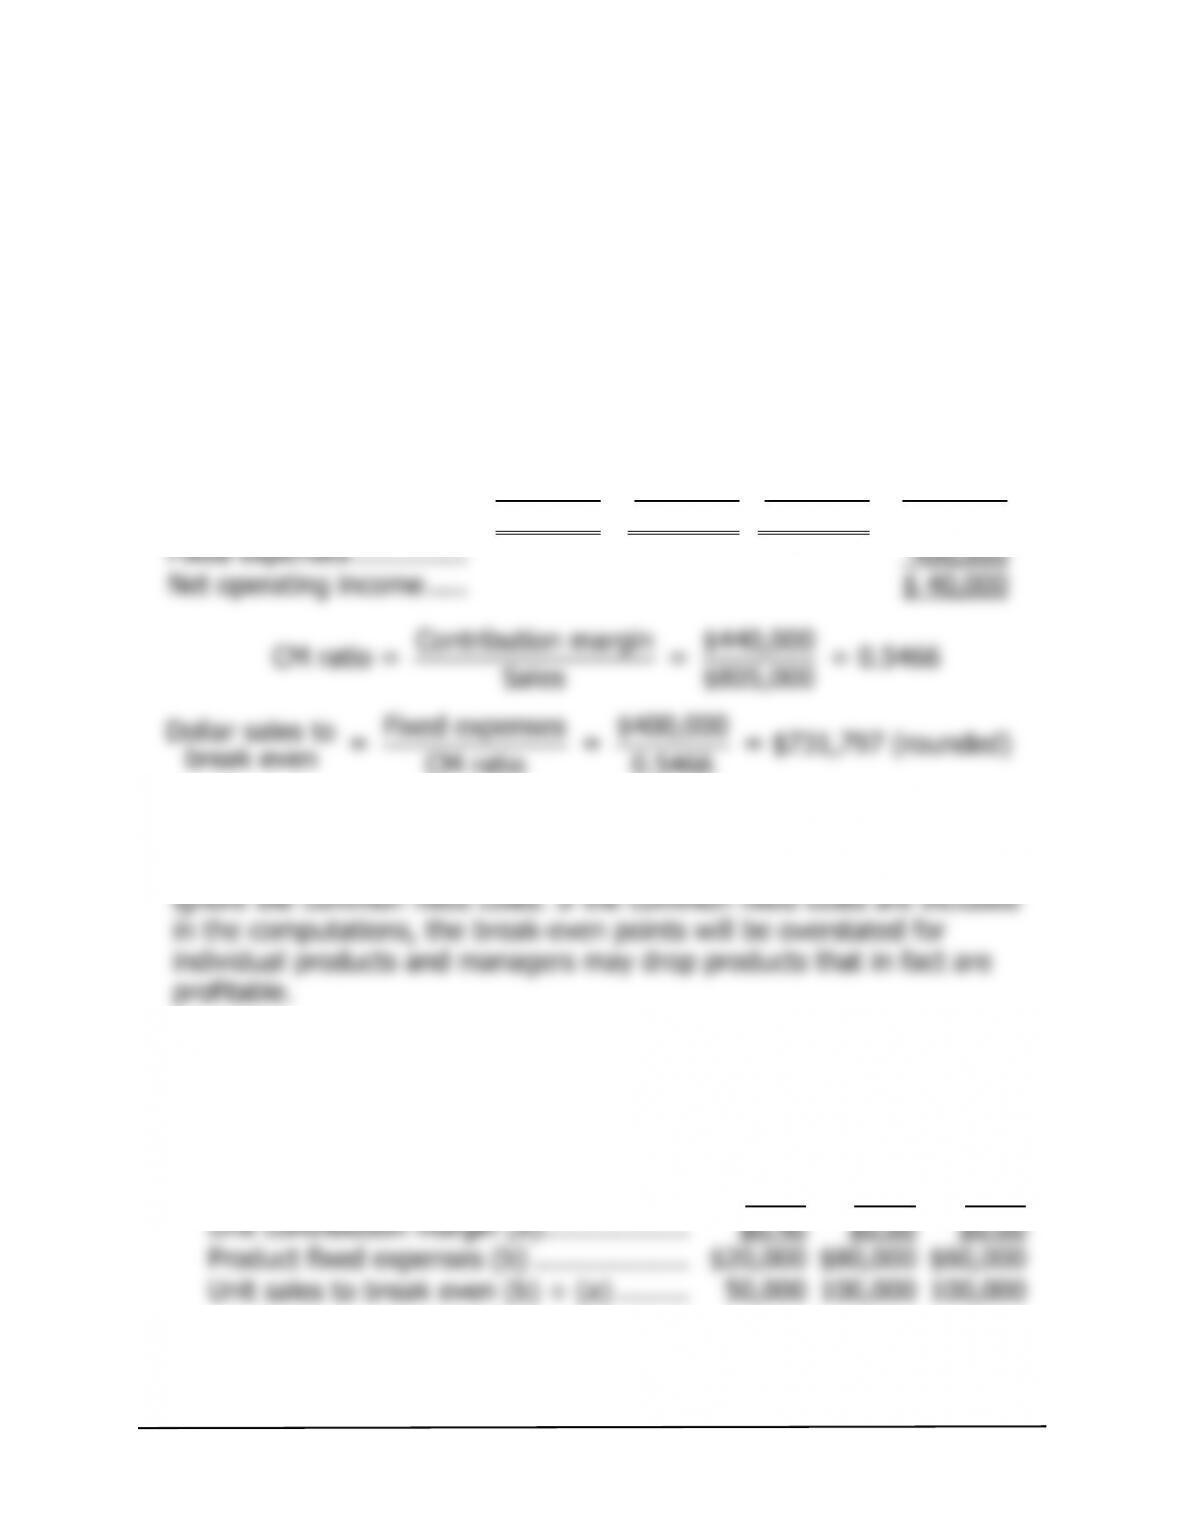
1. The overall break-even sales can be determined using the CM ratio.
Velcro Metal Nylon Total
Sales……………………….. $165,000 $300,000 $340,000 $805,000
V
ariable expenses ………. 125,000 140,000 100,000 365,000
Contribution mar
g
in ..….. $ 40,000 $160,000 $240,000 440,000
2. The issue is what to do with the common fixed cost when computing
the break-evens for the individual products. The correct approach is to
a. The break-even points for each product can be computed using the
contribution margin approach as follows:
Velcro Metal Nylon
Unit sellin
g
price ……………………………. $1.65 $1.50 $0.85
V
ariable cost per unit ……………………… 1.25 0.70 0.25
© The McGraw-Hill Companies, Inc., 2018. All rights reserved.
Solutions Manual, Chapter 5 79
Case 5-32 (continued)
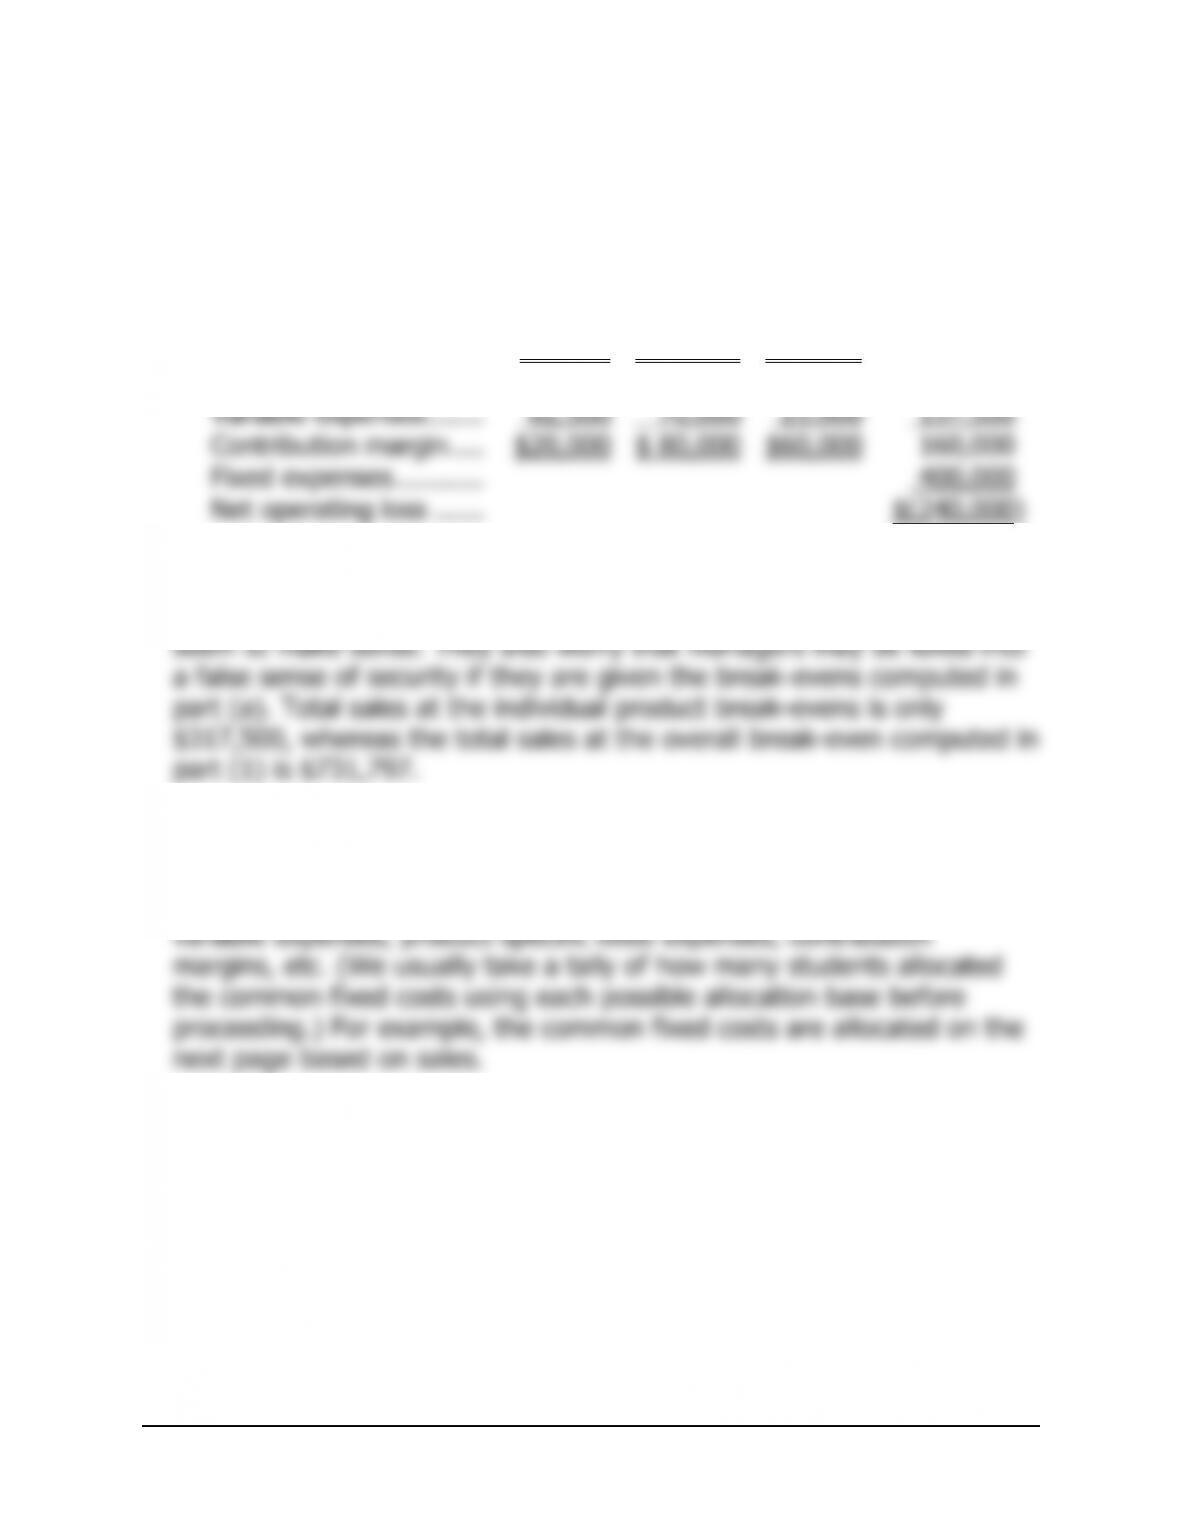
b. If the company were to sell exactly the break-even quantities
computed above, the company would lose $240,000—the amount of
the common fixed cost. This can be verified as follows:
Velcro Metal Nylon Total
Unit sales ………………. 50,000 100,000 100,000
Sales ……………………. $82,500 $150,000 $85,000 $317,500
At this point, many students conclude that something is wrong with
their answer to part (a) because a result in which the company loses
money operating at the break-evens for the individual products does not
Many students (and managers, for that matter) attempt to resolve this
apparent paradox by allocating the common fixed costs among the
products prior to computing the break-evens for individual products. Any
of a number of allocation bases could be used for this purpose—sales,
© The McGraw-Hill Companies, Inc., 2018. All rights reserved.
80 Managerial Accounting, 16th Edition
Case 5-32 (continued)
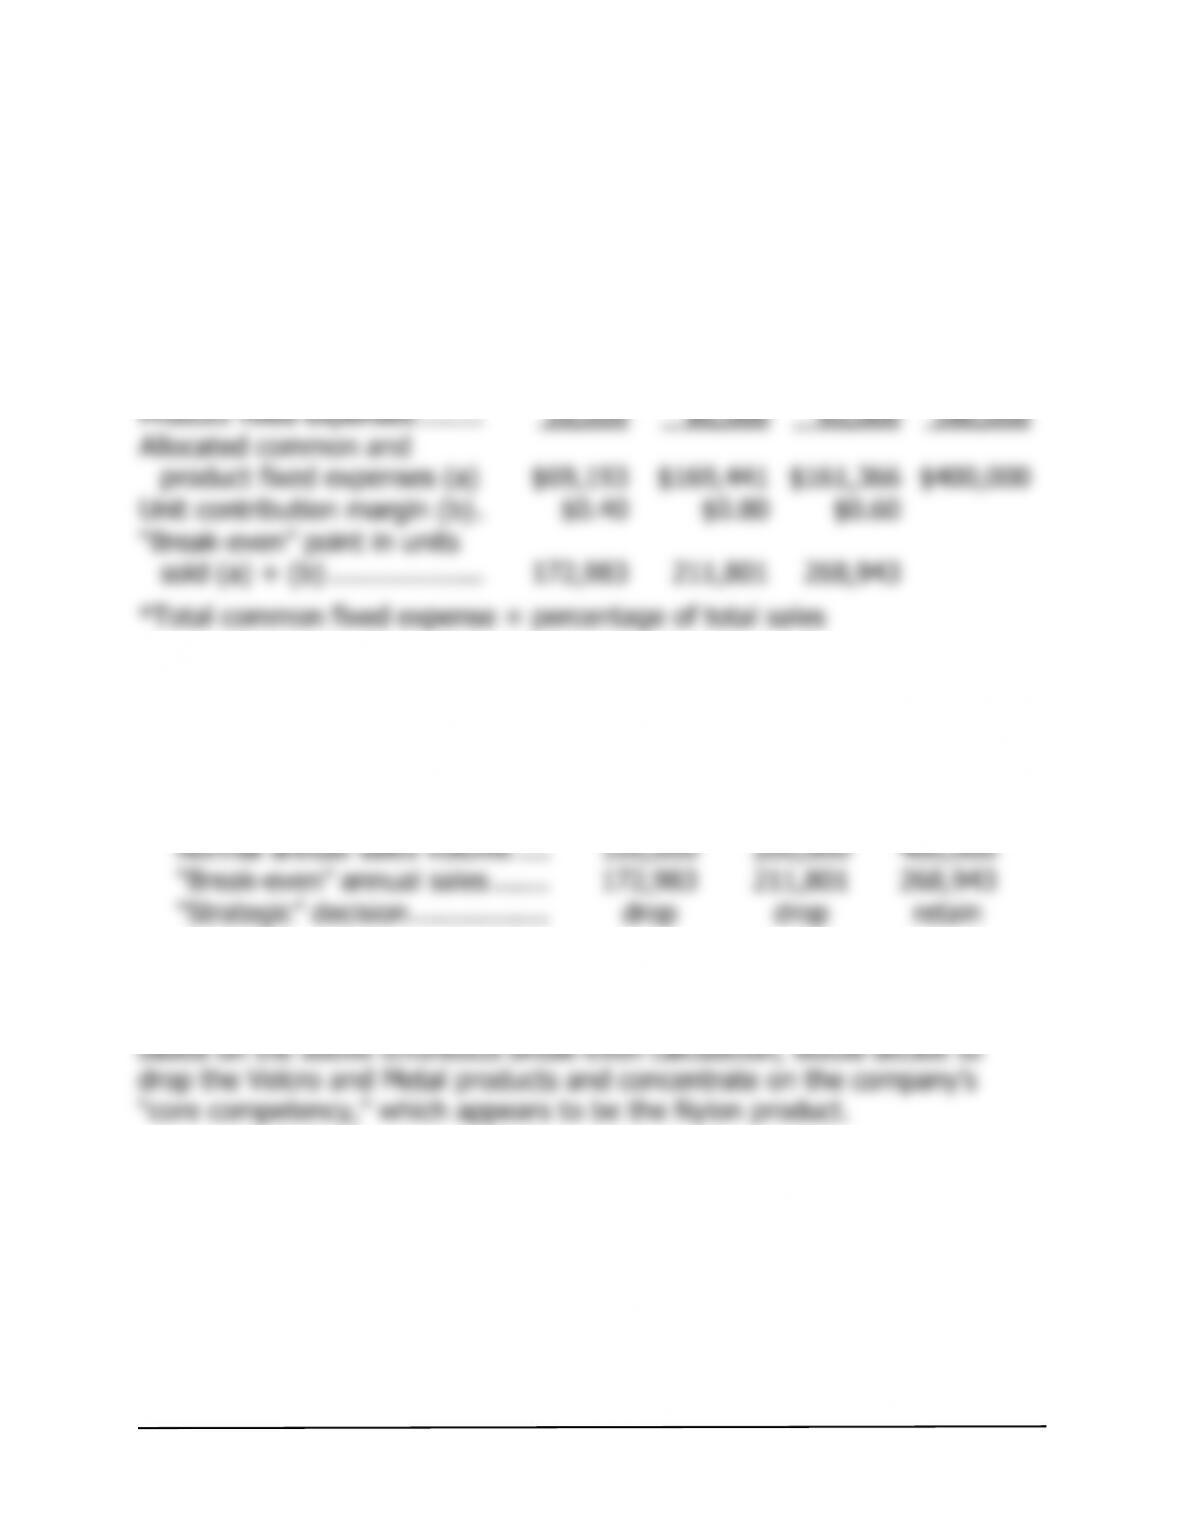
Allocation of common fixed expenses on the basis of sales revenue:
Velcro Metal Nylon Total
Sales ……….…………………… $165,000 $300,000 $340,000 $805,000
Percenta
g
e of total sales …… 20.497% 37.267% 42.236% 100.0%
A
llocated common fixed
expense* ……………………. $49,193 $ 89,441 $101,366 $240,000
A
“
If the company sells 172,983 units of the Velcro product, 211,801 units of
the Metal product, and 268,943 units of the Nylon product, the company
will indeed break even overall. However, the apparent break-evens for two
of the products are higher than their normal annual sales.
Velcro Metal Nylon
“
“
It would be natural for managers to interpret a break-even for a product as
the level of sales below which the company would be financially better off
dropping the product. Therefore, we should not be surprised if managers,