© The McGraw-Hill Companies, Inc., 2018. All rights reserved.
Solutions Manual, Chapter 1 51
Case 1-26 (continued)
2. The average product cost for one patio set would be:
Direct …………………………………………. $212,000
3. The average product cost per set would increase if the production
4. a. Yes, the president may expect a minimum price of $153, which is the
average cost to manufacture one set. He might expect a price even
higher than this to cover a portion of the administrative costs as well.
The brother-in-law probably is thinking of cost as including only direct
b. The term is opportunity cost. The full, regular price of a set might be
appropriate here, because the company is operating at full capacity,
© The McGraw-Hill Companies, Inc., 2018. All rights reserved.
52 Managerial Accounting, 16th Edition
Case 1-27 (30 minutes)
1. A cost that is classified as a period cost will be recognized on the income
statement as an expense in the current period. A cost that is classified
as a product cost will be recognized on the income statement as an
expense (i.e., cost of goods sold) only when the associated units of
2. The discussion below is divided into two parts—Gallant’s actions to
The decision to postpone expenditures is questionable. It is one thing to
postpone expenditures due to a cash bind; it is quite another to
postpone expenditures in order to hit a profit target. Postponing these
expenditures may have the effect of ultimately increasing future costs
Gallant’s decision to reclassify period costs is not ethical—assuming that
there is no intention of disclosing in the financial reports this
reclassification. Such a reclassification would be a violation of the
principle of consistency in financial reporting and is a clear attempt to
mislead readers of the financial reports. Although some may argue that
© The McGraw-Hill Companies, Inc., 2018. All rights reserved.
Solutions Manual, Appendix 1A 53
Appendix 1A
Cost of Quality
Exercise 1A-1 (10 minutes)
1. Quality of conformance
2. Quality costs
3. Quality circles
4. Prevention costs, appraisal costs
5. Internal failure costs, external failure costs
© The McGraw-Hill Companies, Inc., 2018. All rights reserved.
54 Managerial Accounting, 16th Edition
Exercise 1A-2 (15 minutes)
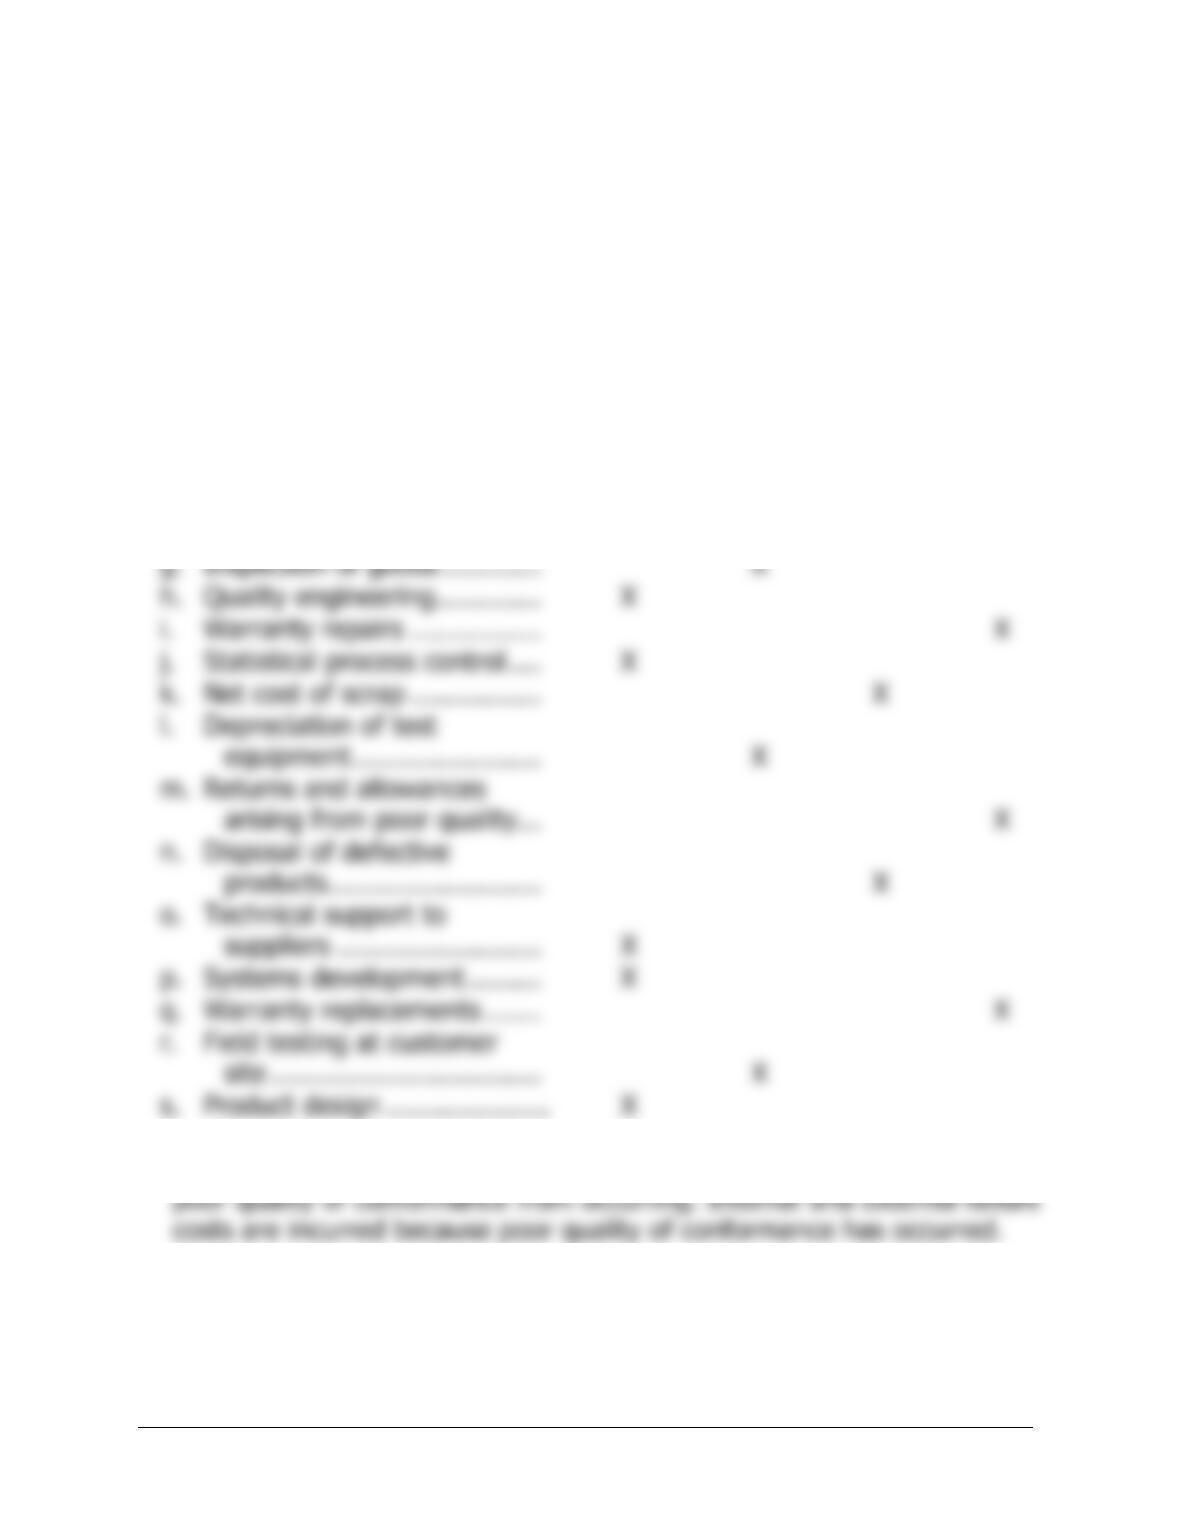
1.
Prevention
Cost
A
ppraisal
Cost
Internal
Failure
Cost
External
Failure
Cost
a. Product testin
g
………………. X
b. Product recalls ………………. X
c. Rework labor and overhead. X
d. Quality circles ………………… X
e. Downtime caused by
defects ………………………. X
f. Cost of field servicin
g
………. X
g
2. Prevention costs and appraisal costs are incurred in an effort to keep
© The McGraw-Hill Companies, Inc., 2018. All rights reserved.
Solutions Manual, Appendix 1A 55
Problem 1A-3 (60 minutes)
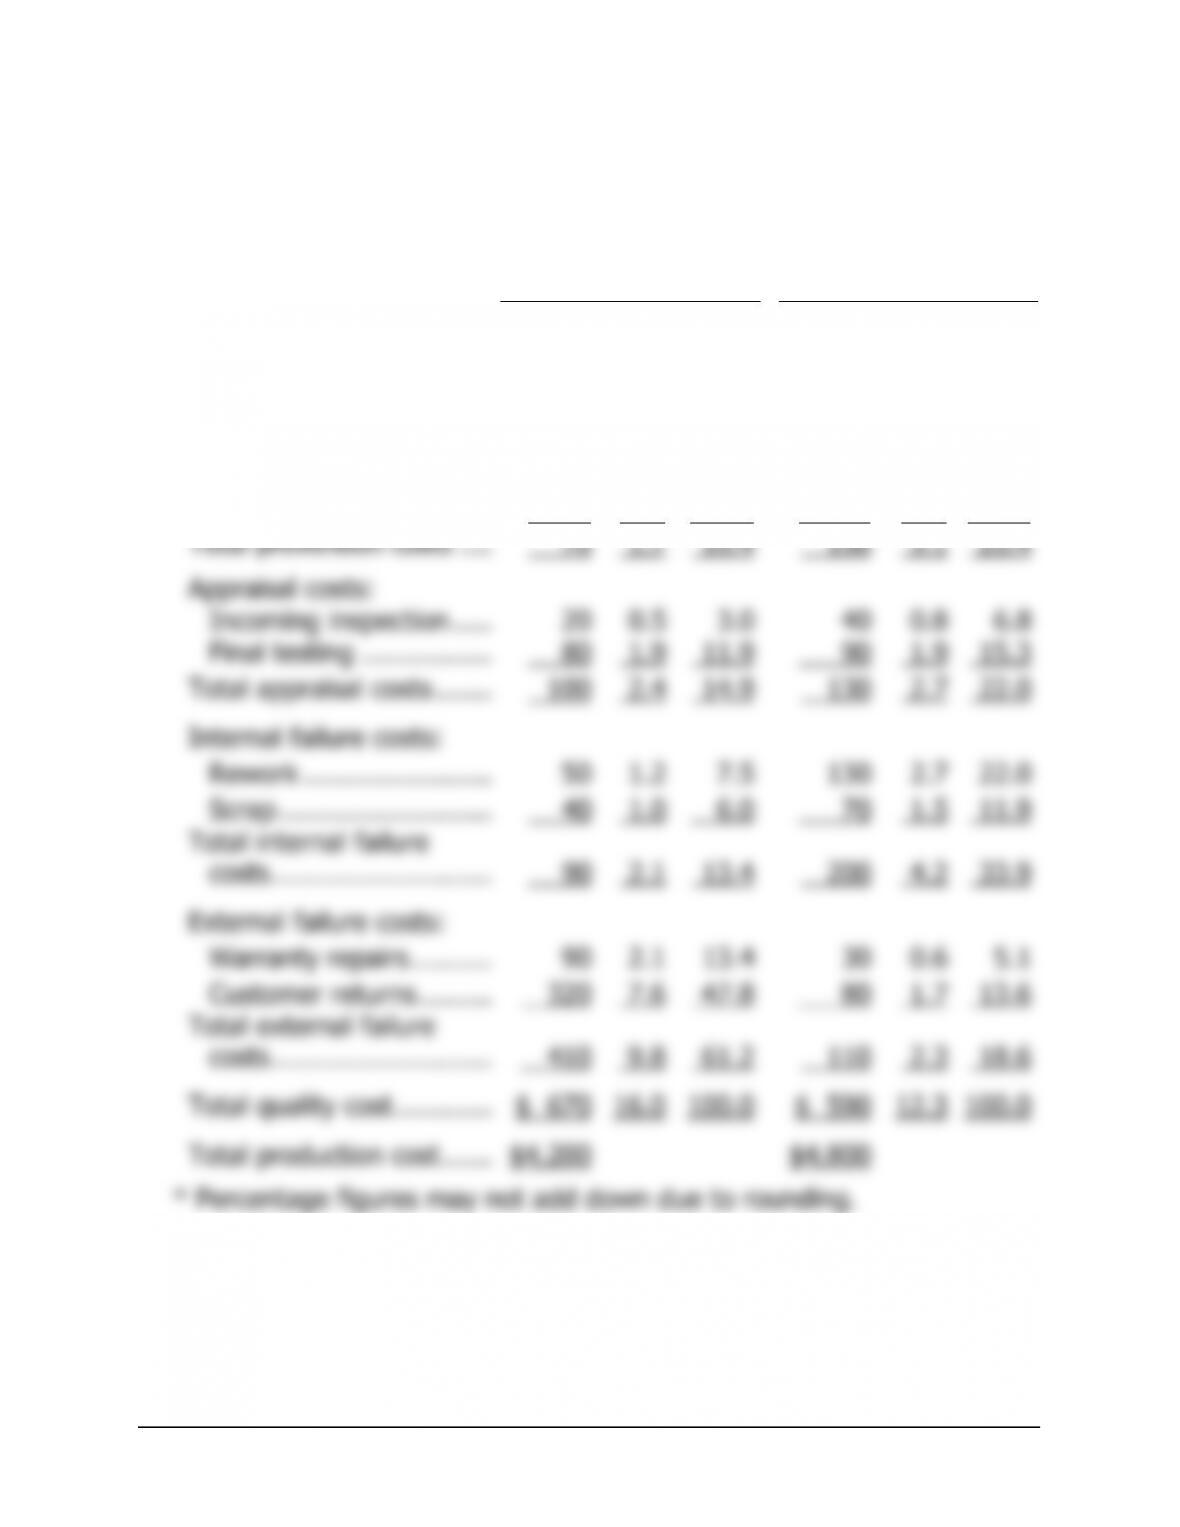
1. An analysis of the company’s quality cost report is presented below
(dollar amounts are in thousands):
Last Year This Year
Amount Percent*
A
moun
t
Percent*
Prevention costs:
Machine maintenance .. $ 70 1.7 10.4 $ 120 2.5 20.3
T
rainin
g
suppliers …….. 0 0.0 0.0 10 0.2 1.7
Quality
circles …………………..
…………………………. 0 0.0 0.0 20 0.4 3.4
T
T
T
A
© The McGraw-Hill Companies, Inc., 2018. All rights reserved.
56 Managerial Accounting, 16th Edition
Problem 1A-3 (continued)
From the above analysis it would appear that Mercury, Inc.’s program has
been successful.
Total quality costs have declined from 16.0% to 12.3% as a
External failure costs, those costs signaling customer dissatisfaction,
have declined from 9.8% of total production costs to 2.3%. These
Appraisal costs have increased from 2.4% to 2.7% of total
Internal failure costs have increased from 2.1% to 4.2% of
production costs. This increase has probably resulted from the
Prevention costs have increased from 1.7% of total production cost
2. The initial effect of emphasizing prevention and appraisal was to reduce
external failure costs and increase internal failure costs. The increase in
appraisal activities resulted in catching more defective units before they
3. To measure the cost of not implementing the quality program,
management could assume that sales and market share would continue
to decline and then calculate the lost profit. Or, management might
© The McGraw-Hill Companies, Inc., 2018. All rights reserved.
Solutions Manual, Appendix 1A 57
Problem 1A-4 (60 minutes)
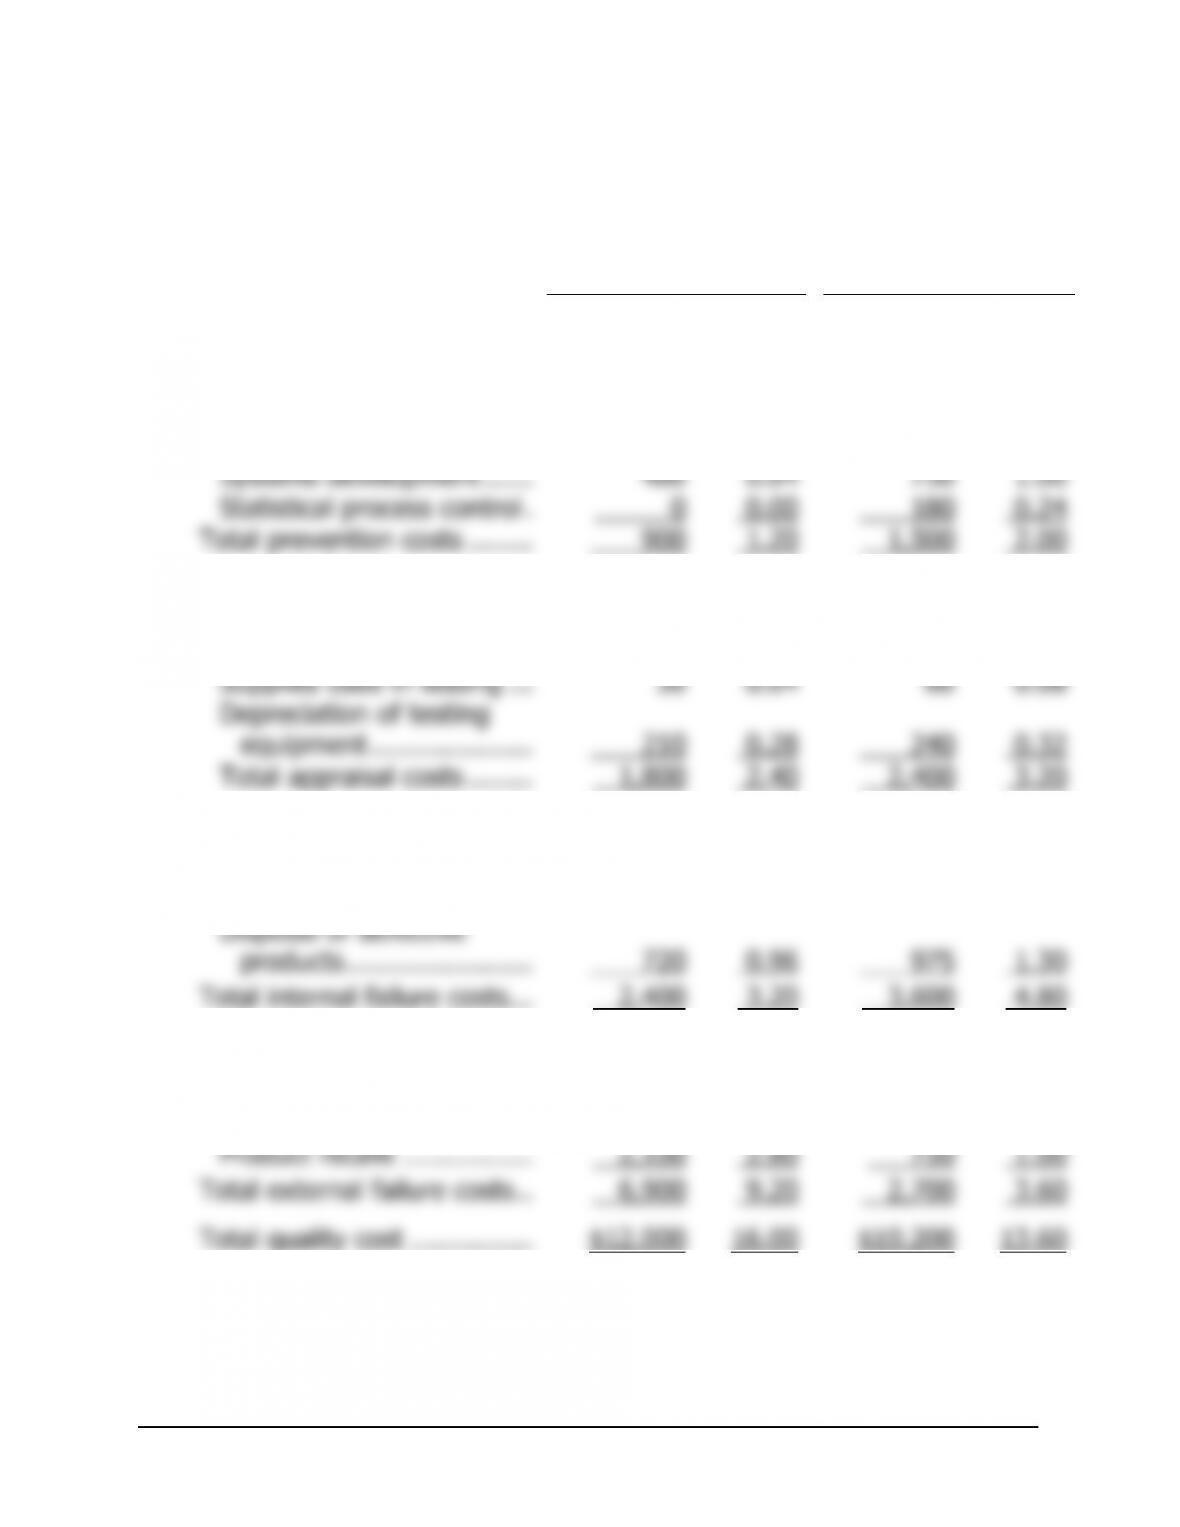
1. Florex Company
Quality Cost Report
Last Year This Year
Amount
(in
thousands)
Percent
of Sales
Amount
(in
thousands)
Percent
of Sales
Prevention costs:
Quality en
g
ineerin
g
………. $ 420 0.56 $ 570 0.76
A
ppraisal costs
Inspection ………………….. 750 1.00 900 1.20
Product testin
g
……………. 810 1.08 1,200 1.60
Supplies used in testin
g
… 30 0.04 60 0.08
Depreciation of testin
g
equipment ……………….. 210 0.28 240 0.32
T
Internal failure costs:
Net cost of scrap …………. 630 0.84 1,125 1.50
Rework labor ………………. 1,050 1.40 1,500 2.00
External failure costs:
Cost of field servicing ……. 1,200 1.60 900 1.20
Warranty repairs …………. 3,600 4.80 1,050 1.40
T
© The McGraw-Hill Companies, Inc., 2018. All rights reserved.
58 Managerial Accounting, 16th Edition
Problem 1A-4 (continued)
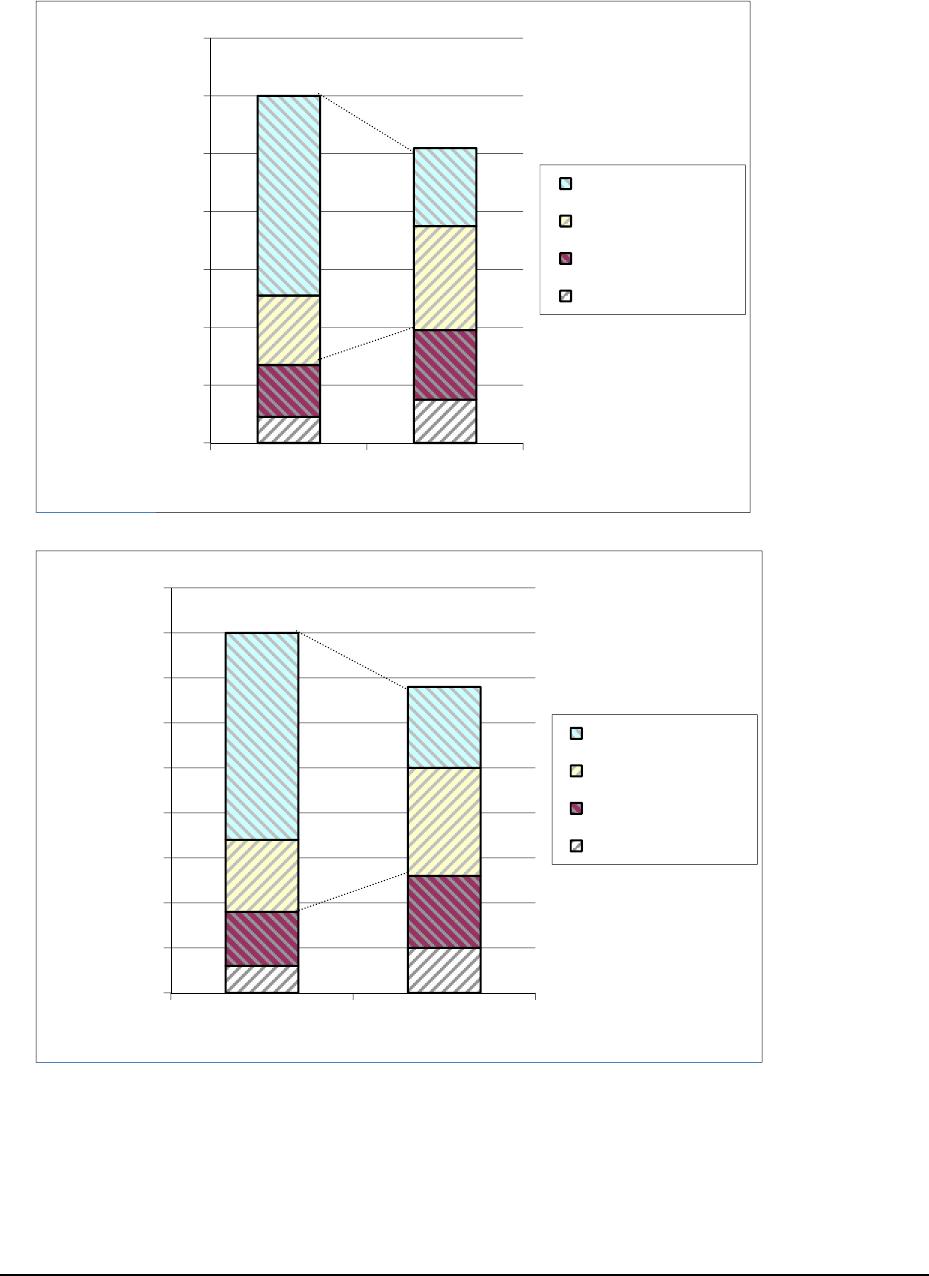
2.
$0
$2,000
$4,000
$6,000
$8,000
$10,000
$12,000
$14,000
Last Year This Year
Quality Costs (in thousands)
External Failure
Internal Failure
Appraisal
Prevention
0%
2%
4%
6%
8%
10%
12%
14%
16%
18%
Last Year This Year
Quality Costs as a Percentage of
Sales
External Failure
Internal Failure
Appraisal
Prevention
© The McGraw-Hill Companies, Inc., 2018. All rights reserved.
Solutions Manual, Appendix 1A 59
Problem 1A-4 (continued)
3. The overall impact of the company’s increased emphasis on quality over
the past year has been positive in that total quality costs have
decreased from 16% of sales to 13.6% of sales. Despite this
improvement, the company still has a poor distribution of quality costs.
Probably due to the increased spending on prevention and appraisal
activities during the past year, internal failure costs have increased by
one half, going from $2.4 million to $3.6 million. The reason internal
failure costs have gone up is that, through increased appraisal activity,
If the company continues its emphasis on prevention and appraisal—
and particularly on prevention—its total quality costs should continue to
decrease in future years. Although internal failure costs are increasing