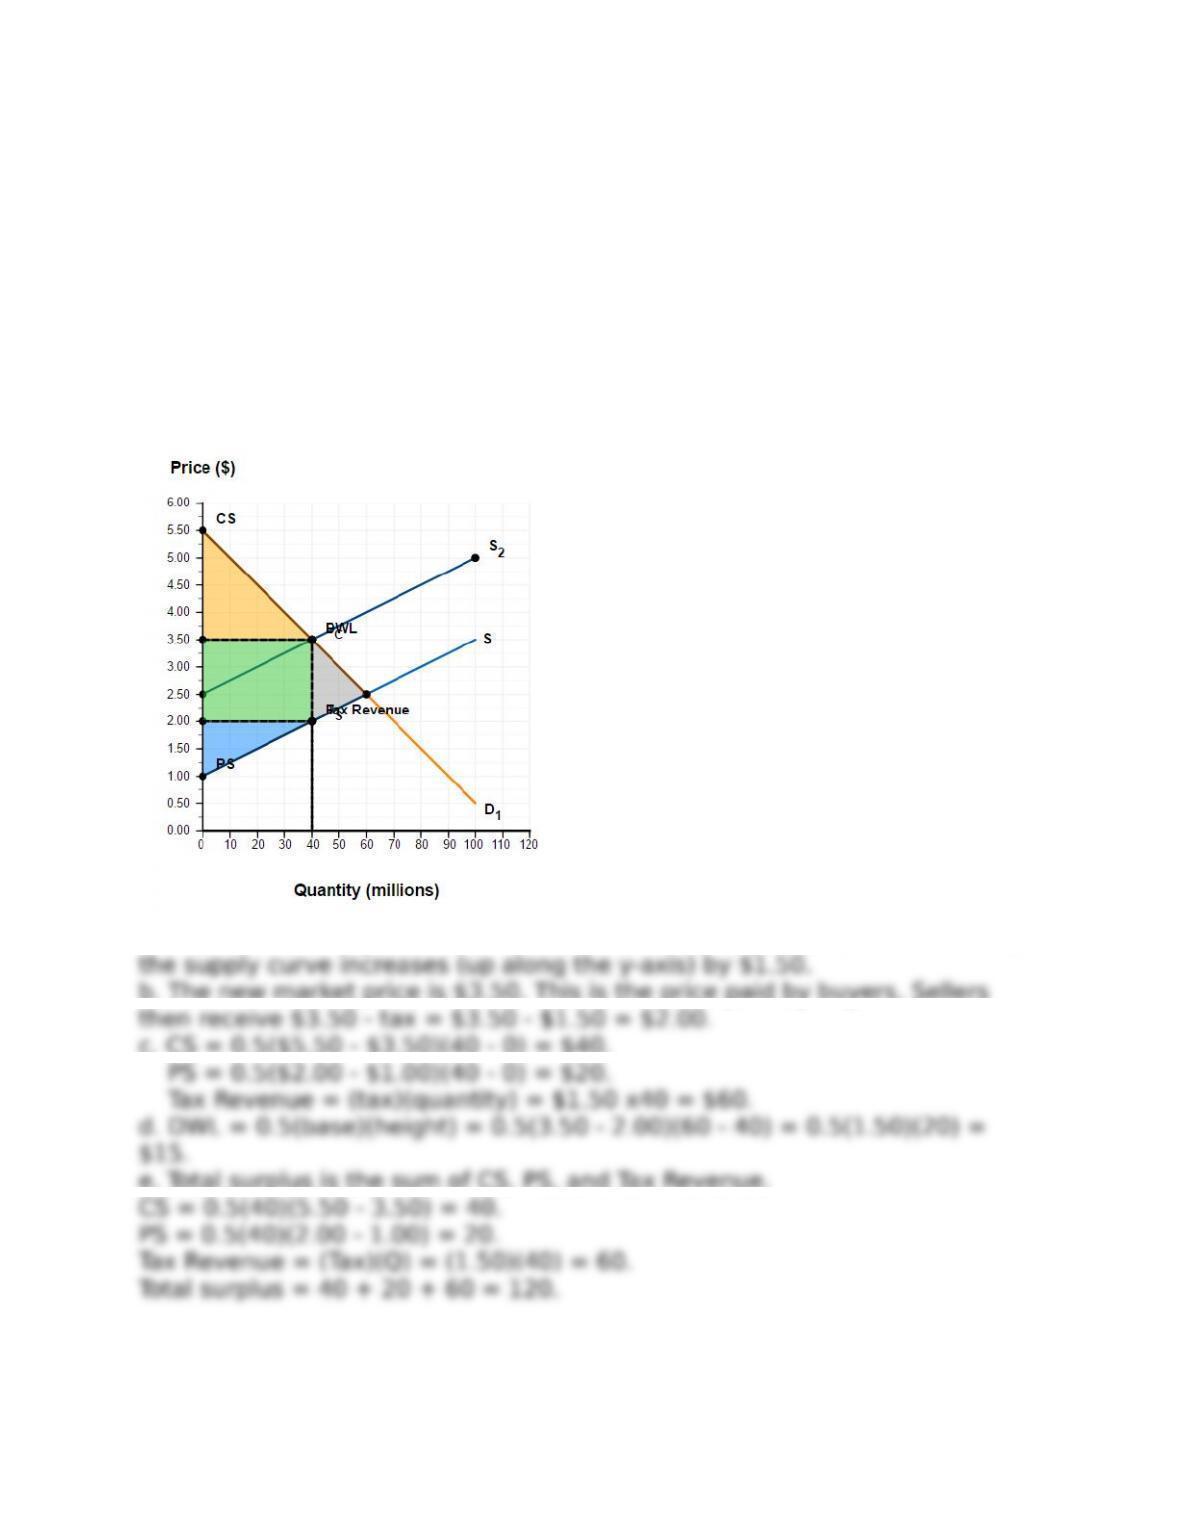
9. The market shown in Figure 6P-6 is in equilibrium. Suppose there is a
$1.50 per unit tax levied on sellers. [LO 6.3]
a. Draw the after-tax supply curve.
b. Plot the after-tax price paid by consumers and the after-tax price paid by
sellers.
c. Draw consumer surplus, producer surplus, tax revenue, and deadweight
loss after the tax.
d. Calculate deadweight loss.
e. Calculate total surplus.
Answer:
a. Each unit of the good is now $1.50 more costly to produce and sell. Thus,
b. The new market price is $3.50. This is the price paid by buyers. Sellers
c. CS = 0.5($5.50 – $3.50)(40 – 0) = $40.
e. Total surplus is the sum of CS, PS, and Tax Revenue.
10. Suppose the government is considering taxing cigarettes. Because it is
often politically more popular to tax the producers of cigarettes than the
consumers of cigarettes, the government first considers the impact on the
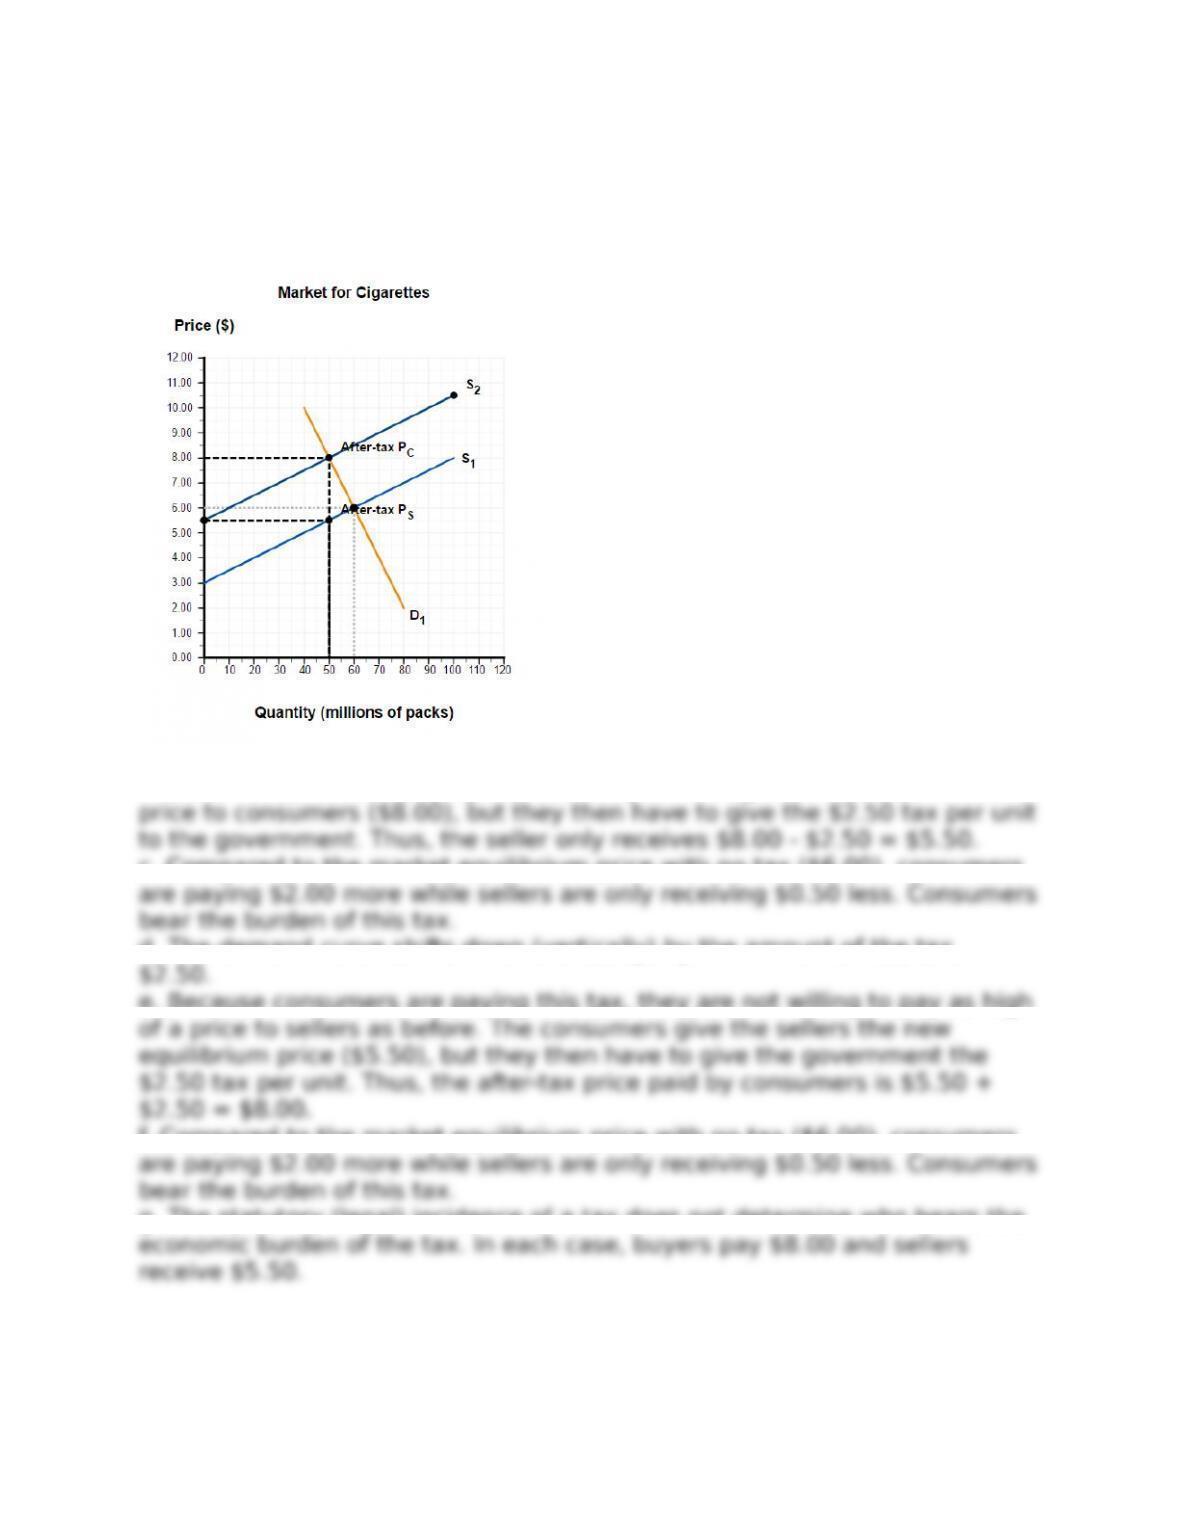
market as a result of taxing the producers of cigarettes. Figure 6P-7 shows
the market in equilibrium. [LO 6.3]
Answer:
a. The supply curve shifts up (vertically) by the amount of the tax, $2.50.
b. Because sellers are paying this tax, they will charge the new equilibrium
c. Compared to the market equilibrium price with no tax ($6.00), consumers
d. The demand curve shifts down (vertically) by the amount of the tax,
e. Because consumers are paying this tax, they are not willing to pay as high
f. Compared to the market equilibrium price with no tax ($6.00), consumers
g. The statutory (legal) incidence of a tax does not determine who bears the
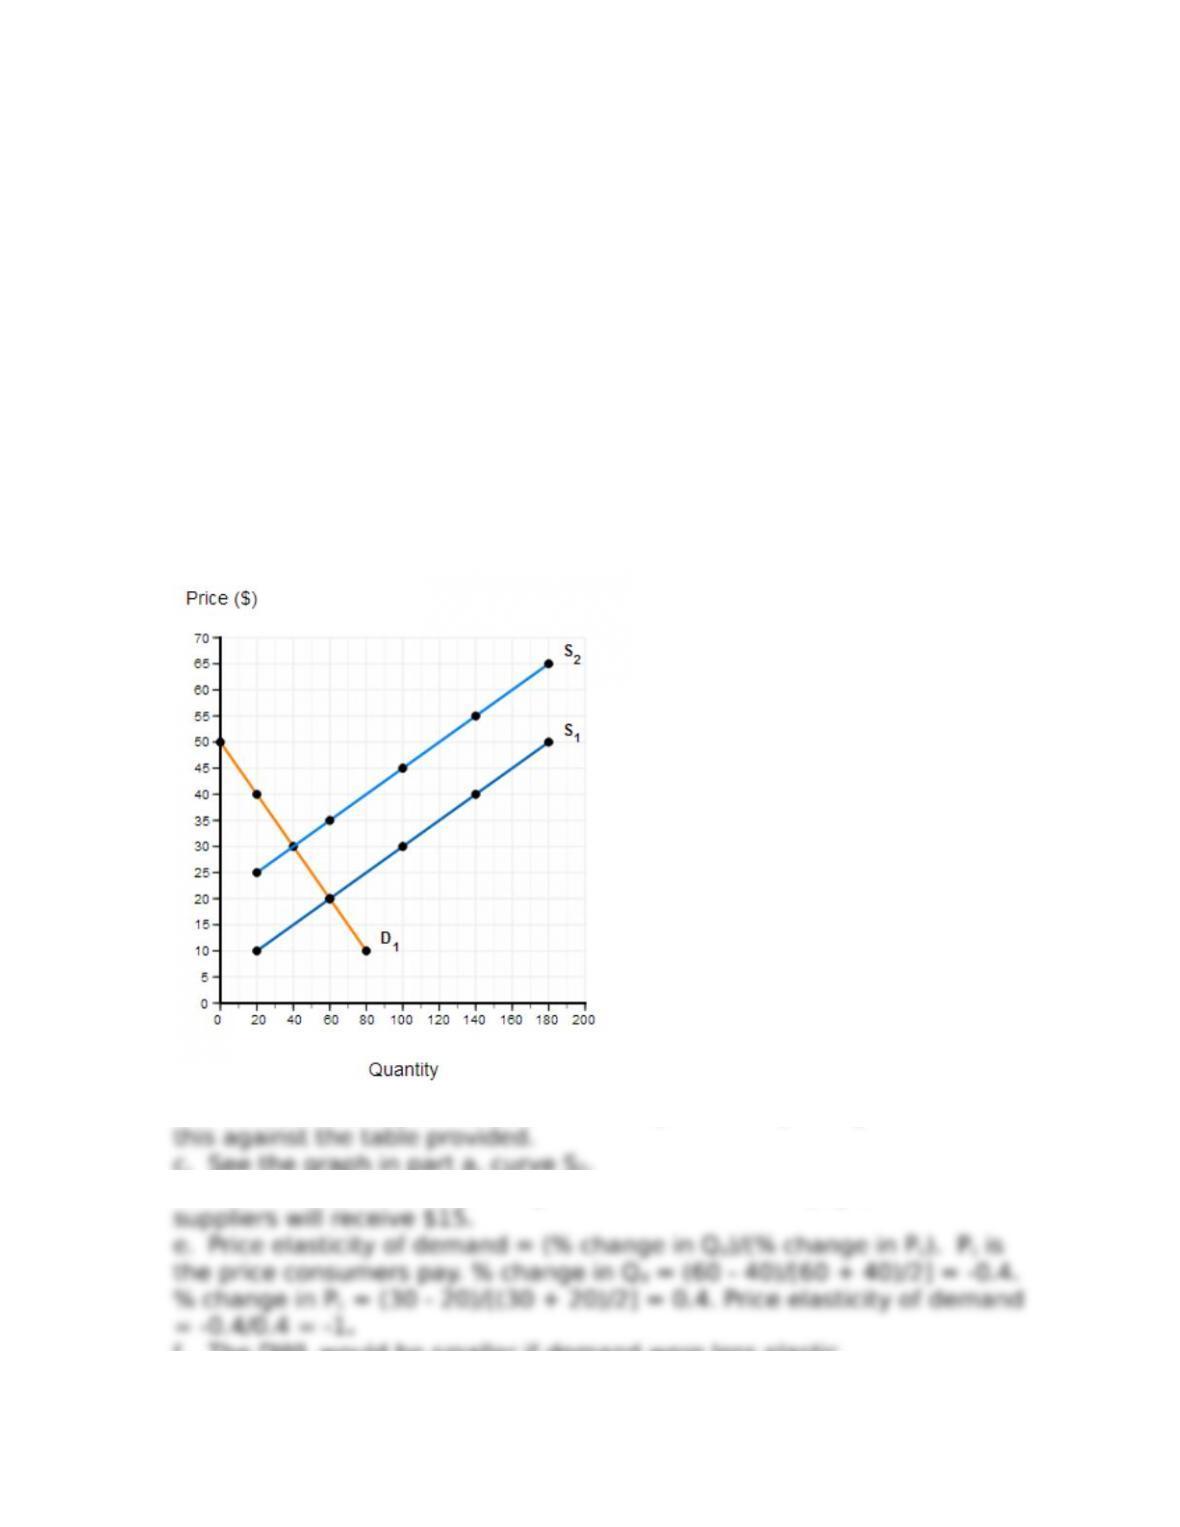
11. Suppose you have the information shown in Table 6P-2 about the
quantity of a good that is supplied and demanded at various prices. [LO
6.3], [LO 6.5]
a. Plot the demand and supply curves on a graph, with price on the y-axis
and quantity on the x -axis.
b. What are the equilibrium price and quantity?
c. Suppose the government imposes a $15 per unit tax on sellers of this
good. Draw the new supply curve on your graph.
d. What is the new equilibrium quantity? How much will consumers pay?
How much will sellers receive after the tax?
e. Calculate the price elasticity of demand over this price change.
f. If demand were less elastic (holding supply constant), would the
deadweight loss be smaller or larger?
Answer:
a. See graph below, curve S1.
b. The equilibrium price is $20 and the equilibrium quantity is 60. Check
c. See the graph in part a, curve S2.
d. The new equilibrium quantity is 40. Consumers will pay $30 and
f. The DWL would be smaller if demand were less elastic.
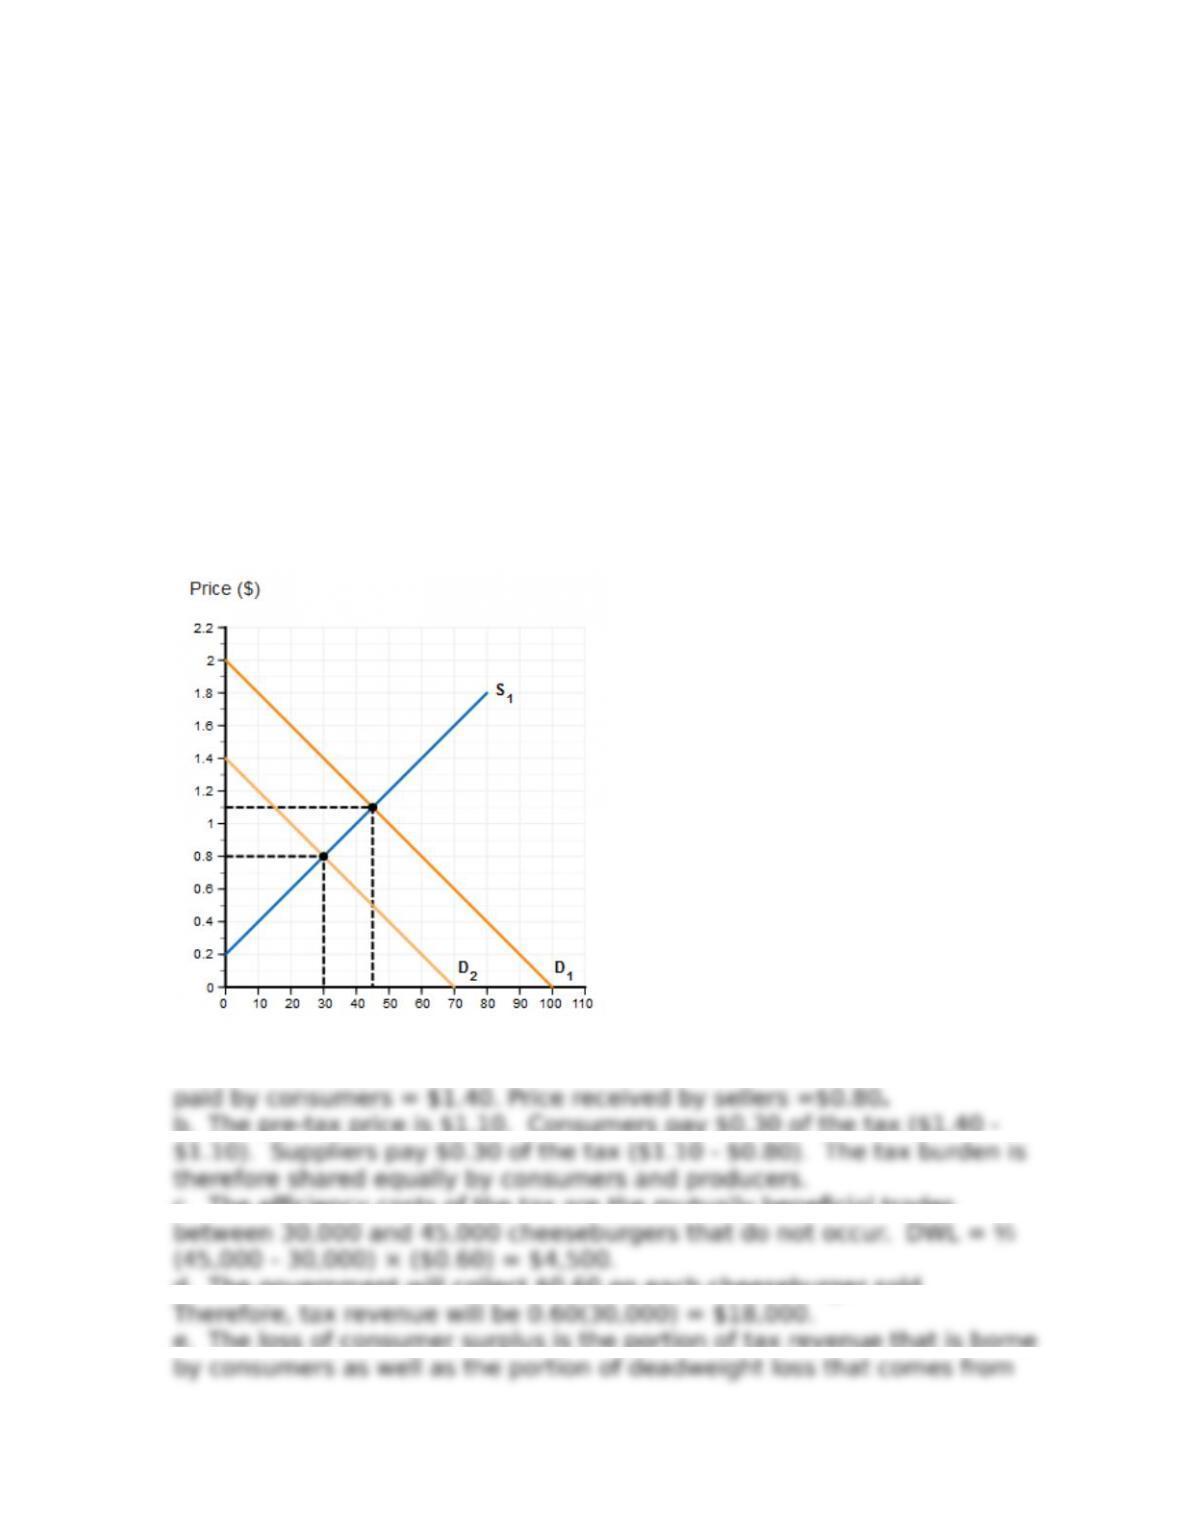
12. The weekly supply and demand for fast-food cheeseburgers in your
city is shown in Figure 6P-8. In an effort to curb a looming budget deficit, the
mayor recently proposed a tax that would be levied on sales at fast-food
restaurants. [LO 6.3]
a. The mayor’s proposal includes a sales tax of 60 cents on cheeseburgers,
to be paid by consumers. What is the new outcome in this market (how many
cheeseburgers are sold and at what price)? Illustrate this outcome on your
graph.
b. How much of the tax burden is borne by consumers? How much by
suppliers?
c. What is the deadweight loss associated with the proposed tax?
d. How much revenue will the government collect?
e. What is the loss of consumer surplus from this tax?
Answer:
a. Quantity supplied and demanded with the tax = 30 thousand. Price
b. The pre-tax price is $1.10. Consumers pay $0.30 of the tax ($1.40 –
c. The eBciency costs of the tax are the mutually beneficial trades
d. The government will collect $0.60 on each cheeseburger sold.
e. The loss of consumer surplus is the portion of tax revenue that is borne

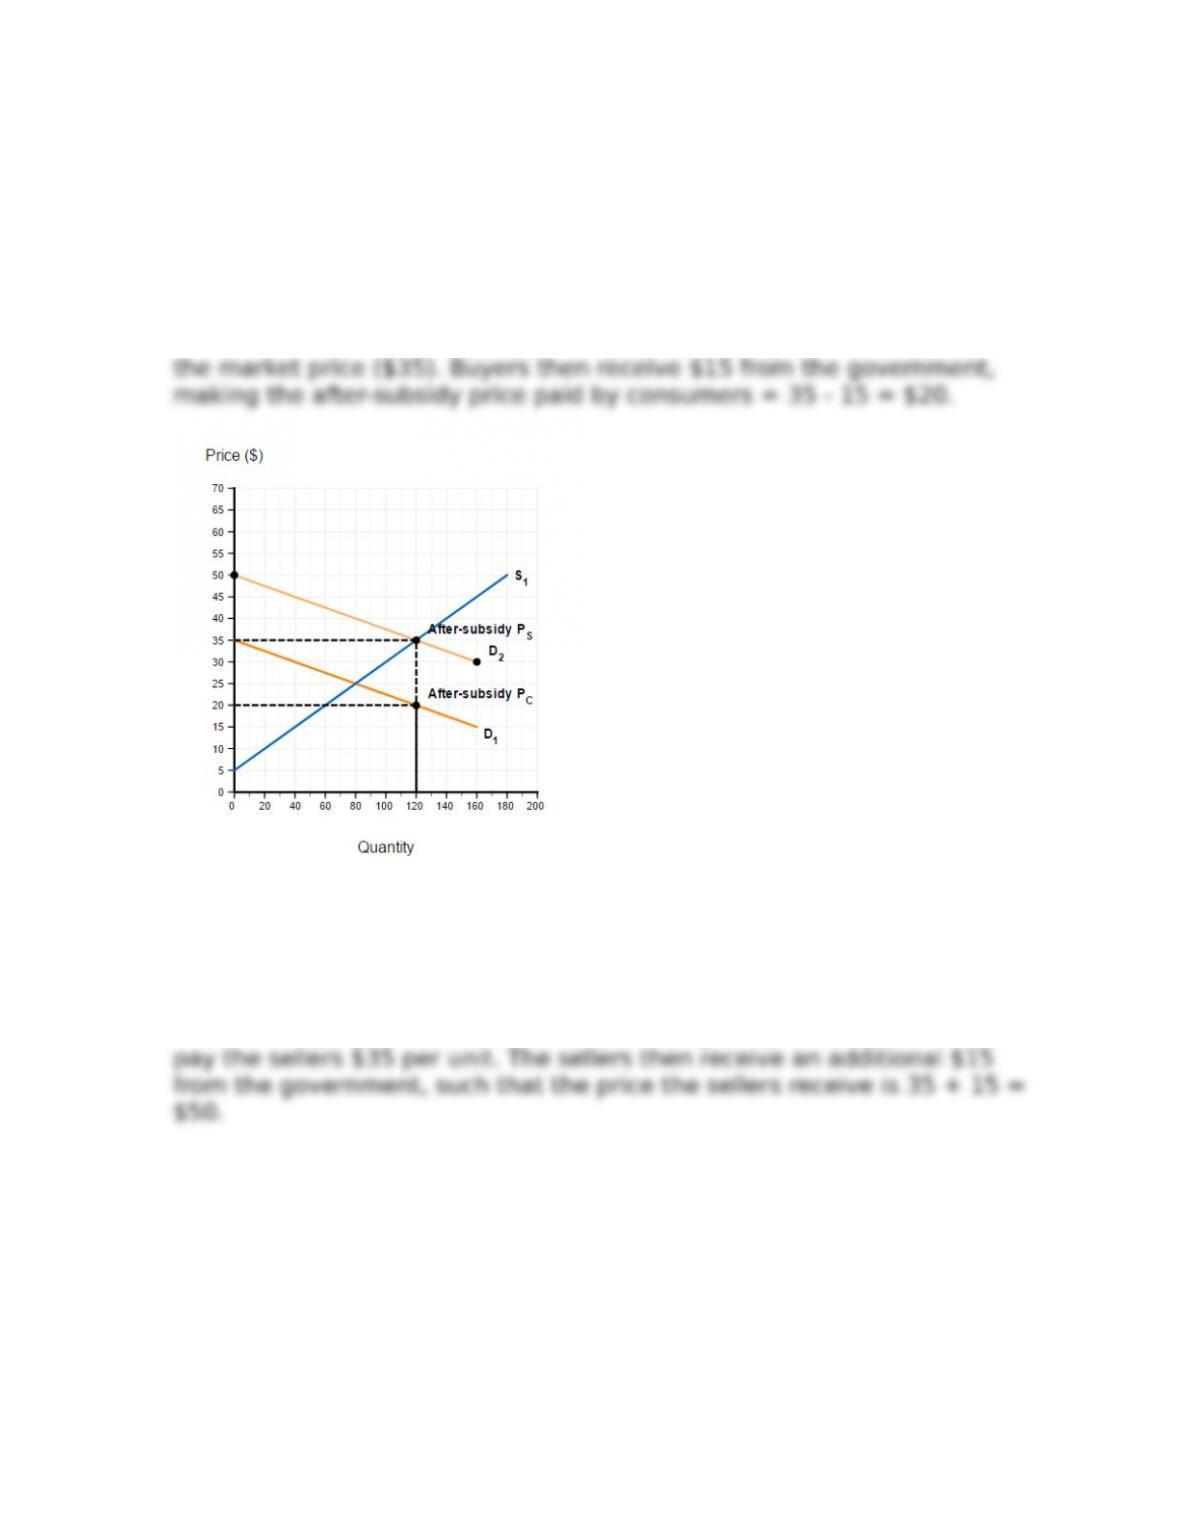
13. The market shown in Figure 6P-9 is in equilibrium. Suppose there is a $15
per unit subsidy given to buyers. [LO 6.4]
a. Draw the after-subsidy demand curve.
b. Plot the after-subsidy price paid by consumers and the after-subsidy price
paid by sellers.
Answer: Each unit of the good is now $15 less expensive to buy. Thus,
the demand curve increases (up along the y-axis) by $15. Sellers receive
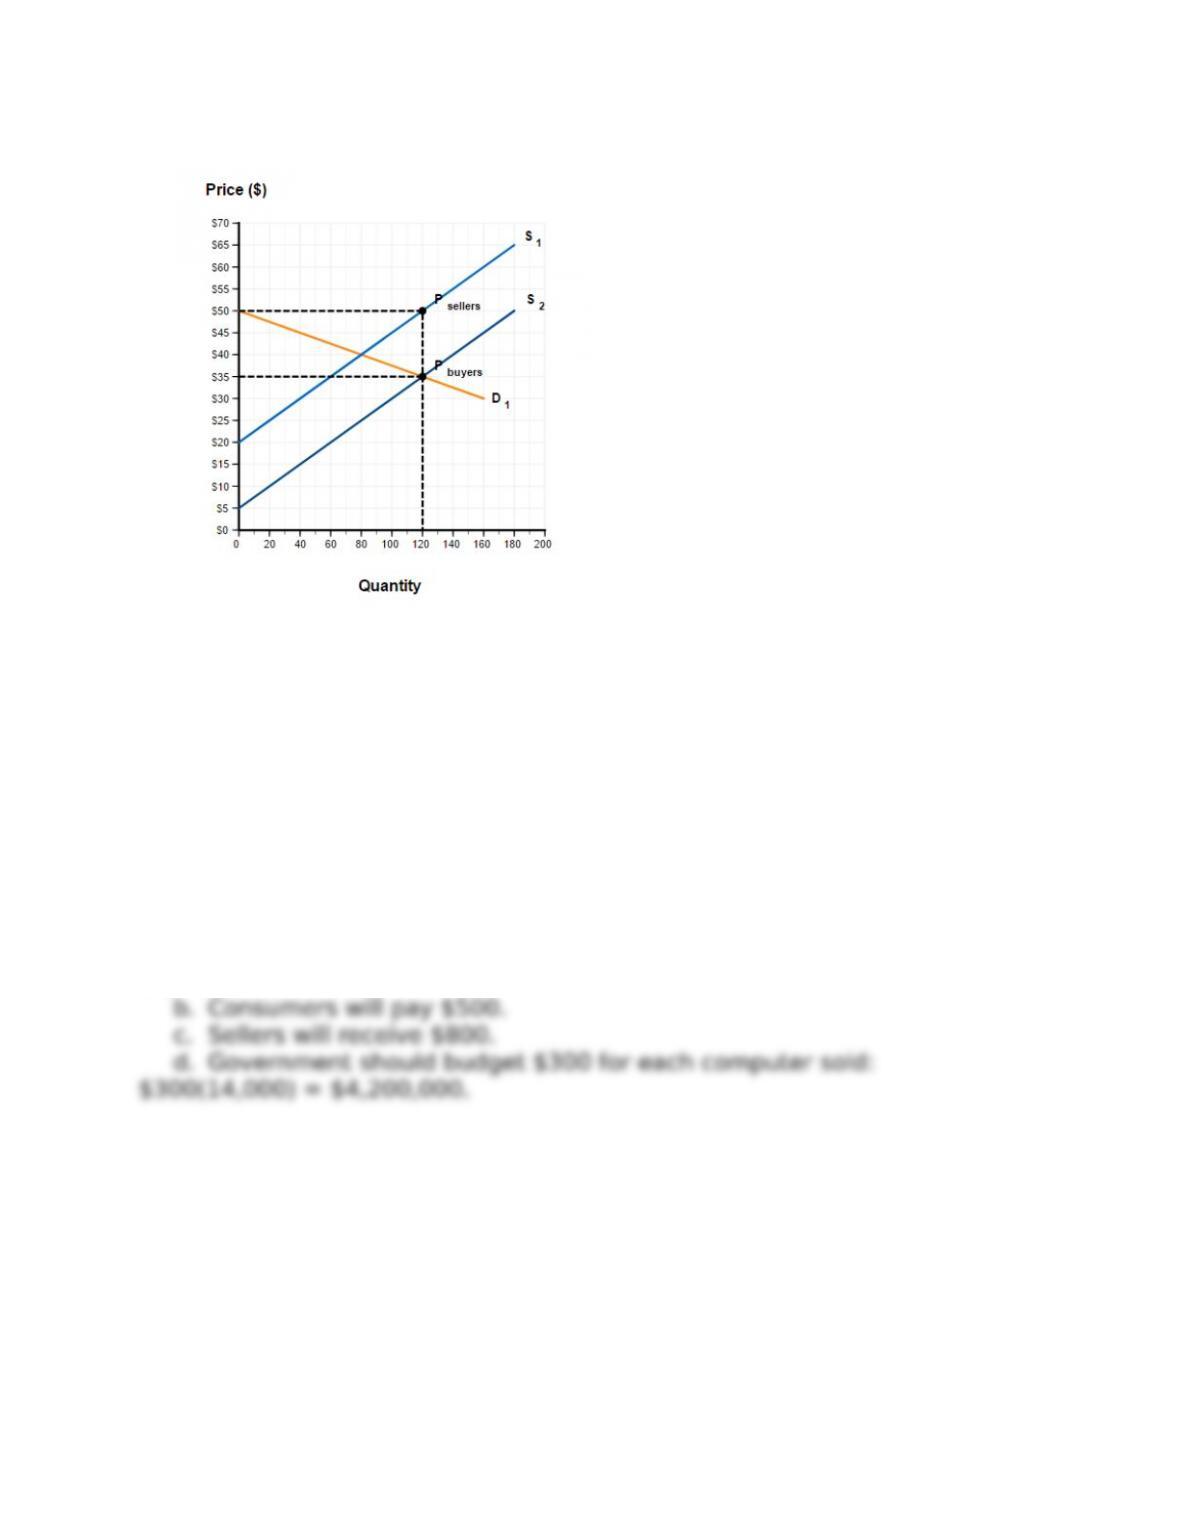
14. The market shown in Figure 6P-10 is in equilibrium. Suppose there is a
$15 per unit subsidy given to sellers. [LO 6.4]
Answer: Each unit of the good is now $15 cheaper to produce and sell.
Thus, the supply curve decreases (down along the y-axis) by $15. Buyers
15. Demand and supply of laptop computers are given in Figure 6P-11. The
quantity of laptops is given in thousands. Suppose the government provides
a $300 subsidy for every laptop computer that consumers purchase. [LO
6.4]
a. What will be the quantity of laptops bought and sold at the new
equilibrium?
b. What will be the price consumers pay for laptops under the subsidy?
c. What will be the price that sellers receive for laptops under the subsidy?
d. How much money should the government budget for the subsidy?
Answer:
a. The quantity of laptops bought and sold at the new equilibrium is
14,000.
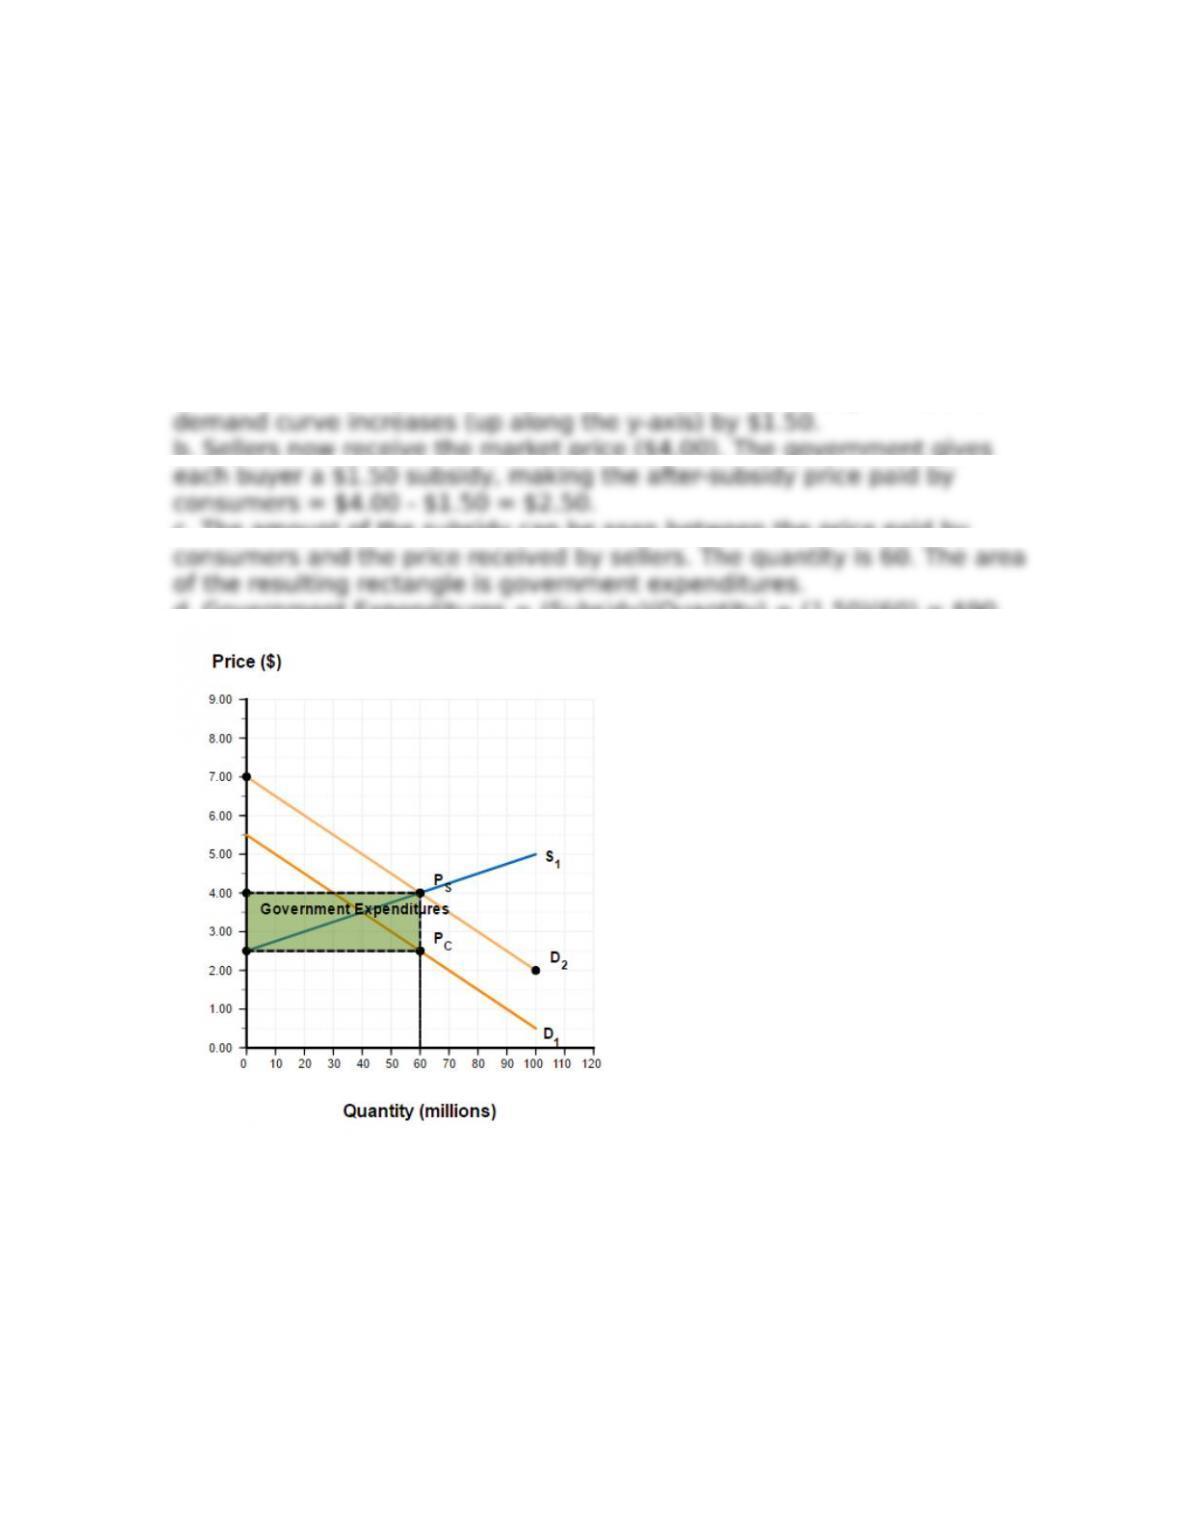
16. The market shown in Figure 6P-12 is in equilibrium. Suppose there is a
$1.50 per unit subsidy given to buyers. [LO 6.4]
a. Draw the after-subsidy demand curve.
b. Plot the after-subsidy price paid by consumers and the after-subsidy price
paid by sellers.
c. Draw government expenditures for the subsidy.
d. Calculate government expenditures.
Answer:
a. Each unit of the good is now $1.50 less expensive to buy. Thus, the
b. Sellers now receive the market price ($4.00). The government gives
c. The amount of the subsidy can be seen between the price paid by
d. Government Expenditures = (Subsidy)(Quantity) = (1.50)(60) = $90.
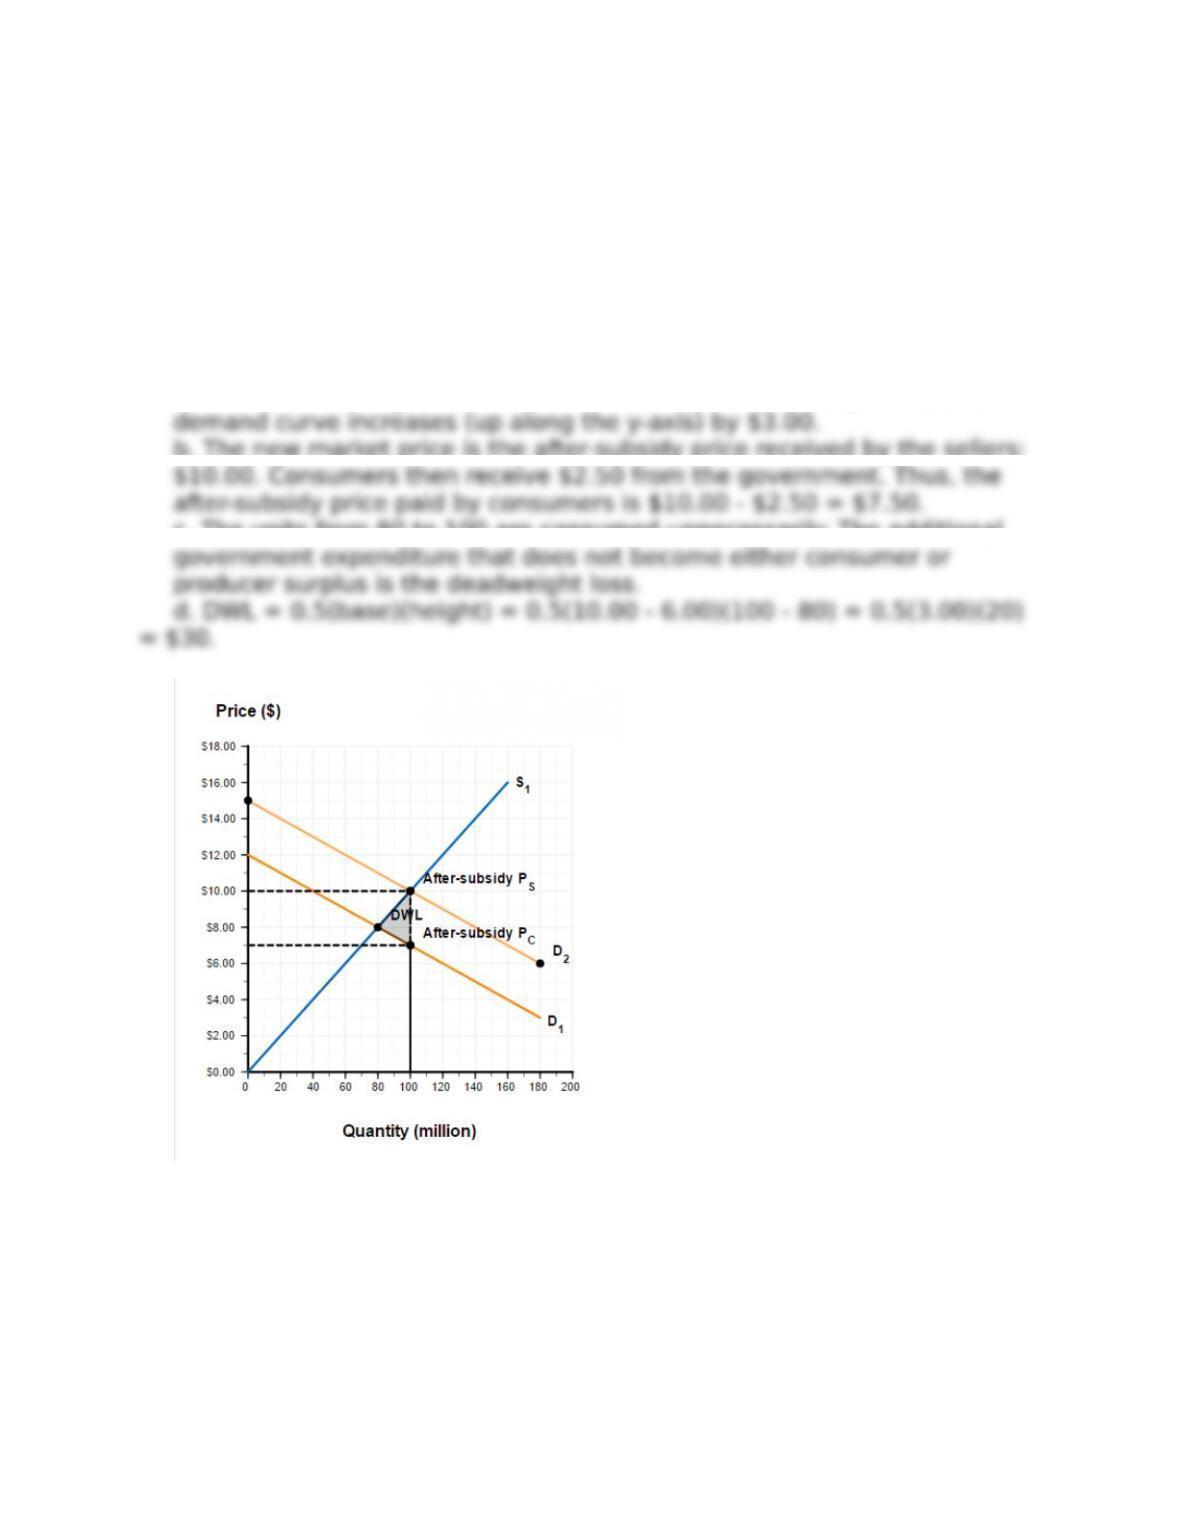
17. The market shown in Figure 6P-13 is in equilibrium. Suppose there is a $3
per unit subsidy given to buyers. [LO 6.4]
a. Draw the after-subsidy demand curve.
b. Plot the after-subsidy price paid by consumers and the after-subsidy price
paid by sellers.
c. Draw the deadweight loss after the subsidy.
d. Calculate deadweight loss.
Answer:
a. Each unit of the good is now $3.00 less expensive to buy. Thus, the
b. The new market price is the after-subsidy price received by the sellers:
c. The units from 80 to 100 are consumed unnecessarily. The additional
18. Suppose government offer a subsidy to laptop sellers. Say whether
each group of people gains or loses from this policy. [LO 6.4]
a. Laptop buyers.
b. Laptop sellers.
c. Desktop computer sellers (assuming that they are di@erent from laptop
manufacturers).
d. Desktop computer buyers.
Answer:
a. Gain: The subsidy will lower the price consumers pay.
b. Gain: The subsidy will increase the price sellers receive.
19. Suppose that for health reasons, the government of the nation of Ironia
wants to increase the amount of broccoli citizens consume. Which of the
following policies could be used to achieve the goal? [LO 6.1], [LO 6.4]
a. A price Ioor to support broccoli growers.
b. A price ceiling to ensure that broccoli remains a@ordable to consumers.
c. A subsidy paid to shoppers who buy broccoli.
d. A subsidy paid to farmers who grow broccoli.
Answer: C and D. Price controls will reduce the quantity traded in a
market. A price ceiling will mean that quantity demanded is greater than
20. The following scenarios describe the price elasticity of supply and
demand for a particular good. In which scenario will a subsidy increase
consumption the most? Choose only one. [LO 6.5]
a. Elastic demand, inelastic supply.
b. Inelastic demand, inelastic supply.
c. Elastic demand, elastic supply.
d. Inelastic demand, elastic supply.
Answer: C. Quantity will change the most when both supply and demand
are elastic. With elastic demand, consumers will respond more to price
21. The market shown in Figure 6P-14 is in equilibrium. [LO 6.5]
a. If a tax was imposed on this market, would buyers or sellers bear more of
the burden of the tax? Why?
Answer: If a tax was imposed on this market, buyers would bear more of
the tax burden because the demand curve is more elastic than the supply
22. The following scenarios describe the price elasticity of supply and
demand for a particular good. All else equal (equilibrium price, equilibrium
quantity, and size of the tax), in which scenario will government revenues be
the highest? Choose only one. [LO 6.5]
a. Elastic demand, inelastic supply.
b. Inelastic demand, inelastic supply.
c. Elastic demand, elastic supply.
d. Inelastic demand, elastic supply.
Answer: B. All else equal, the government will raise more revenue taxing
goods that are inelastically supplied and demanded. Inelastic supply and