Chapter 05 – Efficiency
4. Based on Table 5P-1, calculate consumer surplus for each consumer when
the price is $17. What is the total consumer surplus at this price? [LO 5.2]
Answer:
Consumer A: $0 (WTP < $17).
Consumer B: $10 ($27 – $17 = $10).
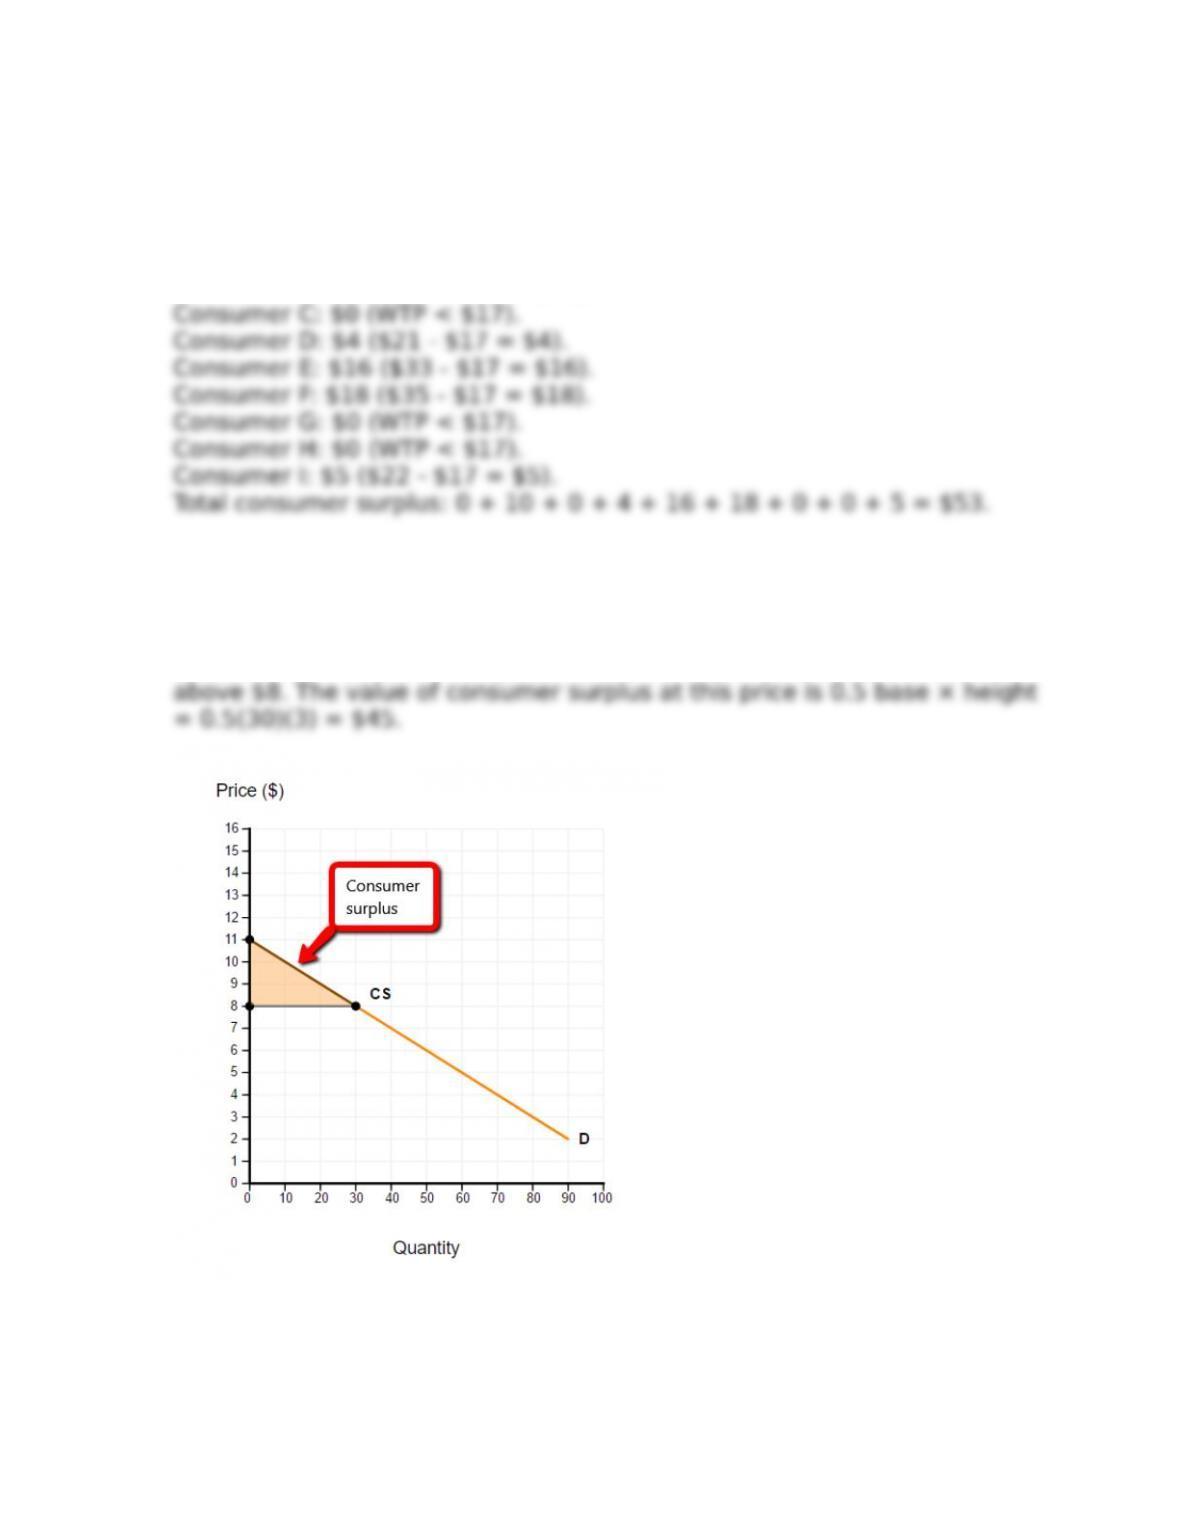
5. Use the demand curve represented in Figure 5P-1 to draw the consumer
surplus when the market price is $8. What is the value of consumer surplus
at this price? [LO 5.2]
Answer: The consumer surplus is the area under the demand curve and
5-1
Copyright © 2018 McGraw-Hill Education. All rights reserved. No reproduction or distribution without the prior written consent of McGraw-Hill
Education.
Chapter 05 – Efficiency
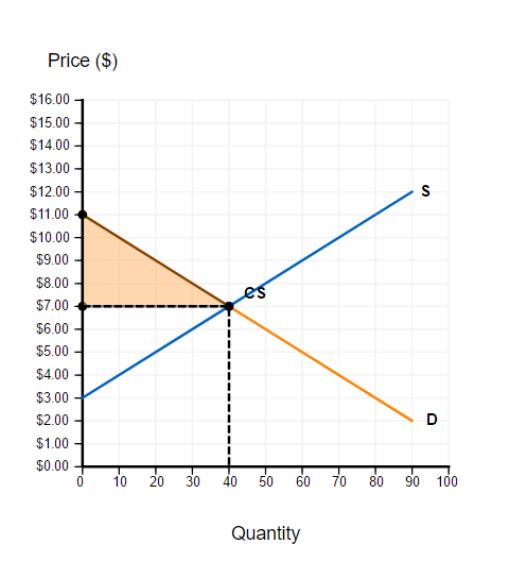
6. Based on Figure 5P-2, consumer surplus is $0 when price is greater than
or equal to what price? [LO 5.2]
Answer: Consumer surplus is $0 when price is ≥ $11.
7. Use the market represented in Figure 5P-2 to plot the equilibrium price
and quantity and to draw the consumer surplus when the market is in
equilibrium. What is the value of consumer surplus at the equilibrium price?
[LO 5.2]
Answer: The equilibrium price is $7. The consumer surplus is the area
under the demand curve and above $7. The value of consumer surplus at
this price is 0.5 base × height = 0.5(40)(4) = $80.
5-2
Copyright © 2018 McGraw-Hill Education. All rights reserved. No reproduction or distribution without the prior written consent of McGraw-Hill
Education.
Chapter 05 – Efficiency
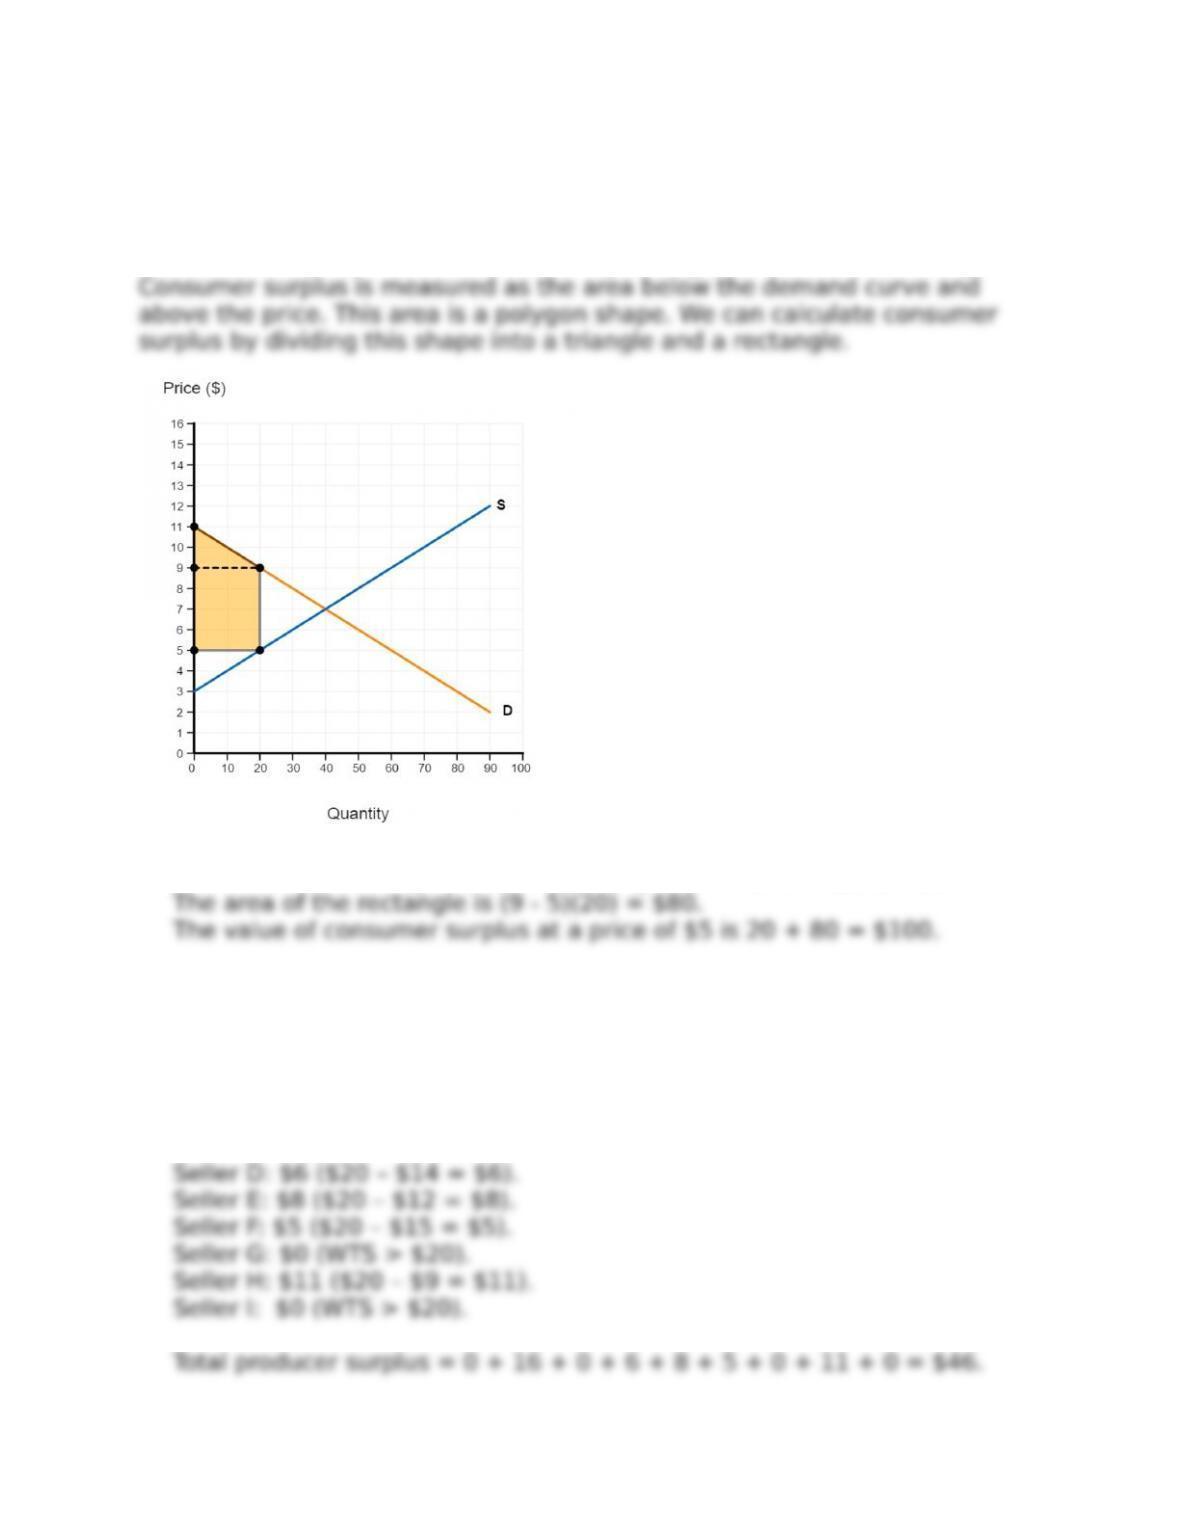
8. Use the market represented in Figure 5P-2 to draw the consumer surplus
when the price is $5. What is the value of consumer surplus at this price?
[LO 5.2]
Answer: At a price of $5, sellers are only willing to sell 20 units of the good.
The area of the triangle is 0.5(base)(height) = 0.5(11 – 9)(20) = $20.
9. Based on Table 5P-6, calculate producer surplus for each producer when
the price is $20. What is total producer surplus at this price? [LO 5.3]
Answer:
Seller A: $0 (WTS > $20).
Seller B: $16 ($20 – $4 = $16).
Seller C: $0 (WTS > $20).
5-3
Copyright © 2018 McGraw-Hill Education. All rights reserved. No reproduction or distribution without the prior written consent of McGraw-Hill
Education.
Chapter 05 – Efficiency
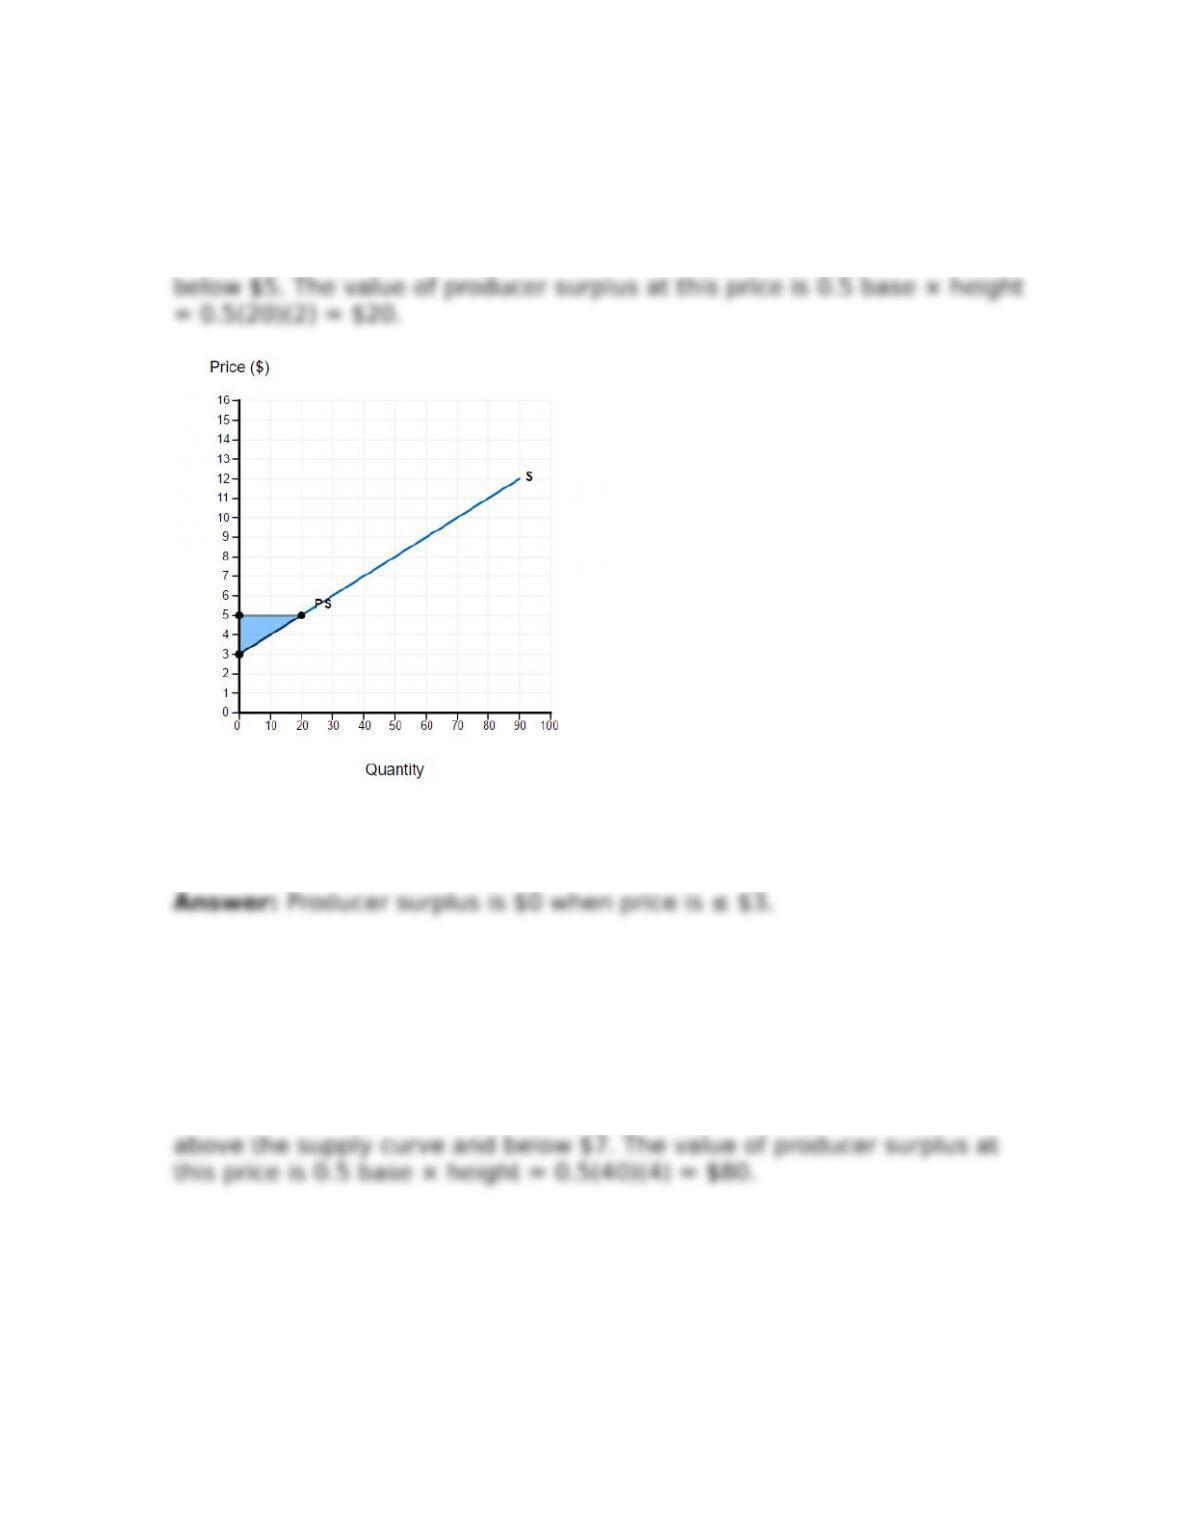
10. Use the supply curve represented in Figure 5P-3 to draw the producer
surplus when the market price is $5. What is the value of producer surplus at
this price? [LO 5.3]
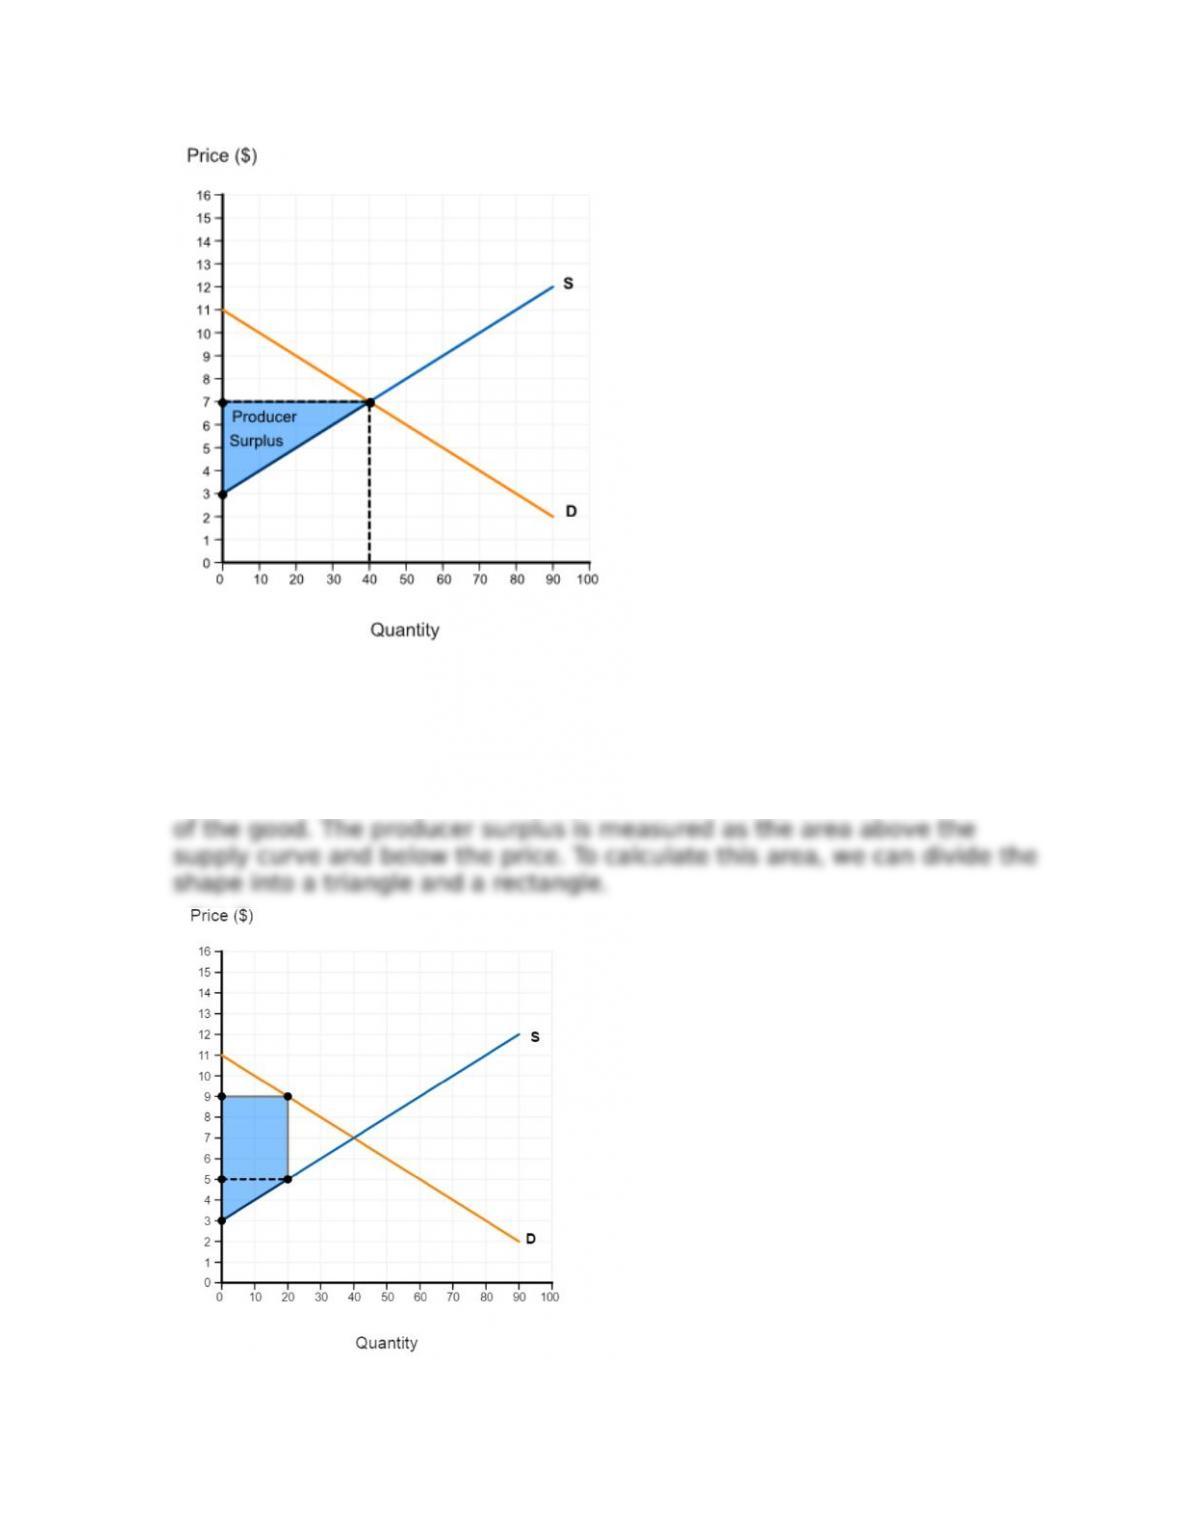
Answer: The producer surplus is the area above the supply curve and
11. Based on Figure 5P-2, producer surplus is $0 when price is less than or
equal to what price? [LO 5.3]
12. Use the market represented in Figure 5P-2 to plot the equilibrium price
and quantity and to draw the producer surplus when the market is in
equilibrium. What is the value of producer surplus at the equilibrium price?
[LO 5.3]
Answer: The equilibrium price is $7. The producer surplus is the area
5-4
Copyright © 2018 McGraw-Hill Education. All rights reserved. No reproduction or distribution without the prior written consent of McGraw-Hill
Education.
Chapter 05 – Efficiency
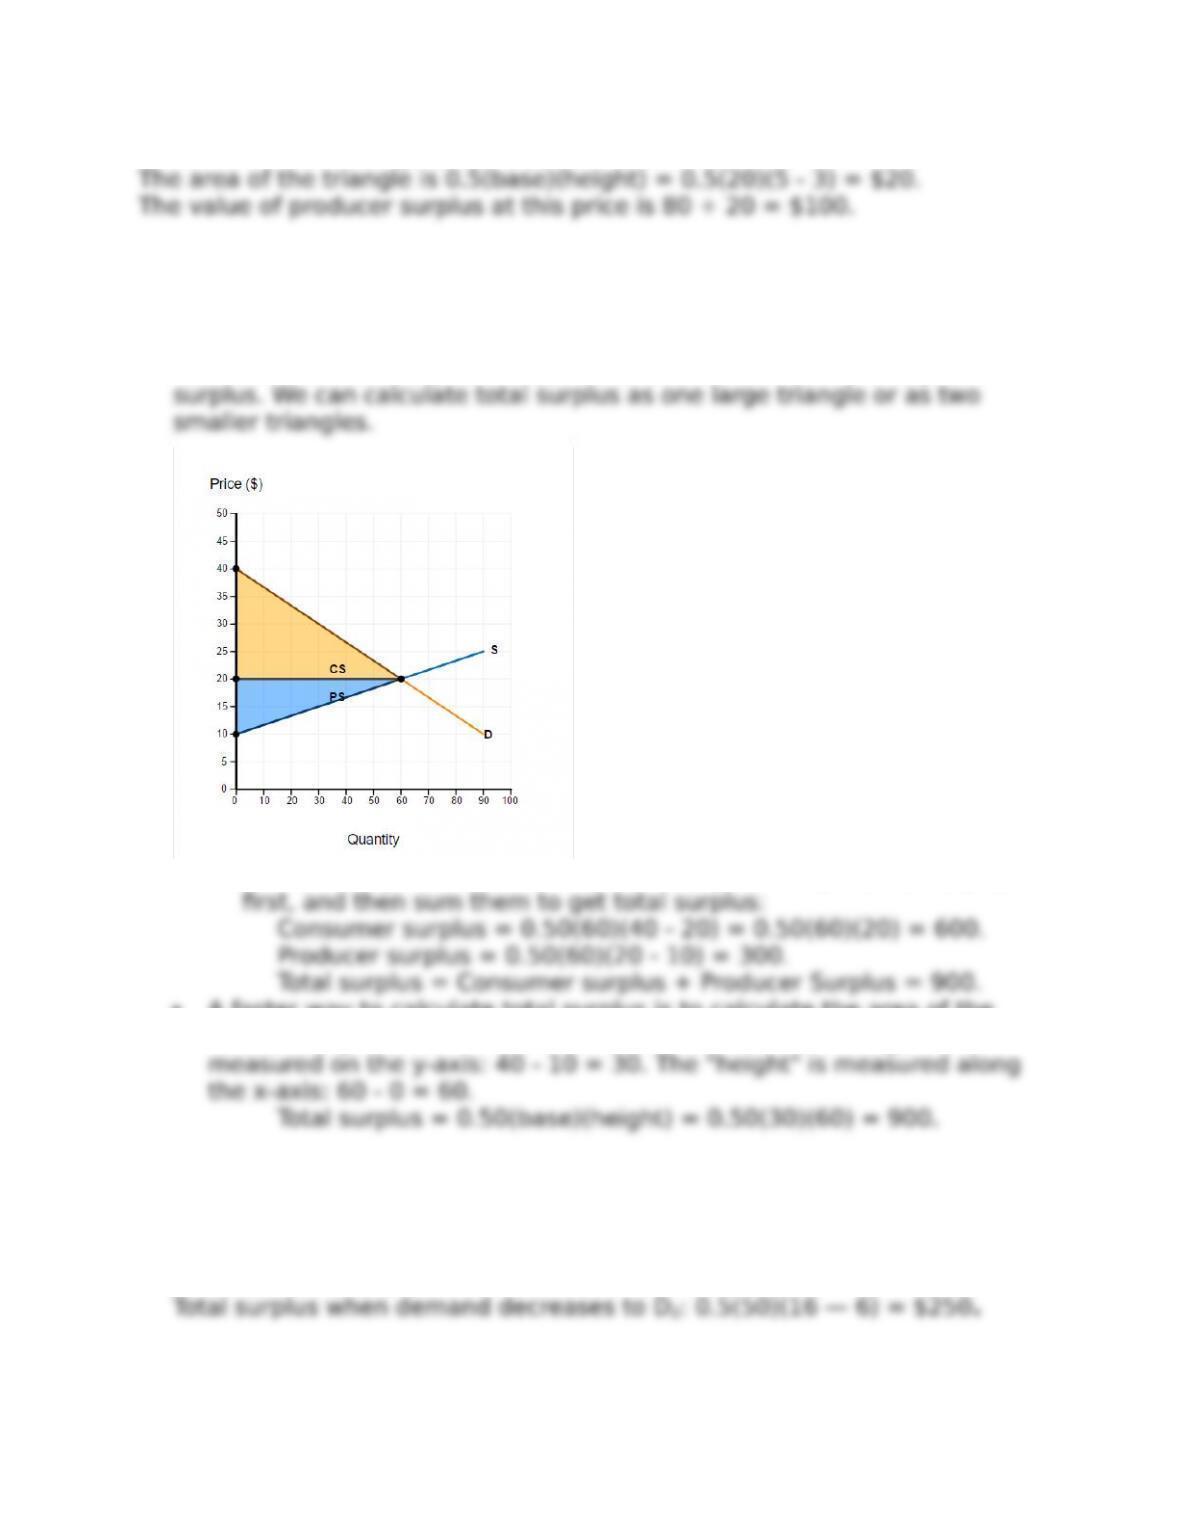
13. Use the market represented in Figure 5P-2 to draw the producer
surplus if the price is $9. What is the value of producer surplus at this price?
[LO 5.3]
Answer: At a price of $9, consumers are only willing to purchase 20 units
5-5
Copyright © 2018 McGraw-Hill Education. All rights reserved. No reproduction or distribution without the prior written consent of McGraw-Hill
Education.
Chapter 05 – Efficiency
The area of the rectangle is (9 – 5)(20) = $80
14. Use the market represented in Figure 5P-4 to draw the consumer and
producer surplus when the market is in equilibrium. What is the value of total
surplus at equilibrium? [LO 5.4]
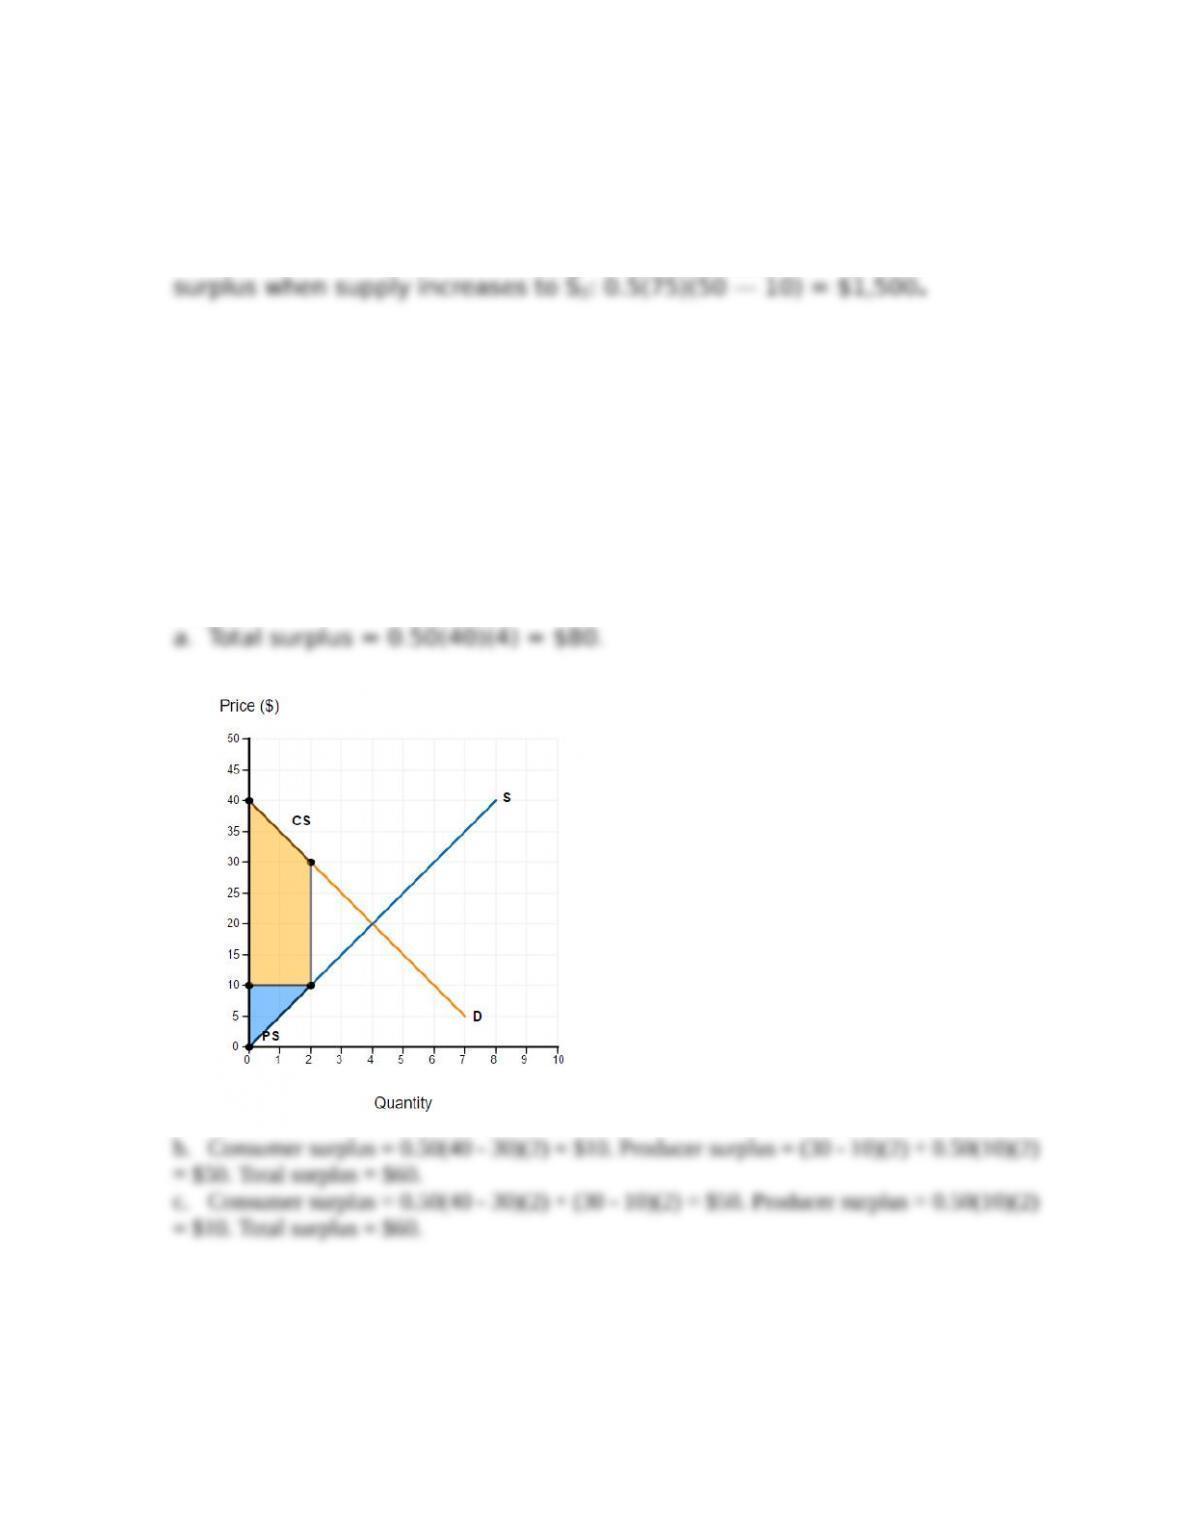
Answer: The total surplus is equal to the sum of consumer and producer
As two triangles, calculate consumer surplus and producer surplus
A faster way to calculate total surplus is to calculate the area of the
entire triangle at once. In this case, the “base” of the triangle is
15. Consider the market represented in Figure 5P-5. [LO 5.4]
a. Calculate total surplus when demand is D1.
b. Calculate total surplus when demand decreases to D2.
Answer: Total surplus when demand is D1: 0.5(100)(22 — 6) = $800.
5-6
Copyright © 2018 McGraw-Hill Education. All rights reserved. No reproduction or distribution without the prior written consent of McGraw-Hill
Education.
Chapter 05 – Efficiency
16. Consider the market represented in Figure 5P-6. [LO 5.4]
a. Calculate total surplus when supply is S1.
b. Calculate total surplus when supply increases to S2.
Answer: Total surplus when supply is S1: 0.5(50)(50 — 20) = $750. Total
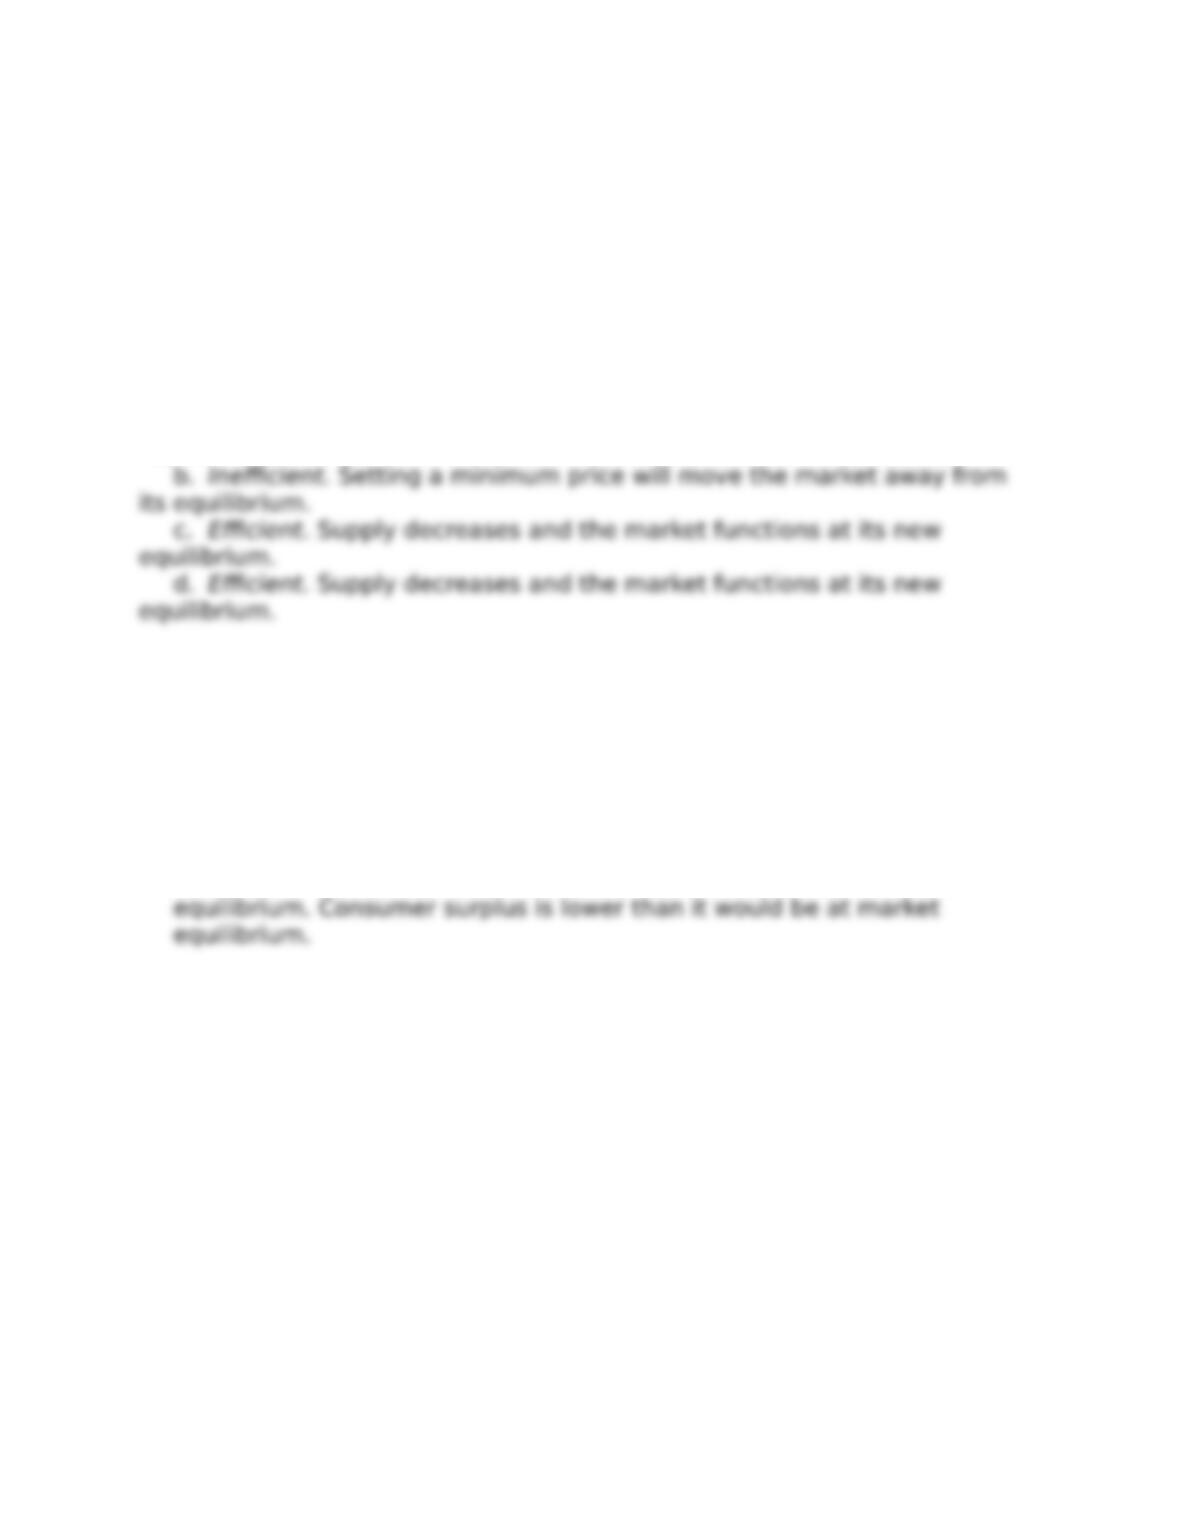
17. Consider the market represented in Figure 5P-7. [LO 5.5]
a. Draw the consumer surplus and the producer surplus at the equilibrium
price and quantity. What is the value of total surplus at equilibrium?
b. Draw the consumer surplus and the producer surplus if the price is $30.
What are the values of consumer surplus, producer surplus, and total surplus
at this price?
c. Draw the consumer surplus and the producer surplus if the price is
$10. What are the values of consumer surplus, producer surplus, and total
surplus at this price?
Answer:
5-7
Copyright © 2018 McGraw-Hill Education. All rights reserved. No reproduction or distribution without the prior written consent of McGraw-Hill
Education.
Chapter 05 – Efficiency
18. Assume the market for wine is functioning at its equilibrium. For each
of the following situations, say whether the new market outcome will be
eEcient or ineEcient. [LO 5.5]
a. A new report shows that wine is good for heart health.
b. The government sets a minimum price for wine, which increases the
current price.
c. An unexpected late frost ruins large crops of grapes.
d. Grape pickers demand higher wages, increasing the price of wine.
Answer:
a. Efficient. Demand increases and the market functions at its new
equilibrium.
19. Based on Figure 5P-8, choose all of the following options that are true.
[LO 5.5, 5.6]
a. The market is eEcient.
b. Total surplus is higher than it would be at market equilibrium.
c. Total surplus is lower than it would be at market equilibrium.
d. Producer surplus is lower than it would be at market equilibrium.
e. Consumer surplus is lower than it would be at market equilibrium.
Answer: C and E. Total surplus is lower than it would be at market
20. In which of the following situations can you say, without further
information, that consumer surplus decreases relative to the market
equilibrium level? [LO 5.6]
a. Your state passes a law that pushes the interest rate (i.e., the price) for
payday loans below the equilibrium rate.
b. The federal government enforces a law that raises the price of dairy
goods above the equilibrium.
c. Your city passes a local property tax, under which buyers of new houses
have to pay an additional 5 percent on top of the purchase price.
d. The government lowers the eGective price of food purchases through a
food-stamp program.
Answer: B and C. The federal government enforces a law that raises the
price of dairy goods above the equilibrium. Your city passes a local
5-8
Copyright © 2018 McGraw-Hill Education. All rights reserved. No reproduction or distribution without the prior written consent of McGraw-Hill
Education.

Chapter 05 – Efficiency
5-9
Copyright © 2018 McGraw-Hill Education. All rights reserved. No reproduction or distribution without the prior written consent of McGraw-Hill
Education.
Chapter 05 – Efficiency
21. Use the areas labeled in the market represented in Figure 5P-9 to
answer the following questions. [LO 5.6]
a. What area(s) are consumer surplus at the market equilibrium price?
b. What area(s) are producer surplus at the market equilibrium price?
c. Compared to the equilibrium, what area(s) do consumers lose if price is P2?
d. Compared to the equilibrium, what area(s) do producers lose if the price is
P2?
e. Compared to the equilibrium, what area(s) do producers gain if the price is
P2?
f. Compared to the equilibrium, total surplus decreases by what area(s) if the
price is P2?
Answer:
a. A, B, C.
22. Figure 5P-10 shows a market for cotton, with the price held at $0.80
per pound. Calculate the dead-weight loss caused by this policy. [LO 5.7]
Answer: Deadweight loss = 0.5(30/100)(20m) = $3 million
23. Consider the market represented in Figure 5P-11. [LO 5.7]
Answer:
a. The equilibrium price would be $20, but the price cannot be lower than
24. What is the value of the existence of the market represented in Figure 5P-
12. [LO 5.8]
5-10
Copyright © 2018 McGraw-Hill Education. All rights reserved. No reproduction or distribution without the prior written consent of McGraw-Hill
Education.
Chapter 05 – Efficiency
25. We can consider the market for traveling to Mars to be missing,
because no technology exists that allows this service to be bought and sold.
Suppose that someone has invented space-travel technology that will enable
this service to be provided. Figure 5P-13 shows the estimated market for
trips to Mars. Calculate the surplus that could be generated by Alling in this
missing market. [LO 5.8]
Answer: Since the market does not currently exist, the surplus gained
5-11
Copyright © 2018 McGraw-Hill Education. All rights reserved. No reproduction or distribution without the prior written consent of McGraw-Hill
Education.