Chapter 03 – Markets
Problems and Applications
1. Consider shopping for cucumbers in a farmers’ market. For each
statement below, note which characteristic of competitive markets the
statement describes. Choose from: standardized good, full information, no
transaction costs, and participants are price takers. [LO 3.1]
a. All of the farmers have their prices posted prominently in front of their
stalls.
b. Cucumbers are the same price at each stall.
c. There is no di”culty moving around between stalls as you shop and
choosing between farmers.
d. You and the other customers all seem indifferent about which
cucumbers to buy.
Answer: A standardized good is a good for which any two units have the
same features and are interchangeable. In a competitive market, you
have full information about the price and features of the good being
a. Full information.
2. Suppose two artists are selling paintings for the same price in adjacent
booths at an art fair. By the end of the day, one artist has nearly sold out of
her paintings while the other artist has sold nothing. Which characteristic of
competitive markets has not been met and best explains this outcome? [LO
3.1]
a. Standardized good.
b. Full information.
c. No transaction costs.
d. Participants are price takers.
Answer: A standardized good is a good for which any two units have the
same features and are interchangeable. In a competitive market, you
have full information about the price and features of the good being
3-1
Copyright © 2018 McGraw-Hill Education. All rights reserved. No reproduction or distribution without the prior written consent of McGraw-Hill
Education.
Chapter 03 – Markets
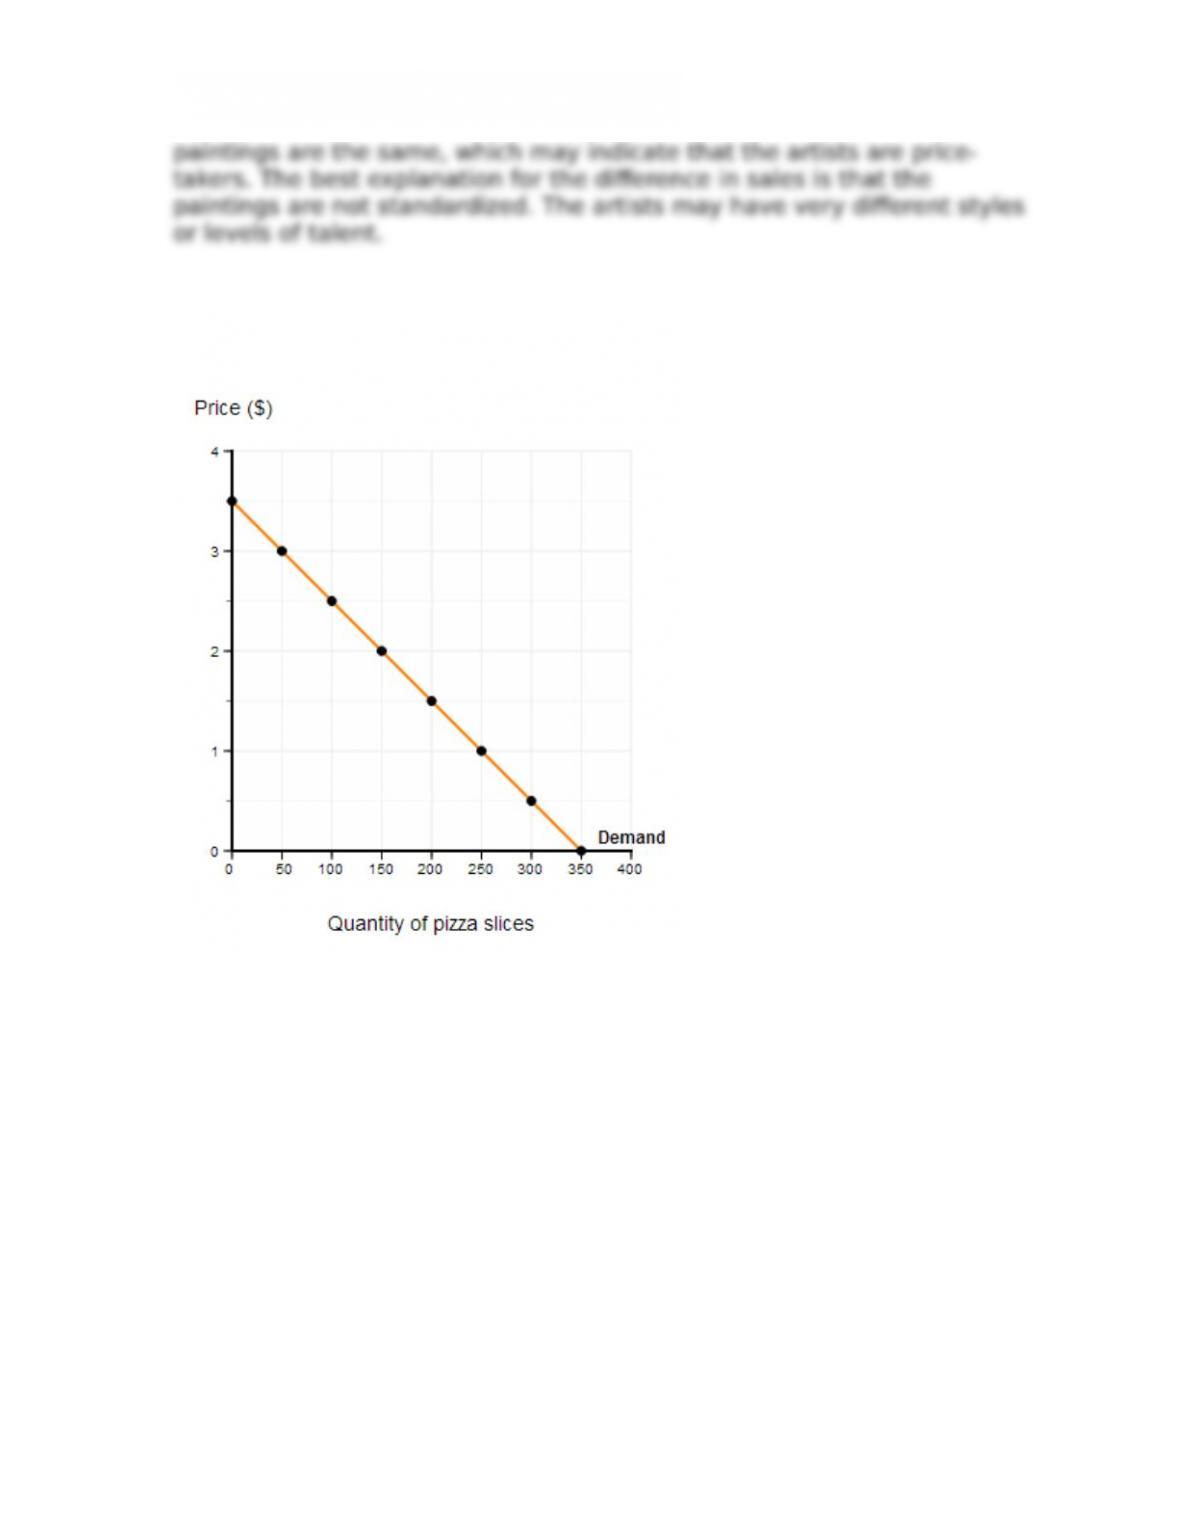
3. Using the demand schedule in Table 3P-1, draw the daily demand curve
for slices of pizza in a college town. [LO 3.2]
Answer:
4. Consider the market for cars. Which determinant of demand is affected
by each of the following events? Choose from: consumer preferences, prices
of related goods, incomes, expectations, and the number of buyers. [LO
3.2]
a. Environmentalists launch a successful One Family, One Car campaign.
b. A baby boom occurred 16 years ago.
c. Layo$s increase as the economy sheds millions of jobs.
d. An oil shortage causes the price of gasoline to soar.
e. The government o$ers tax rebates in return for the purchase of
commuter rail tickets.
f. The government announces a massive plan to bail out the auto
industry and subsidize production costs.
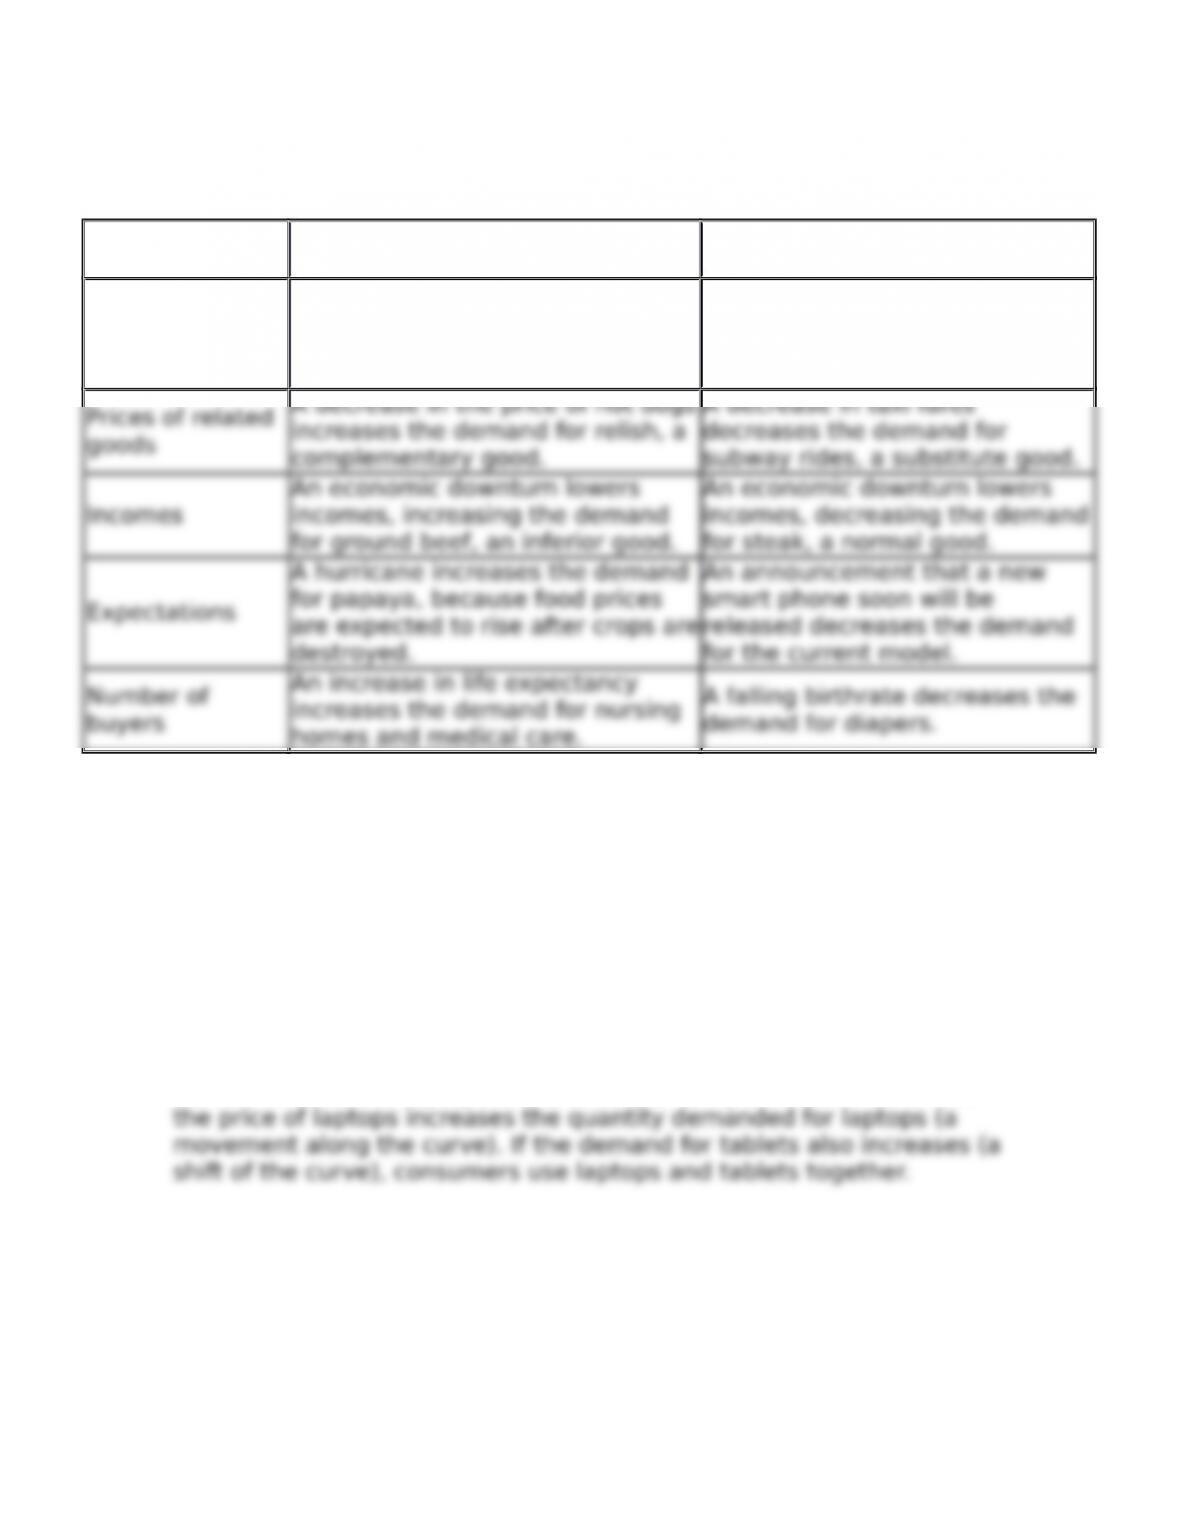
Answer: The non-price determinants of demand can be divided into 7ve
major categories: consumer preferences, the prices of related goods,
3-2
Copyright © 2018 McGraw-Hill Education. All rights reserved. No reproduction or distribution without the prior written consent of McGraw-Hill
Education.
Chapter 03 – Markets
incomes, expectations of future prices, and the number of buyers in the
market.
Determinant of
Demand Increase in Demand Decrease in Demand
Consumer
preferences
A Buy American ad campaign
appeals to national pride,
increasing the demand for U.S.-
made sneakers.
An outbreak of E.coli decreases
the demand for spinach.
A decrease in the price of hot dogs
A decrease in taxi fares
homes and medical care.
a. Consumer preferences.
b. Number of buyers.
c. Incomes.
d. Prices of related goods.
e. Prices of related goods.
f. Expectations.
5. If a decrease in the price of laptops causes the demand for tablets to
increase, are laptops and tablets substitutes or complements? [LO 3.2]
Answer: If a decrease in the price of laptops causes the demand for
tablets to increase, laptops and tablets are complements. A decrease in
6. If rising incomes cause the demand for beer to decrease, is beer a
normal or inferior good? [LO 3.2]
Answer: If rising incomes cause the demand for beer to decrease, beer is
an inferior good. If this is the case for beer, this could be because
3-3
Copyright © 2018 McGraw-Hill Education. All rights reserved. No reproduction or distribution without the prior written consent of McGraw-Hill
Education.
Chapter 03 – Markets
7. Consider the market for corn. Say whether each of the following events
will cause a shift in the demand curve or a movement along the curve. If it
will cause a shift, specify the direction. [LO 3.3]
a. A drought hits corn-growing regions, cutting the supply of corn.
b. The government announces a new subsidy for biofuels made from
corn.
c. A global recession reduces the incomes of consumers in poor
countries, who rely on corn as a staple food.
d. A new hybrid variety of corn seed causes a 15 percent increase in the
yield of corn per acre.
e. An advertising campaign by the beef producers’ association highlights
the health benefit of corn-fed beef.
Answer: A change in the price of a good will cause a movement along
the demand curve. A change in a nonprice determinant will cause a shift
of the demand curve.
a. Movement along the curve: There is a decrease in supply, which
causes an increase in price and a decrease in quantity demanded.
8. The demand curve in Figure 3P-1 shows the monthly market for sweaters
at a local clothing store. For each of the following events, draw the new
outcome. [LO 3.3]
a. Sweaters fall out of fashion.
b. There is a shortage of wool.
c. The winter is particularly long and cold this year.
d. Sweater vendors o$er a sale.
Answer:
a. Point D: This is a change in a nonprice determinant. The demand
b. Point B: A shortage of wool will increase the price of sweaters and
c. Point E: This is a change in a nonprice determinant. The demand
d. Point C: The price of sweaters decreases and the supply curve will
3-4
Copyright © 2018 McGraw-Hill Education. All rights reserved. No reproduction or distribution without the prior written consent of McGraw-Hill
Education.
Chapter 03 – Markets
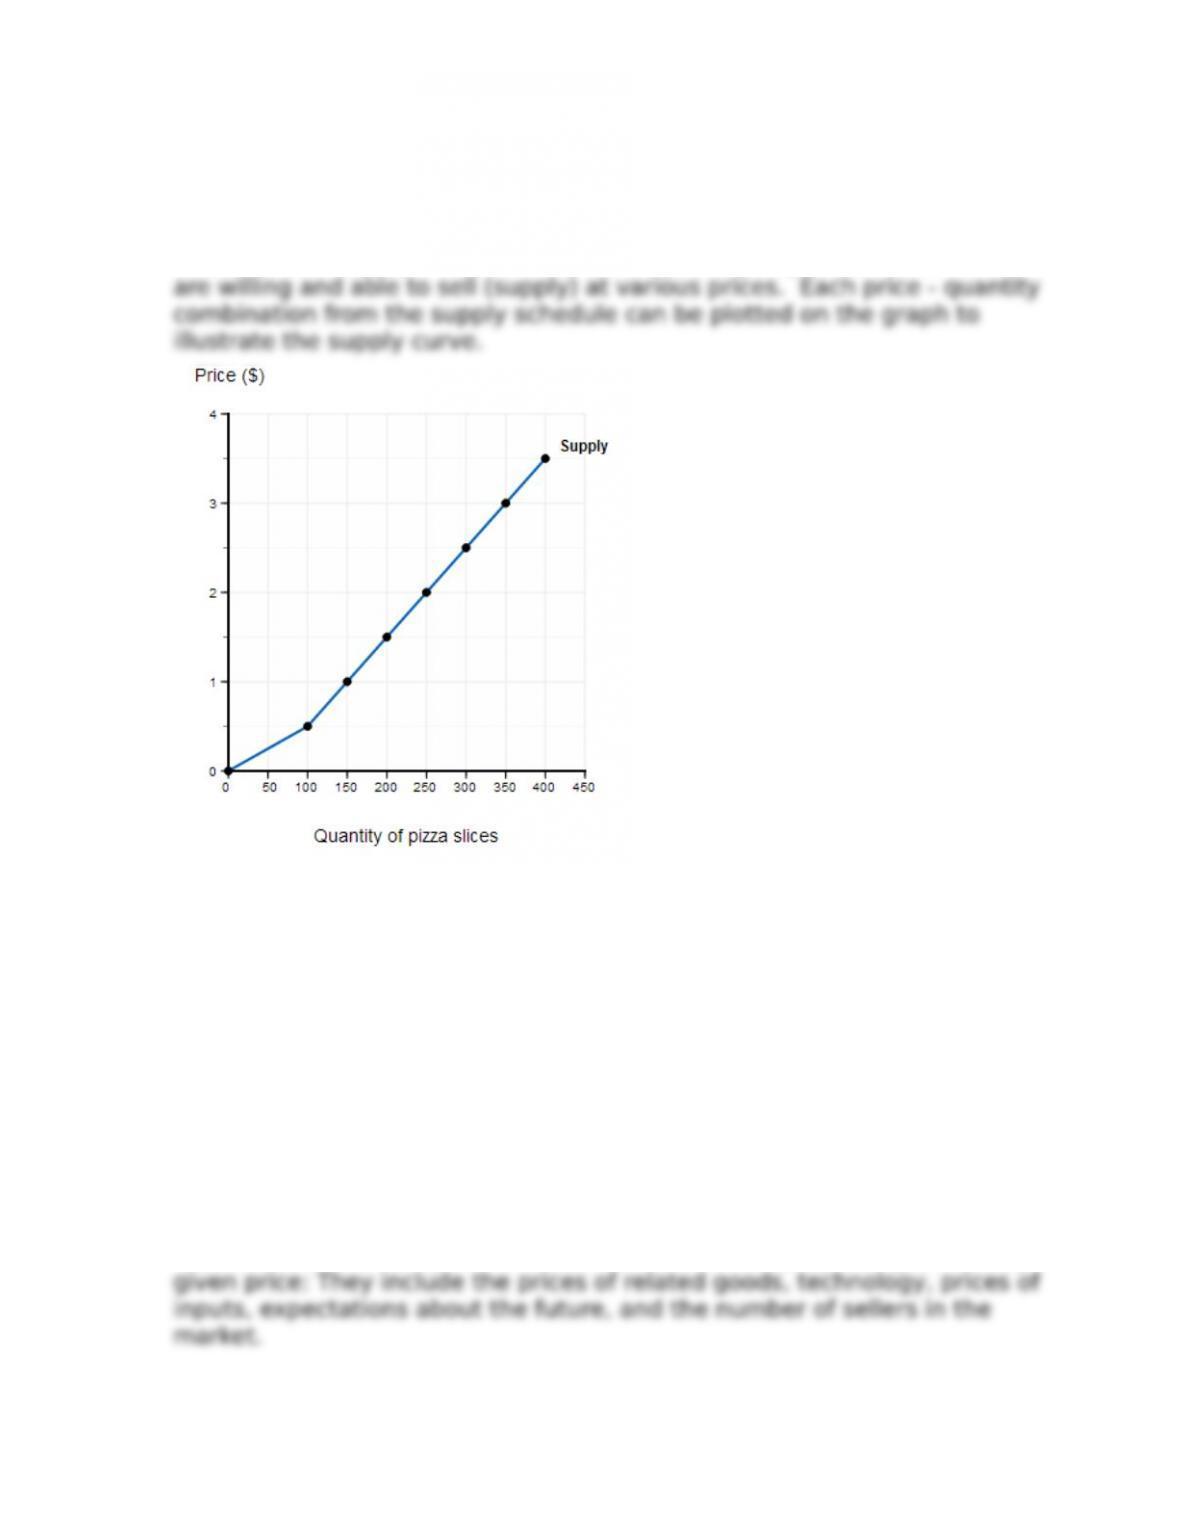
9. Using the supply schedule found in Table 3P-2, draw the daily supply curve
for slices of pizza in a college town. [LO 3.4]
Answer: The supply schedule shows the quantity of pizza slices that firm
10. Consider the market for cars. Which determinant of supply is affected by
each of the following events? Choose from: prices of related goods,
technology, prices of inputs, expectations, and the number of sellers in the
market. [LO 3.4]
a. A steel tari$ increases the price of steel.
b. Improvements in robotics increase e”ciency and reduce costs.
c. Factories close because of an economic downturn.
d. The government announces a plan to o$er tax rebates for the purchase
of commuter rail tickets.
e. The price of trucks falls, so factories produce more cars.
f. The government announces that it will dramatically rewrite e”ciency
standards, making it much harder for automakers to produce their
cars.
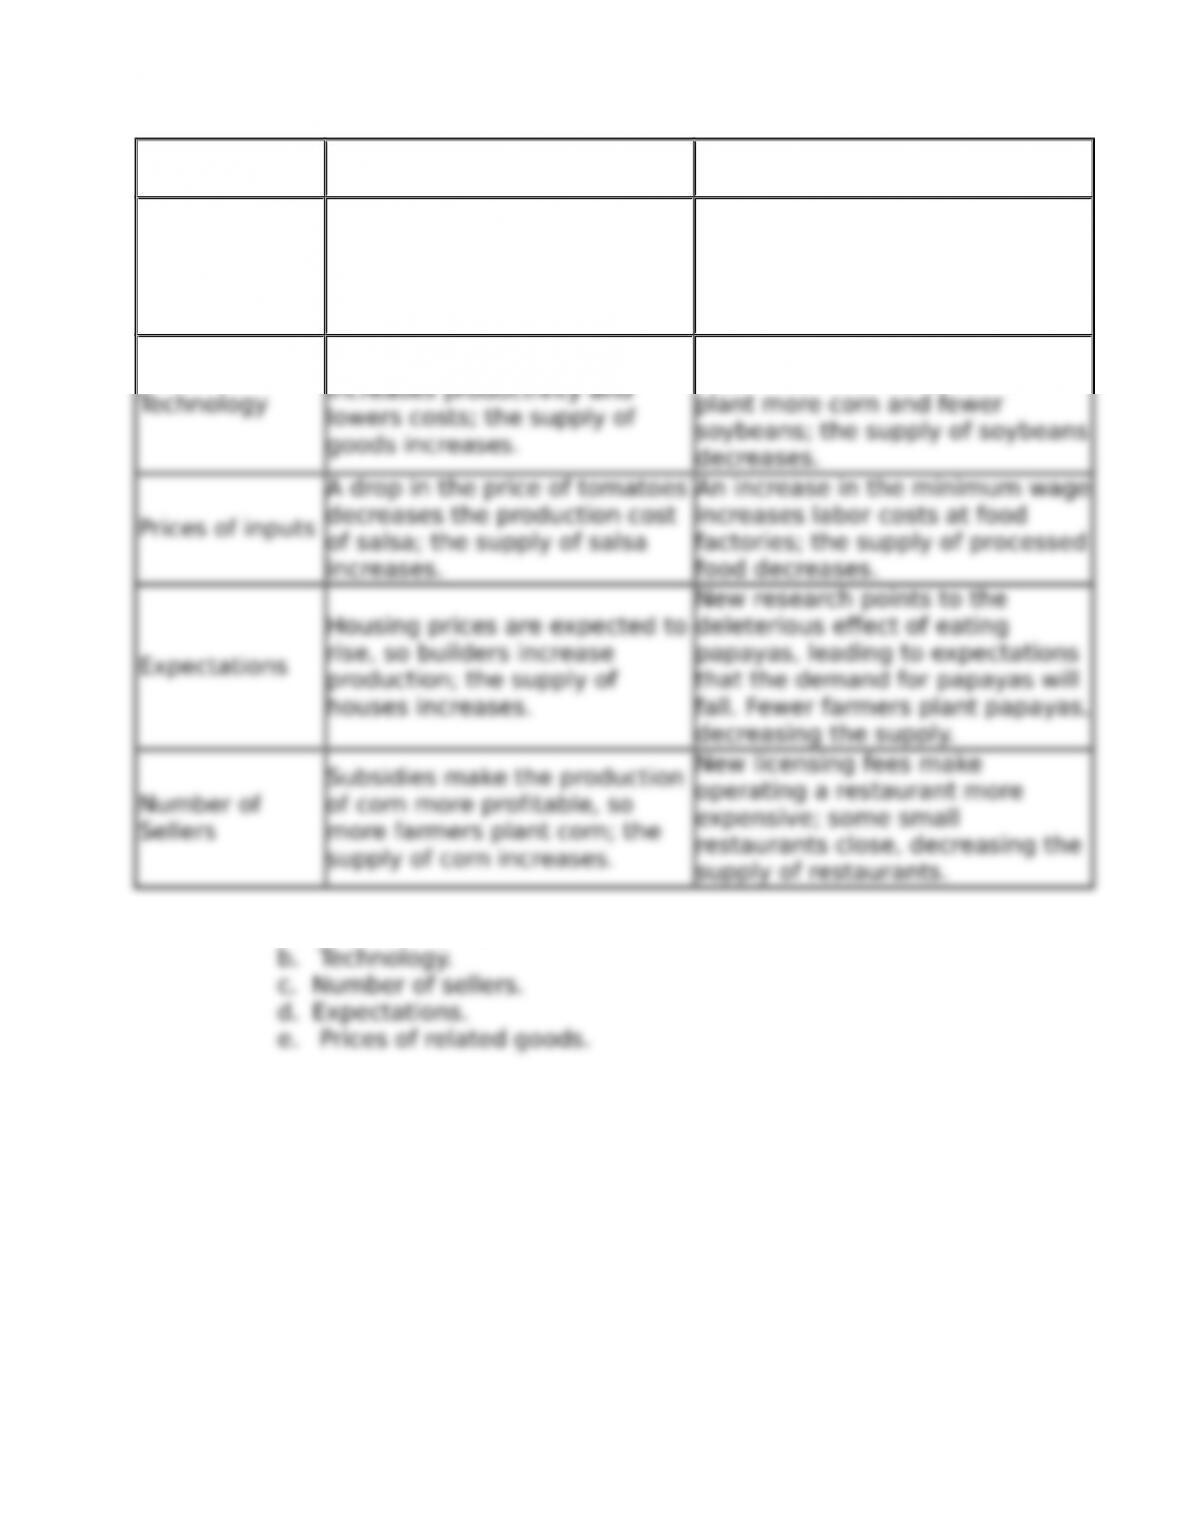
Answer: Several non-price factors determine the supply of a good at any
3-5
Copyright © 2018 McGraw-Hill Education. All rights reserved. No reproduction or distribution without the prior written consent of McGraw-Hill
Education.
Chapter 03 – Markets
Determinant
of Supply Increases in Supply Decreases in Supply
Price of related
goods
The price of gas rises, so an
automaker increases its
production of smaller, more
fuel-e”cient cars.
The price of clean energy
production falls, so the power
company reduces the amount of
power it supplies using coal
power plants.
The installation of robots
increases productivity and
New technology allows corn to be
made into ethanol, so farmers
a. Prices of inputs.
11. Consider the market for corn. Say whether each of the following events
will cause a shift in the supply curve or a movement along the curve. If it will
cause a shift, specify the direction. [LO 3.5]
a. A drought hits corn-growing regions.
b. The government announces a new subsidy for biofuels made from
corn.
c. A global recession reduces the incomes of consumers in poor
countries, who rely on corn as a staple food.
d. A new hybrid variety of corn seed causes a 15 percent increase in the
yield of corn per acre.
3-6
Copyright © 2018 McGraw-Hill Education. All rights reserved. No reproduction or distribution without the prior written consent of McGraw-Hill
Education.
Chapter 03 – Markets
e. An advertising campaign by the beef producers’ association highlights
the health benefit of corn-fed beef.
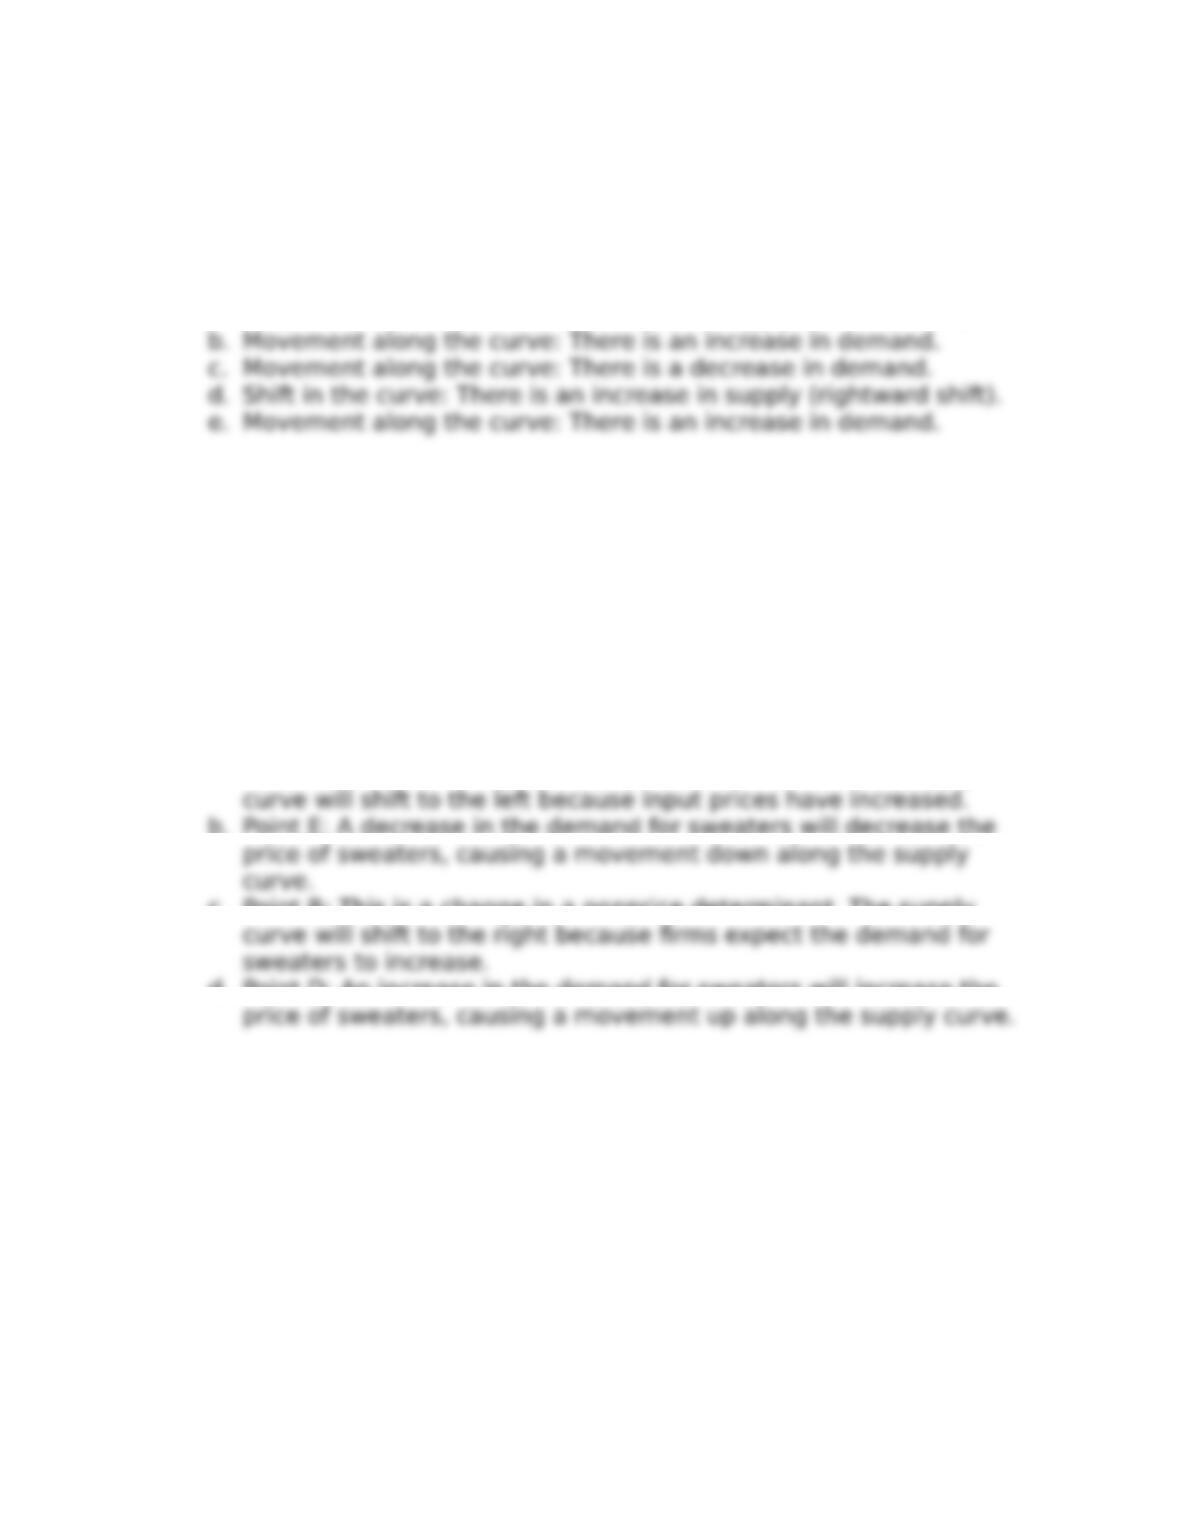
Answer: A change in the price of a good will cause a movement along
the supply curve. A change in a non-price determinant will cause a shift of
the supply curve.
a. Shift in the curve: There is a decrease in supply (leftward shift).
12. The supply curve in Figure 3P-2 shows the monthly market for sweaters
at a local craft market. For each of the following events, draw the new
outcome. [LO 3.5]
a. The price of wool increases.
b. Demand for sweaters decreases.
c. A particularly cold winter is expected to begin next month.
d. Demand for sweaters increases.
Answer: A change in the price of a good will cause a movement along
the supply curve. A change in a nonprice determinant will cause a shift of
the supply curve.
a. Point C: This is a change in a nonprice determinant. The supply
b. Point E: A decrease in the demand for sweaters will decrease the
c. Point B: This is a change in a nonprice determinant. The supply
d. Point D: An increase in the demand for sweaters will increase the
13. Refer to the demand and supply schedule shown in Table 3P-3. [LO
3.6]
a. If pizza parlors charge $3.50 per slice, will there be excess supply or
excess demand? What is the amount of excess supply or excess
demand at that price?
b. If pizza parlors charge $1.00 per slice, will there be excess supply or
excess demand? What is the amount of excess supply or excess
demand at that price?
c. What are the equilibrium price and quantity in this market?
Answer:
3-7
Copyright © 2018 McGraw-Hill Education. All rights reserved. No reproduction or distribution without the prior written consent of McGraw-Hill
Education.
Chapter 03 – Markets
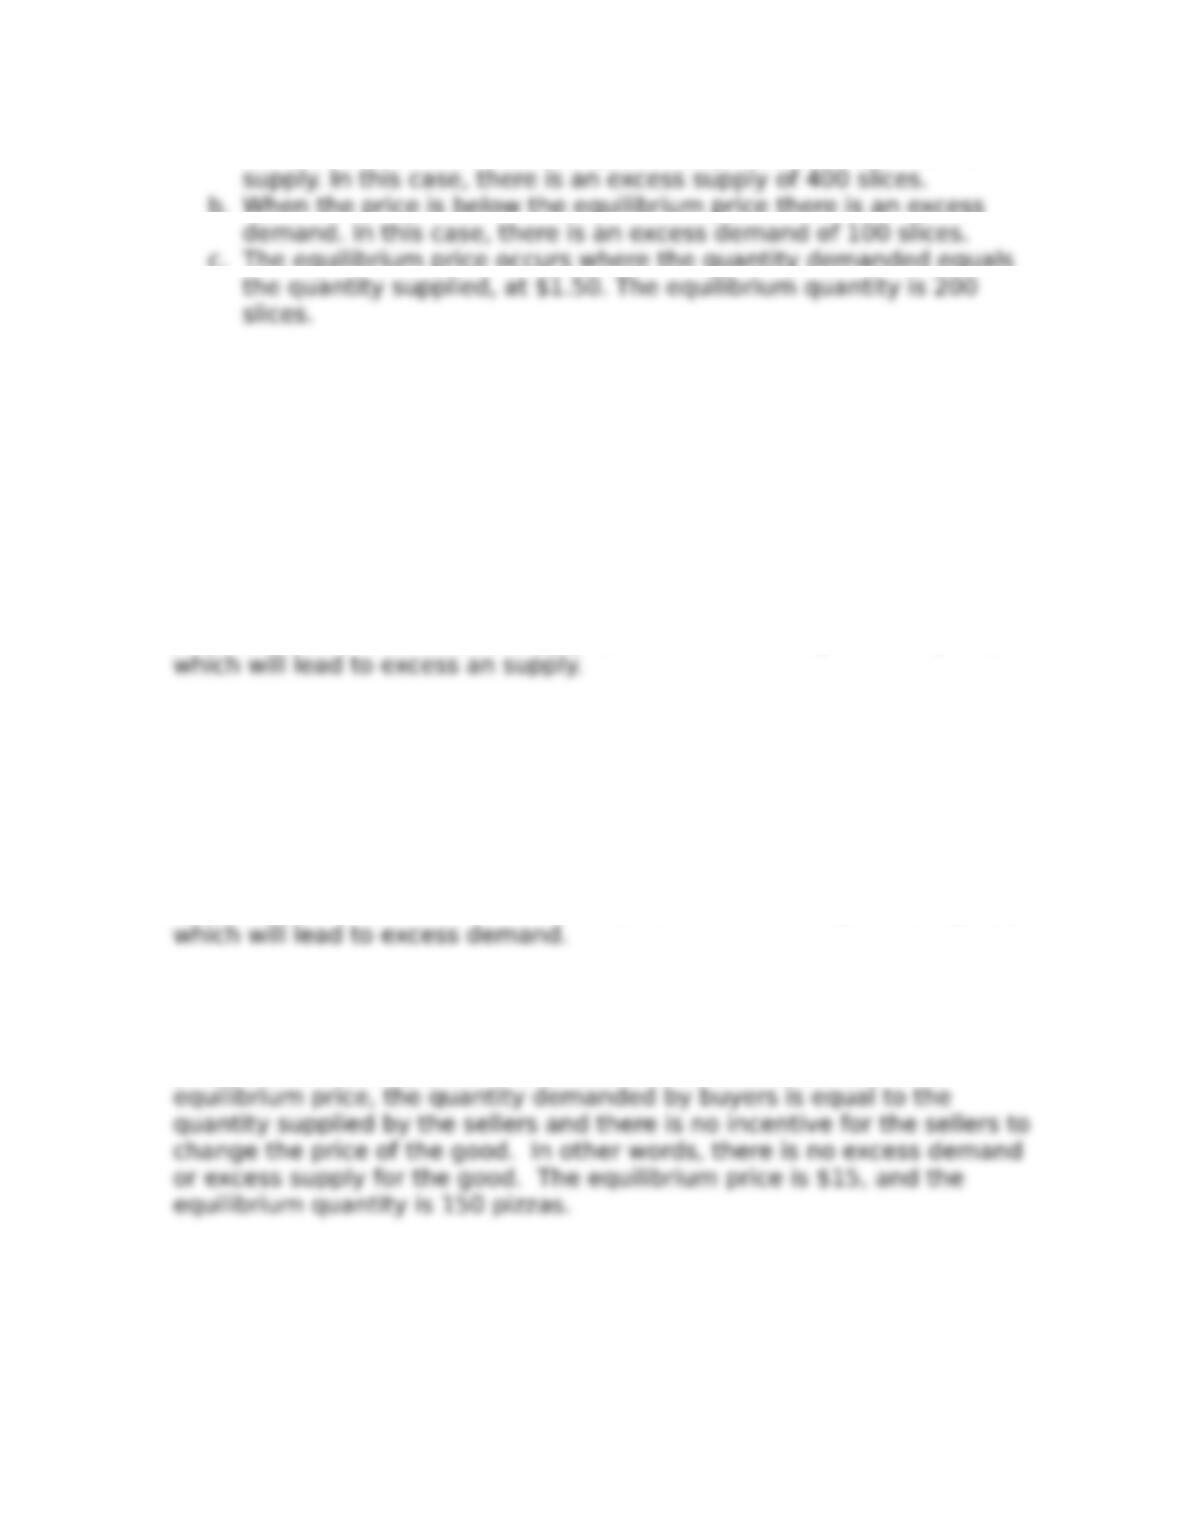
a. When the price is above the equilibrium price there is an excess
b. When the price is below the equilibrium price there is an excess
c. The equilibrium price occurs where the quantity demanded equals
The graph in Figure 3P-3 shows the weekly market for pizzas in a
small town. Use this graph to answer Problems 14–16.
14. Which of the following events will occur at a price of $20? [LO 3.6]
a. Equilibrium.
b. Excess demand.
c. Excess supply.
d. No pizzas supplied.
e. No pizzas demanded.
Answer: There is an excess supply. $20 is above the equilibrium price,
15. Which of the following events will occur at a price of $10? [LO 3.6]
a. Equilibrium.
b. Excess demand.
c. Excess supply.
d. No pizzas supplied.
e. No pizzas demanded.
Answer: There is an excess demand. $10 is below the equilibrium price,
16. What are the equilibrium price and quantity of pizzas? [LO 3.6]
Answer: Graphically the equilibrium price and quantity are found at the
point where the supply curve intersects the demand curve. At this
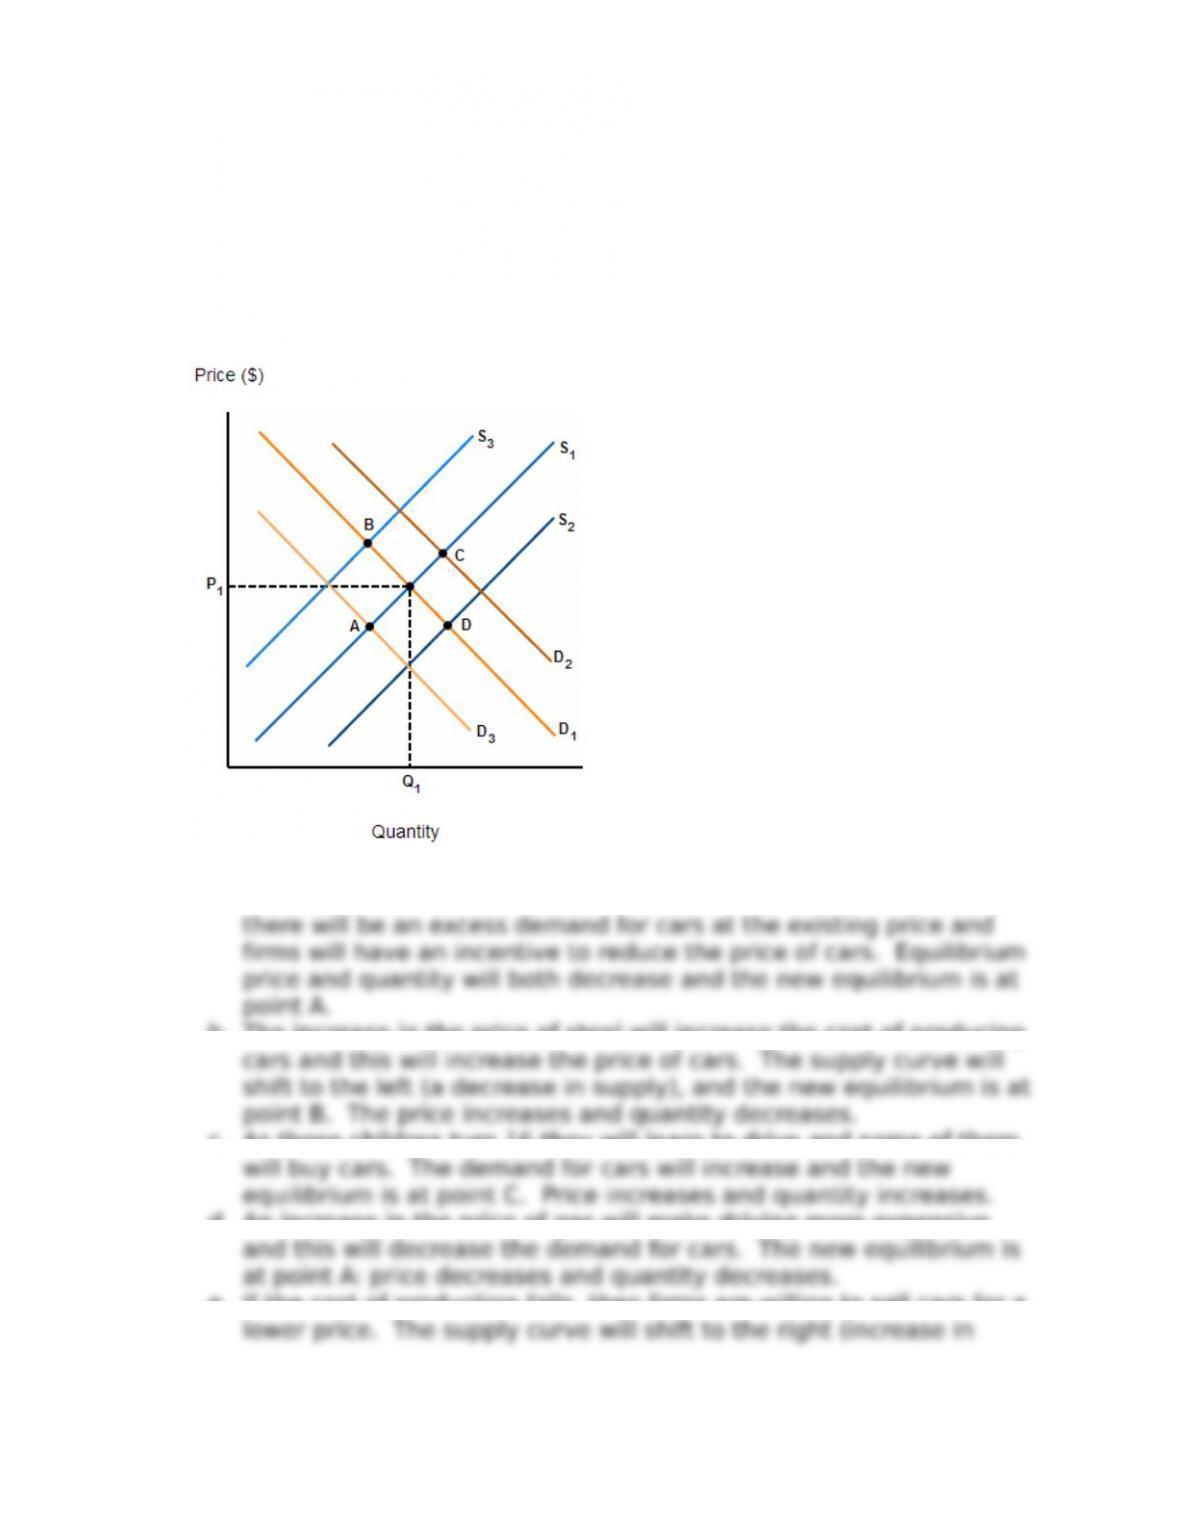
17. The graph in Figure 3P-4 shows supply and demand in the market for
automobiles. For each of the following events, draw the new market
outcome, and say whether the equilibrium price and quantity will increase or
decrease. [LO 3.7]
a. Environmentalists launch a successful One Family, One Car campaign.
3-8
Copyright © 2018 McGraw-Hill Education. All rights reserved. No reproduction or distribution without the prior written consent of McGraw-Hill
Education.
Chapter 03 – Markets
b. A steel tari$ increases the price of steel.
c. A baby boom occurred 16 years ago.
d. An oil shortage causes the price of gasoline to soar.
e. Improvements in robotics increase e”ciency and reduce costs.
f. The government offer a tax rebate for the purchase of commuter rail
tickets.
Answer:
a. If more families decide to own only one car instead of two or three
cars then there is a decrease in the demand for cars. As a result,
b. The increase in the price of steel will increase the cost of producing
c. As these children turn 16 they will learn to drive and some of them
d. An increase in the price of gas will make driving more expensive
e. If the cost of production falls, then 7rms are willing to sell cars for a
3-9
Copyright © 2018 McGraw-Hill Education. All rights reserved. No reproduction or distribution without the prior written consent of McGraw-Hill
Education.
Chapter 03 – Markets
f. A tax rebate on rail tickets will reduce the cost of train travel (a
18. Say whether each of the following changes will increase or decrease the
equilibrium price and quantity, or whether the effect cannot be predicted.
[LO 3.7]
a. Demand increases; supply remains constant.
b. Supply increases; demand remains constant.
c. Demand decreases; supply remains constant.
d. Supply decreases; demand remains constant.
e. Demand increases; supply increases.
f. Demand decreases; supply decreases.
g. Demand increases; supply decreases.
h. Demand decreases; supply increases.
Answer: In the first four parts, only one curve is shifting, so the impact
on equilibrium price and quantity can be predicted. In the last four parts,
two changes are occurring at the same time, so the impact on either
a. The equilibrium price increases, and the equilibrium quantity
increases.
b. The equilibrium price decreases, and the equilibrium quantity
increases.
c. The equilibrium price decreases, and the equilibrium quantity
decreases.
3-10
Copyright © 2018 McGraw-Hill Education. All rights reserved. No reproduction or distribution without the prior written consent of McGraw-Hill
Education.

Chapter 03 – Markets
3-11
Copyright © 2018 McGraw-Hill Education. All rights reserved. No reproduction or distribution without the prior written consent of McGraw-Hill
Education.