Chapter 03 – Markets
CHAPTER 3
MARKETS
Chapter Overview
By the time you reach the end of this course, you’ll be quite familiar with the
words supply and demand. We take our time on this subject for good reason:
An understanding of supply and demand is the foundation of economic
problem solving. You’ll be hard-pressed to make wise economic choices
without it.
Although markets are not always perfectly competitive, you may be
surprised at how accurately many real-world phenomena can be described
using the simple rules of supply and demand. In the next chapters we’ll use
these rules to explain how consumers and producers respond to price
changes and government policies.
Learning Objectives
LO 3.1: Identify the defining characteristics of a competitive market.
LO 3.2: Draw a demand curve and describe the external factors that
determine demand.
LO 3.3: Distinguish between a shift in and a movement along the demand
curve.
LO 3.4: Draw a supply curve and describe the external factors that
determine supply.
LO 3.5: Distinguish between a shift in and a movement along the supply
curve.
LO 3.6: Explain how supply and demand interact to drive markets to
equilibrium.
LO 3.7: Evaluate the effect of changes in supply and demand on the
equilibrium price and quantity.
Chapter Outline
OPENING STORY: MOBILES GO GLOBAL
Markets
What Is a Market?
What Is a Competitive Market? (LO 3.1)
Demand
The Demand Curve (LO 3.2)
Determinants of Demand
BOX FEATURE: REAL LIFE – CAN INSTANT-NOODLE SALES PREDICT
A RECESSION?
3-1
Copyright © 2018 McGraw-Hill Education. All rights reserved. No reproduction or distribution without the prior written consent of McGraw-Hill
Education.

Chapter 03 – Markets
Shifts in the Demand Curve (LO 3.3)
Supply
The Supply Curve (LO 3.4)
Determinants of Supply
Shifts in the Supply Curve (LO 3.5)
Market Equilibrium
Reaching Equilibrium (LO 3.6)
BOX FEATURE: REAL LIFE – THE PRIUS SHORTAGE OF 2003
Changes in Equilibrium (LO 3.7)
BOX FEATURE: REAL LIFE – GIVE A MAN A FISH
Beyond the Lecture
Class Discussion: Shifts versus Movements in Demand and Supply
(LO 3.3, LO 3.5)
Consider discussing the past prohibition of alcohol in the United States to
stimulate a conversation about changes in supply, demand, and price. This
topic can also be used to highlight the di2erence between shifts in demand
and supply and movements along the demand and supply curves.
1. Ask students how they think the introduction of prohibition impacted
demand, supply, and price.
2. Ask students if other things remained constant.
3. Ask students to consider what occurred when prohibition was repealed.
This can be extended to consider any prohibited goods or services. Students
generally *nd this conversation interesting. There are numerous examples in
popular media that can be paired with this discussion. For example, consider
showing a clip from an episode of The Simpsons, Homer vs. the Eighteenth
Amendment (Season 8, Episode 18), from 8:50 to 12:40.
Class Discussion: Supply, Demand, and Equilibrium (LO 3.7)
Show students a brief clip from the television show The OEce to highlight
supply and demand. In this episode, there is a doll that is a very popular gift
item during the holiday season. Dwight buys all of the dolls in the area and
resells them to parents, charging a price above the retail price, but one
which parents are gladly willing to pay. A short video of this is hosted at the
“Economics of the OEce” website, authored by Dan Kuester of Kansas State
University. The video link is here.
Class Activity: Building a Demand Curve (LO 3.2)
A great activity to do in class is to have an auction to build a demand curve.
The day before the auction, tell students to bring their money to class next
time. You can create a “bundle” of goods (candy, soda, chips, popcorn) and
auction of the one lot to the highest bidder. Start by taking a show of hands
for people who would pay a super low price, such as 25 cents or $1 for your
3-2
Copyright © 2018 McGraw-Hill Education. All rights reserved. No reproduction or distribution without the prior written consent of McGraw-Hill
Education.

Chapter 03 – Markets
bundle. Then, when the price gets to $5, auction o2 the good. You can
collect data as you go along. Some notes:
1. You actually need to have the winner pay real money. They are getting
real goods in exchange. We need to reveal the real demand curve for
your class.
2. A link to a video example of this is here, provided by Dave Brown of
Pennsylvania State University.
3. Additionally, you may get students asking you how much you paid for
the bundle. It is most likely that the winning bid is far above the price
you paid for the goods. You can use this to illustrate consumer and
producer surplus as well.
Class Discussion/Class Activity: Supply, Demand, and Equilibrium
(LO 3.7)
Ask students to think about the price of tickets to popular athletic events,
concerts, etc. Have them think about the sticker price of the ticket relative to
the price that they might have to pay to acquire the ticket. Consider showing
them Stubhub, a popular online ticket resale website.
1. How much do tickets for really popular events tend to sell for online,
relative to the retail price of the ticket?
2. Why don’t the original sellers of the tickets just charge a higher price?
3. How do ticket resellers impact the market? Are resellers helping or
harming buyers?
Clicker Questions
There are three main purposes to clicker questions. First, they are a great
way to do a quick and instant “on demand” test of student understanding of
the material. You can cover material, and instantly get feedback on student
comprehension. You can see whether you need to explain certain topics
again, or move on to the next subject. Second, they are a great method to
break up the class and take a moment away from lecture. It gets the
students actively involved. Finally, certain clicker questions can be framed in
a “discussion” manner, in which you can invite students to talk about the
possible right answer with their peers. You can instruct students to convince
their classmate of a right or wrong answer. Clickers may be especially
important with this chapter, as understanding demand and supply is one of
the key objectives taught in basic economics. This is especially true
regarding the di2erence between a movement along a demand (supply)
curve and a shift in demand (supply).
1. A competitive market generally means that [LO 3.1]
A. the sellers solely determine price.
3-3
Copyright © 2018 McGraw-Hill Education. All rights reserved. No reproduction or distribution without the prior written consent of McGraw-Hill
Education.
Chapter 03 – Markets
2. The law of demand states that [LO 3.2]
of a good.
D. consumers’ preferences will be similar.
Feedback: While answer [C] may be true for normal goods, this is not what
the law of demand states. The law of demand just illustrates the downward
sloping nature of the demand function.
3. Which of the following will cause an increase in demand (rightward shift)?
[LO 3.3]
A. A decrease in the price of the good
Feedback: Careful! Many people may incorrectly choose [A] for their
answer. A change in the price causes a movement along a demand curve.
Changes in other factors cause a shift. Answer choice [D] results in a
leftward shift.
4. Prices below equilibrium will result in [LO 3.6]
A. more government regulations on the market.
5. Suppose a market is in equilibrium. If there is a decrease in demand, we
expect [LO 3.7]
A. that the equilibrium will not change.
Feedback: The rightward demand shift leads to a new equilibrium point
with a higher price and quantity.
Solutions to End-of-Chapter Questions and Problems
3-4
Copyright © 2018 McGraw-Hill Education. All rights reserved. No reproduction or distribution without the prior written consent of McGraw-Hill
Education.
Chapter 03 – Markets
Review Questions
1. Think about a competitive market in which you participate regularly.
For each of the characteristics of a competitive market, explain how your
market meets these requirements. [LO 3.1]
Answer: The market for eggs is competitive. There are many grocery
stores where eggs can be purchased. Standardized good: Eggs are a
standardized good. There are di2erent kinds of eggs, of course, but each
2. Think about a noncompetitive market in which you participate regularly.
Explain which characteristic(s) of competitive markets your market does not
meet. [LO 3.1]
Answer: I take the subway to work every day. Public transportation is not
a competitive market. There is only one subway system, so there is no
competition. The subway is a natural monopoly (students will learn about
3. Explain why a demand curve slopes downward. [LO 3.2]
Answer: The demand curve slopes downward because as prices increase,
quantity demanded decreases. Price and quantity move in opposite
4. In each of the following examples, name the factor that affect
demand and describe its impact on your demand for a new cell phone. [LO
3.2]
a. You hear a rumor that a new and improved model of the phone you
want is coming out next year.
b. Your grandparents give you $500.
3-5
Copyright © 2018 McGraw-Hill Education. All rights reserved. No reproduction or distribution without the prior written consent of McGraw-Hill
Education.
Chapter 03 – Markets
c. A cellular network announces a holiday sale on a data package that
includes the purchase of a new smartphone.
d. A friend tells you how great his new phone is and suggests that you get
one, too.
Answer:
a. Expectations. Your current demand will decrease in the present as
b. Incomes. Your purchasing power has increased due to the money
c. Price of a Related Good. When the price of a data package (a
d. Consumer Preferences. Your friend inOuences your interest in
5. Consider the following events:
a. The price of cell phones goes down by 25 percent during a sale.
b. You get a 25 percent raise at your job.
c. Which event represents a shift in the demand curve? Which represents
a movement along the curve? What is the difference? [LO 3.3]
Answer: The relationship between price and quantity demanded is
a. When the price of cell phones goes down by 25 percent, this is a
b. When your income increases by 25 percent, there is a shift in the
6. What is the difference between a change in demand and a change in
quantity demanded? [LO 3.3]
Answer: When we refer to a change in demand, we are referring to a shift
of the entire curve. This happens when a non-price factor changes–such
7. Explain why a supply curve slopes upward. [LO 3.4]
3-6
Copyright © 2018 McGraw-Hill Education. All rights reserved. No reproduction or distribution without the prior written consent of McGraw-Hill
Education.
Chapter 03 – Markets
Answer: The supply curve slopes upward because as prices increase,
quantity supplied also increases. Price and quantity move in the same
8. In each of the following examples, name the factor that affect supply
and describe its impact on the supply of cell phones. [LO 3.4]
a. Economic forecasts suggest that the demand for cell phones will
increase in the future.
b. The price of plastic goes up.
c. A new screen technology reduces the cost of making cell phones.
Answer:
a. Expectations. If demand for cell phones is expected to increase in
the future, then the price of cell phones is expected to increase in
b. Prices of Inputs. Plastic is an input in the production of cell phones.
c. Technology. If advancement in screen technology reduces the cost
9. Consider the following events:
a. A maggot infestation ruins a large number of apple orchards in
Washington state.
b. Demand for apples goes down, causing the price to fall.
c. Which event represents a shift in the supply curve? Which represents a
movement along the curve? What is the difference? [LO 3.5]
Answer: Factors of supply that are held constant, such as number of
suppliers, cause a shift in the supply curve when they change. The
a. A fruitworm infestation will cause a shift in the supply of apples, as
b. When demand decreases and prices fall, there is a movement along
3-7
Copyright © 2018 McGraw-Hill Education. All rights reserved. No reproduction or distribution without the prior written consent of McGraw-Hill
Education.
Chapter 03 – Markets
10. What is the difference between a change in supply and a change in
quantity supplied? [LO 3.5]
Answer: When we refer to a change in supply, we are referring to a shift
of the entire curve. This happens when a non-price factor changes–such
11. What is the relationship between supply and demand when a market is
in equilibrium? Explain how the incentives facing cell phone companies and
consumers cause the market for cell phones to reach equilibrium. [LO 3.6]
Answer: When a market is in equilibrium, quantity supplied equals
quantity demanded. We say that supply and demand are in agreement at
12. Explain why the equilibrium price is often called the market-clearing
price. [LO 3.6]
Answer: The equilibrium price is often called the market clearing price
because it is the price at which the market “clears” in the sense that
13. Suppose an economic boom causes incomes to increase. Explain what
will happen to the demand and supply of phones, and predict the direction of
the change in the equilibrium price and quantity. [LO 3.7]
Answer: If incomes increase, there will be an increase in demand for cell
14. Suppose an economic boom drives up wages for the sales
representatives who work for cell phone companies. Explain what will happen
to the demand and supply of phones, and predict the direction of the change
in the equilibrium price and quantity. [LO 3.7]
Answer: If an increase in wages causes an increase in production costs
3-8
Copyright © 2018 McGraw-Hill Education. All rights reserved. No reproduction or distribution without the prior written consent of McGraw-Hill
Education.
Chapter 03 – Markets
15. Suppose an economic boom causes incomes to increase and at the same
time drives up wages for the sales representatives who work for cell phone
companies. Explain what will happen to the demand for and supply of
phones and predict the direction of the change in the equilibrium price and
quantity. [LO 3.7]
Answer: When both an increase in demand and a decrease in supply
Problems and Applications
1. Consider shopping for cucumbers in a farmers’ market. For each
statement below, note which characteristic of competitive markets the
statement describes. Choose from: standardized good, full information, no
transaction costs, and participants are price takers. [LO 3.1]
a. All of the farmers have their prices posted prominently in front of their
stalls.
b. Cucumbers are the same price at each stall.
c. There is no diEculty moving around between stalls as you shop and
choosing between farmers.
d. You and the other customers all seem indi2erent about which
cucumbers to buy.
Answer: A standardized good is a good for which any two units have the
same features and are interchangeable. In a competitive market, you
have full information about the price and features of the good being
a. Full information.
2. Suppose two artists are selling paintings for the same price in adjacent
3.1]
a. Standardized good.
3-9
Copyright © 2018 McGraw-Hill Education. All rights reserved. No reproduction or distribution without the prior written consent of McGraw-Hill
Education.
Chapter 03 – Markets
b. Full information.
c. No transaction costs.
d. Participants are price takers.
Answer: A standardized good is a good for which any two units have the
same features and are interchangeable. In a competitive market, you
have full information about the price and features of the good being
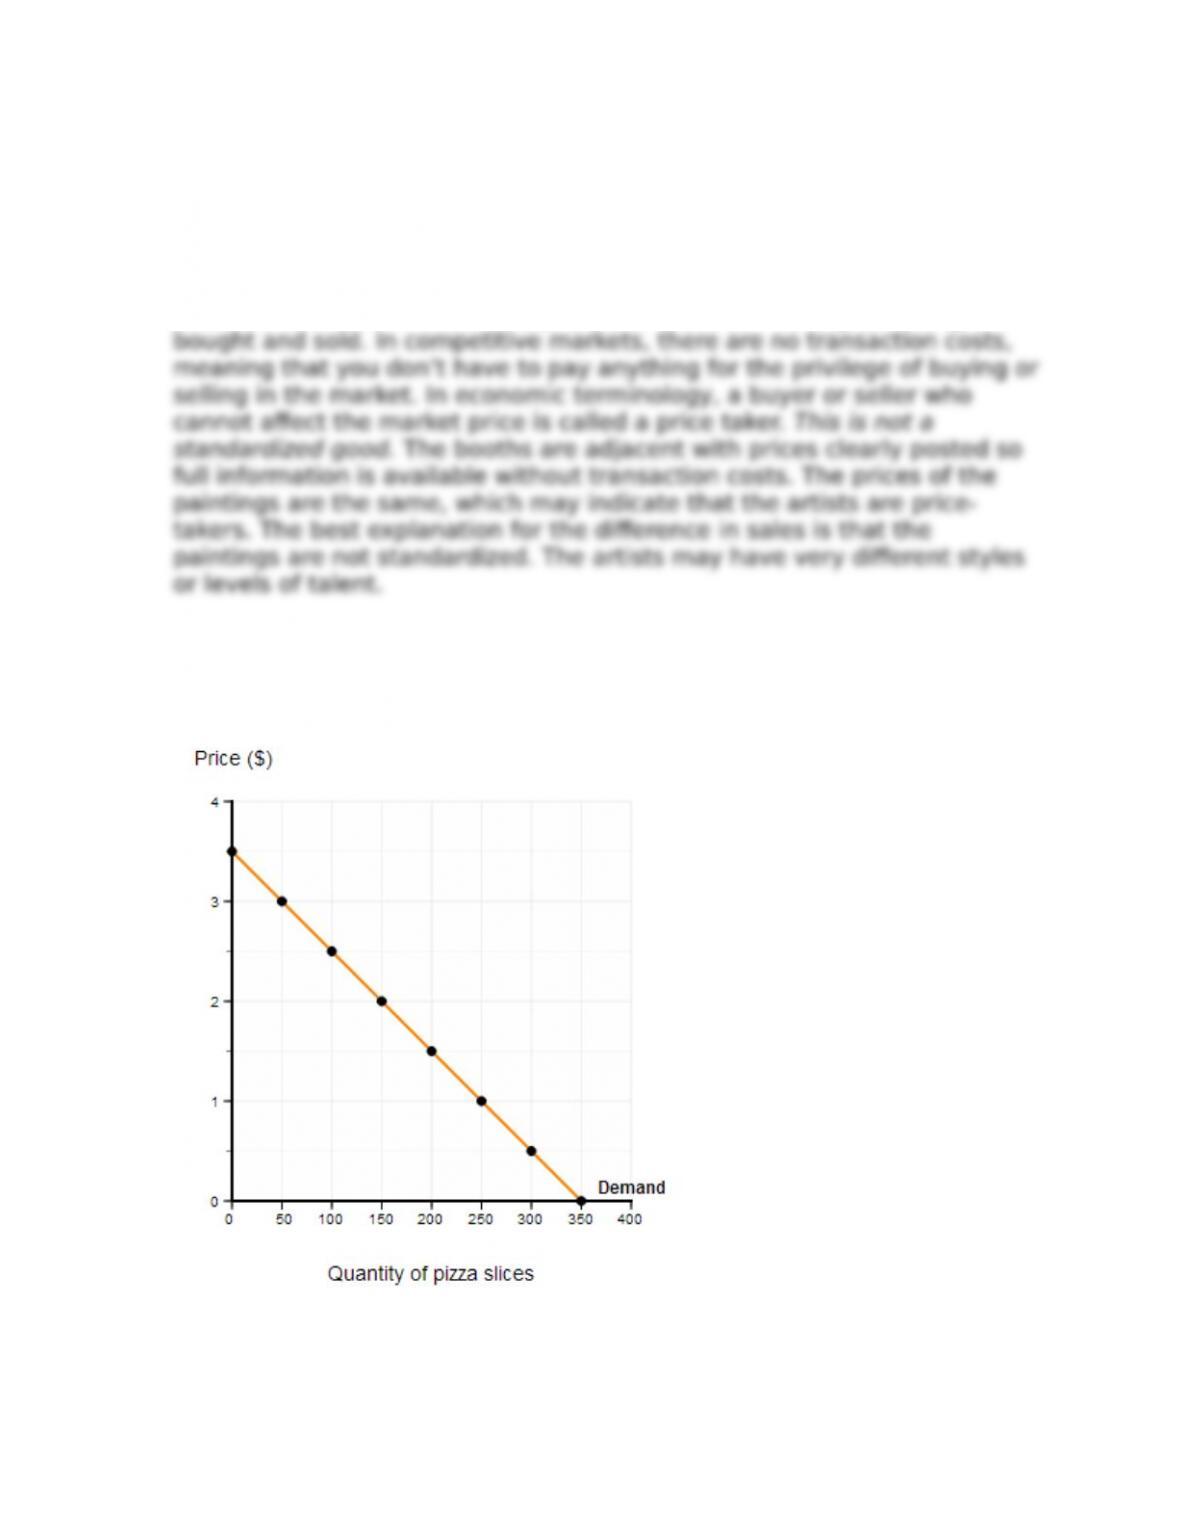
3. Using the demand schedule in Table 3P-1, draw the daily demand curve
for slices of pizza in a college town. [LO 3.2]
Answer:
4. Consider the market for cars. Which determinant of demand is affected
by each of the following events? Choose from: consumer preferences, prices
3-10
Copyright © 2018 McGraw-Hill Education. All rights reserved. No reproduction or distribution without the prior written consent of McGraw-Hill
Education.
Chapter 03 – Markets
of related goods, incomes, expectations, and the number of buyers. [LO
3.2]
a. Environmentalists launch a successful One Family, One Car campaign.
b. A baby boom occurred 16 years ago.
c. Layo2s increase as the economy sheds millions of jobs.
d. An oil shortage causes the price of gasoline to soar.
e. The government offer tax rebates in return for the purchase of
commuter rail tickets.
f. The government announces a massive plan to bail out the auto
industry and subsidize production costs.
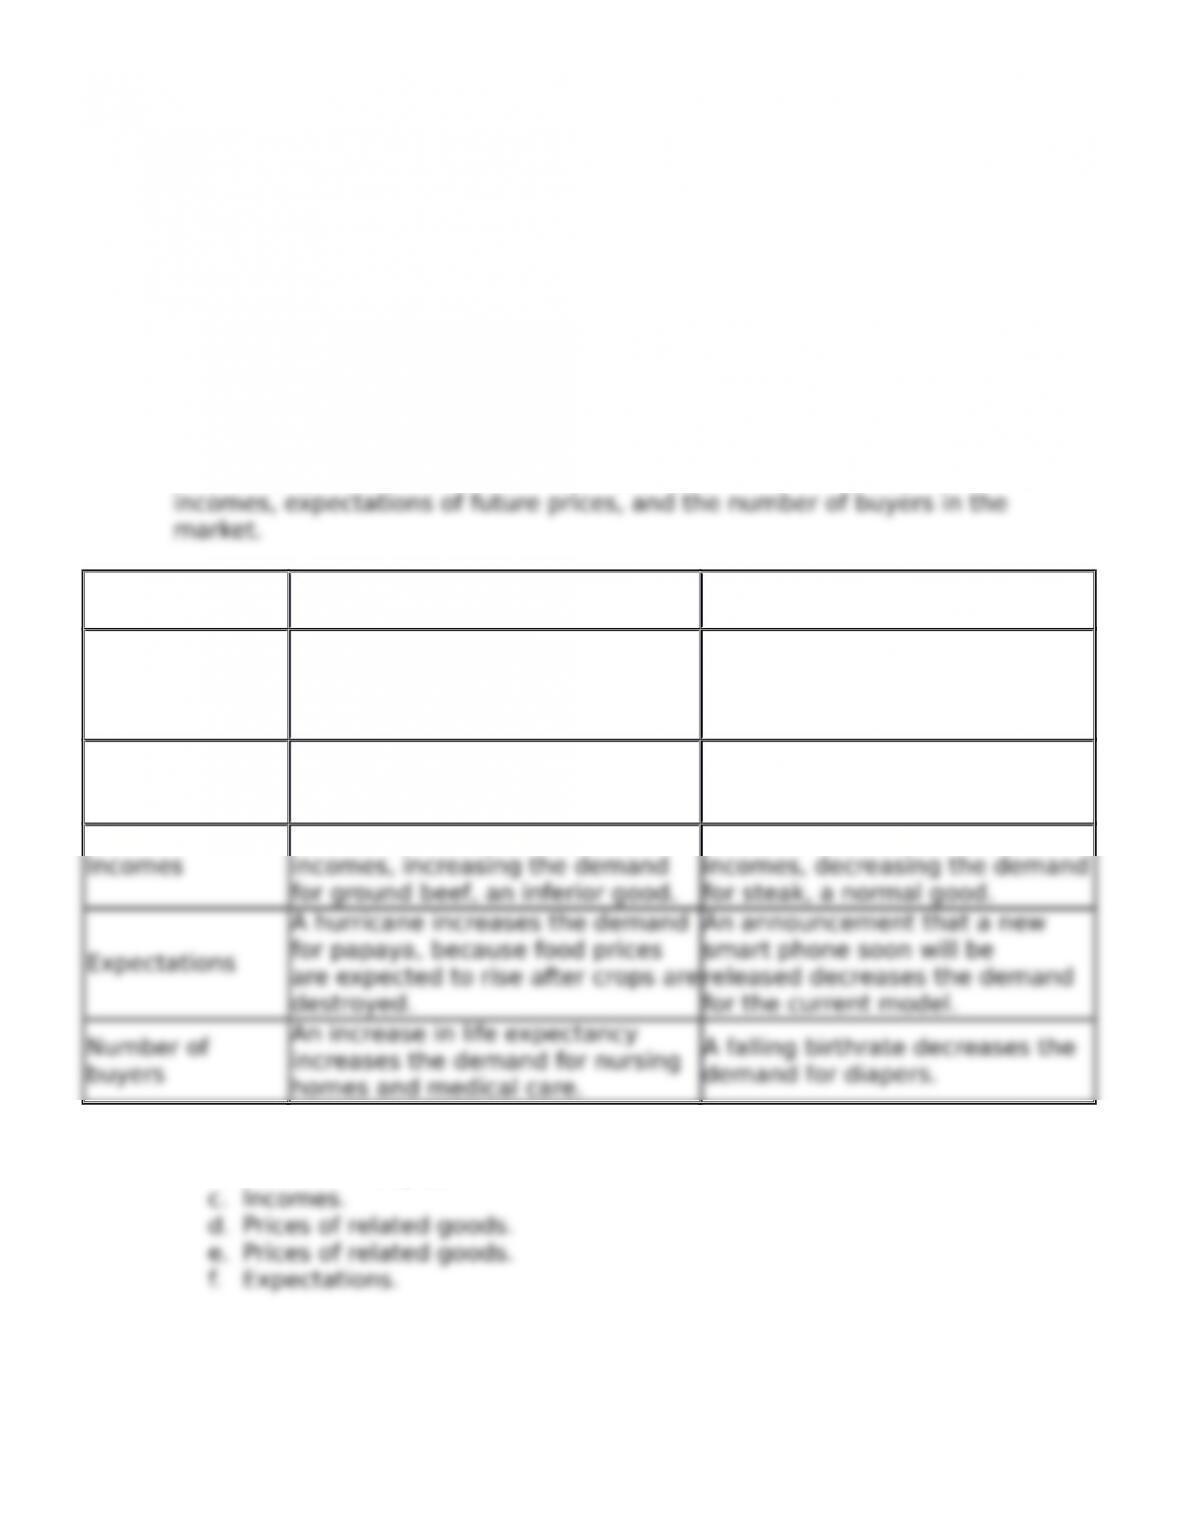
Answer: The non-price determinants of demand can be divided into *ve
major categories: consumer preferences, the prices of related goods,
Determinant of
Demand Increase in Demand Decrease in Demand
Consumer
preferences
A Buy American ad campaign
appeals to national pride,
increasing the demand for U.S.-
made sneakers.
An outbreak of E.coli decreases
the demand for spinach.
Prices of related
goods
A decrease in the price of hot dogs
increases the demand for relish, a
complementary good.
A decrease in taxi fares
decreases the demand for
subway rides, a substitute good.
An economic downturn lowers
An economic downturn lowers
homes and medical care.
a. Consumer preferences.
b. Number of buyers.
5. If a decrease in the price of laptops causes the demand for tablets to
increase, are laptops and tablets substitutes or complements? [LO 3.2]
3-11
Copyright © 2018 McGraw-Hill Education. All rights reserved. No reproduction or distribution without the prior written consent of McGraw-Hill
Education.
Chapter 03 – Markets
Answer: If a decrease in the price of laptops causes the demand for
tablets to increase, laptops and tablets are complements. A decrease in
6. If rising incomes cause the demand for beer to decrease, is beer a
normal or inferior good? [LO 3.2]
Answer: If rising incomes cause the demand for beer to decrease, beer is
7. Consider the market for corn. Say whether each of the following events
will cause a shift in the demand curve or a movement along the curve. If it
will cause a shift, specify the direction. [LO 3.3]
a. A drought hits corn-growing regions, cutting the supply of corn.
b. The government announces a new subsidy for biofuels made from
corn.
c. A global recession reduces the incomes of consumers in poor
countries, who rely on corn as a staple food.
d. A new hybrid variety of corn seed causes a 15 percent increase in the
yield of corn per acre.
e. An advertising campaign by the beef producers’ association highlights
the health benefit of corn-fed beef.
Answer: A change in the price of a good will cause a movement along
the demand curve. A change in a nonprice determinant will cause a shift
of the demand curve.
a. Movement along the curve: There is a decrease in supply, which
causes an increase in price and a decrease in quantity demanded.
8. The demand curve in Figure 3P-1 shows the monthly market for sweaters
at a local clothing store. For each of the following events, draw the new
outcome. [LO 3.3]
a. Sweaters fall out of fashion.
b. There is a shortage of wool.
c. The winter is particularly long and cold this year.
d. Sweater vendors o2er a sale.
3-12
Copyright © 2018 McGraw-Hill Education. All rights reserved. No reproduction or distribution without the prior written consent of McGraw-Hill
Education.
Chapter 03 – Markets
Answer:
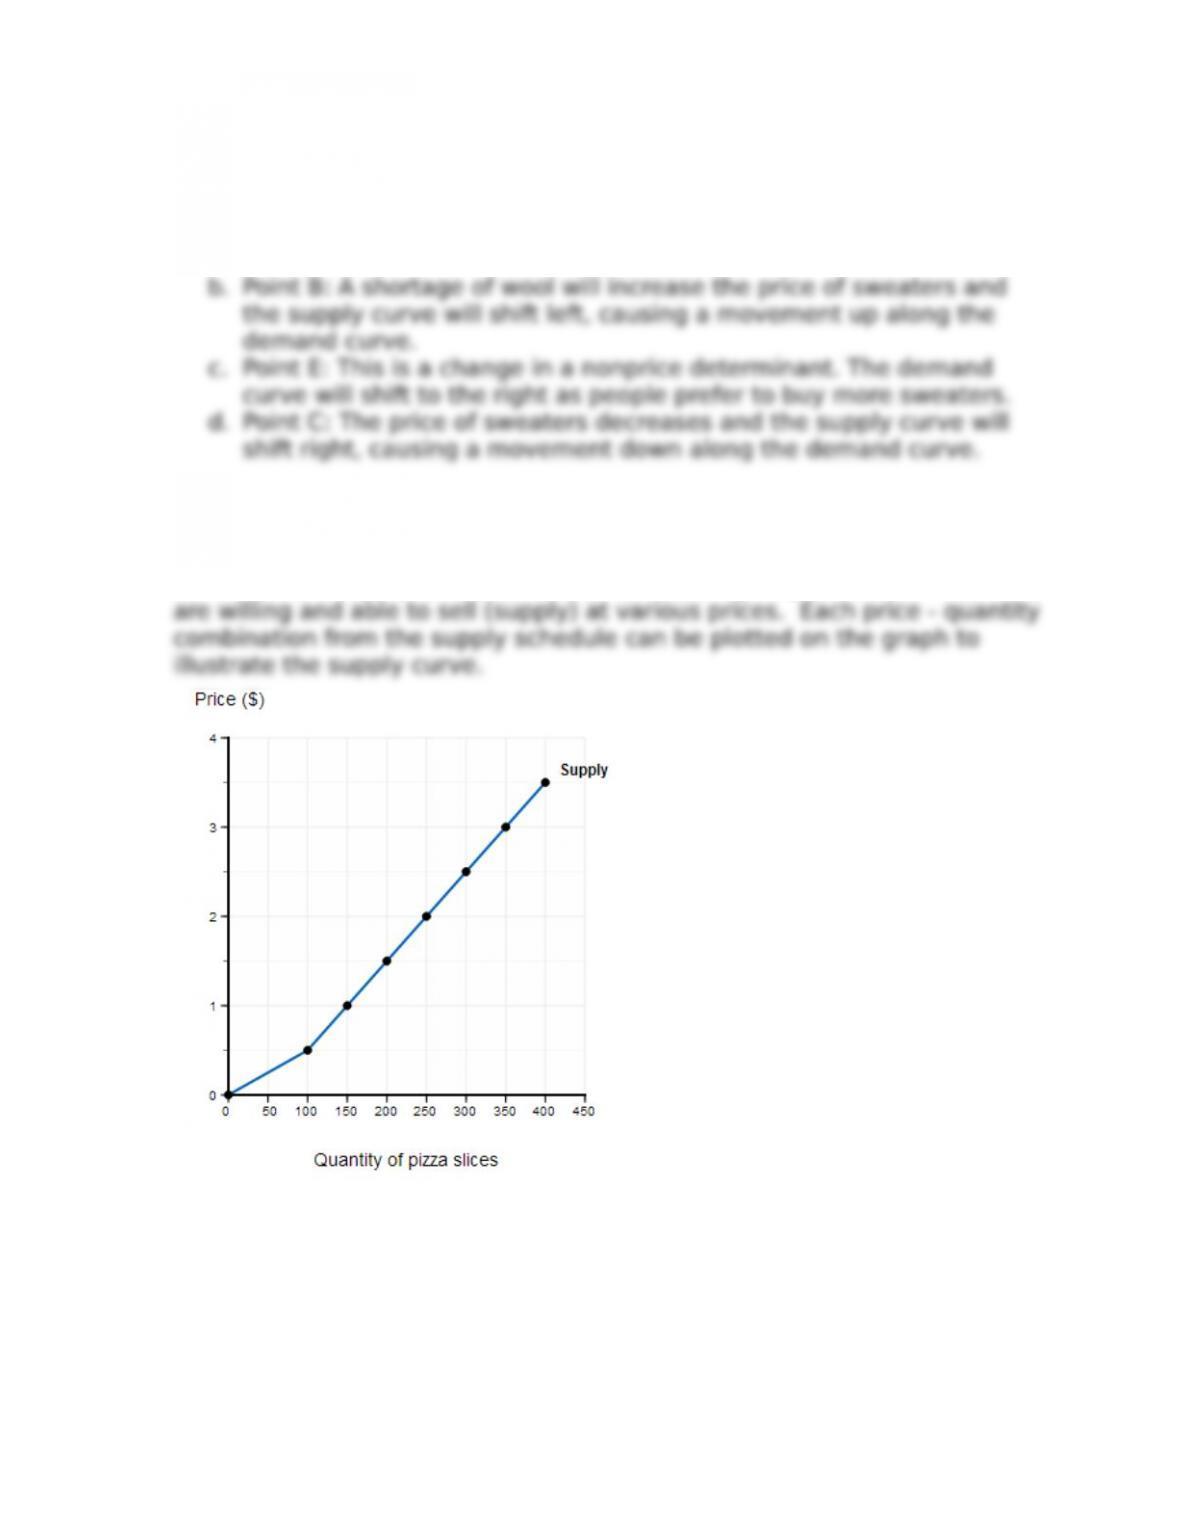
a. Point D: This is a change in a nonprice determinant. The demand
curve will shift to the left because people prefer to buy fewer
sweaters.
9. Using the supply schedule found in Table 3P-2, draw the daily supply curve
for slices of pizza in a college town. [LO 3.4]
Answer: The supply schedule shows the quantity of pizza slices that firm
10. Consider the market for cars. Which determinant of supply is affected by
each of the following events? Choose from: prices of related goods,
technology, prices of inputs, expectations, and the number of sellers in the
market. [LO 3.4]
a. A steel tari2 increases the price of steel.
b. Improvements in robotics increase eEciency and reduce costs.
c. Factories close because of an economic downturn.
3-13
Copyright © 2018 McGraw-Hill Education. All rights reserved. No reproduction or distribution without the prior written consent of McGraw-Hill
Education.
Chapter 03 – Markets
d. The government announces a plan to o2er tax rebates for the purchase
of commuter rail tickets.
e. The price of trucks falls, so factories produce more cars.
f. The government announces that it will dramatically rewrite eEciency
standards, making it much harder for automakers to produce their
cars.
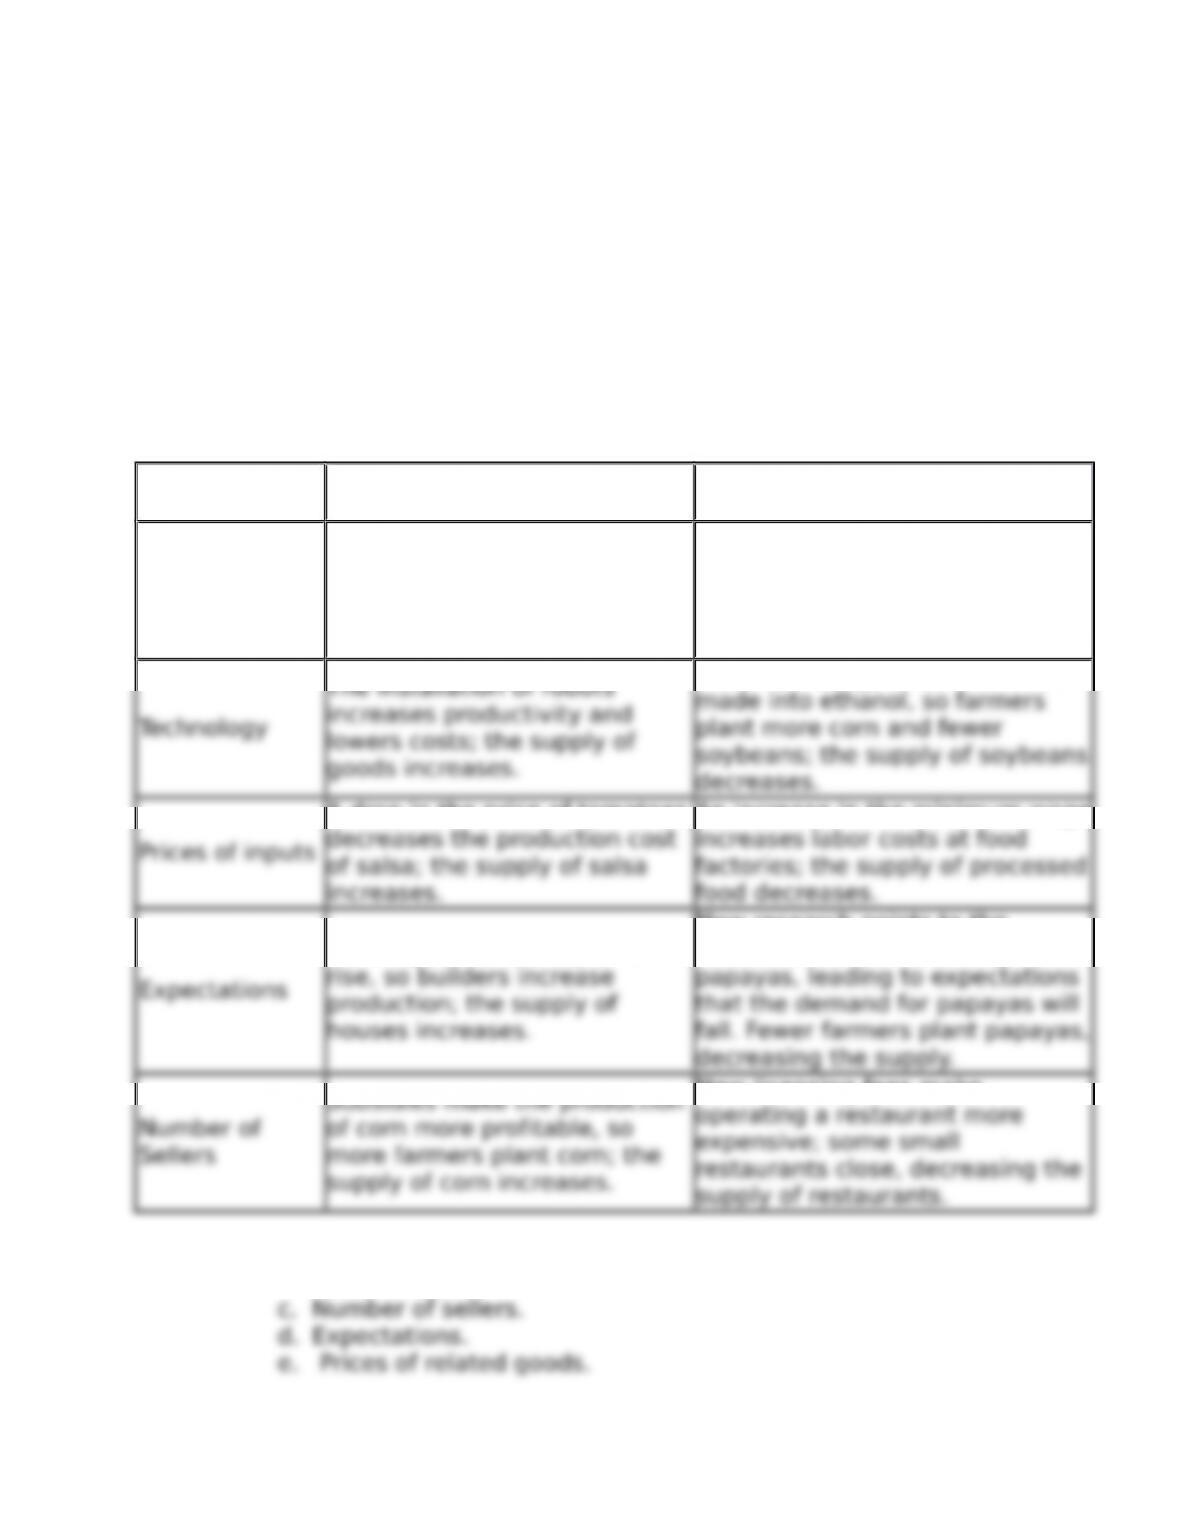
Answer: Several non-price factors determine the supply of a good at any
given price: They include the prices of related goods, technology, prices of
inputs, expectations about the future, and the number of sellers in the
market.
Determinant
of Supply Increases in Supply Decreases in Supply
Price of related
goods
The price of gas rises, so an
automaker increases its
production of smaller, more
fuel-eEcient cars.
The price of clean energy
production falls, so the power
company reduces the amount of
power it supplies using coal
power plants.
The installation of robots
New technology allows corn to be
A drop in the price of tomatoes
An increase in the minimum wage
Housing prices are expected to
New research points to the
deleterious effect of eating
Subsidies make the production
New licensing fees make
a. Prices of inputs.
b. Technology.
3-14
Copyright © 2018 McGraw-Hill Education. All rights reserved. No reproduction or distribution without the prior written consent of McGraw-Hill
Education.
Chapter 03 – Markets
11. Consider the market for corn. Say whether each of the following events
will cause a shift in the supply curve or a movement along the curve. If it will
cause a shift, specify the direction. [LO 3.5]
a. A drought hits corn-growing regions.
b. The government announces a new subsidy for biofuels made from
corn.
c. A global recession reduces the incomes of consumers in poor
countries, who rely on corn as a staple food.
d. A new hybrid variety of corn seed causes a 15 percent increase in the
yield of corn per acre.
e. An advertising campaign by the beef producers’ association highlights
the health benefit of corn-fed beef.
Answer: A change in the price of a good will cause a movement along
the supply curve. A change in a non-price determinant will cause a shift of
the supply curve.
a. Shift in the curve: There is a decrease in supply (leftward shift).
b. Movement along the curve: There is an increase in demand.
12. The supply curve in Figure 3P-2 shows the monthly market for sweaters
at a local craft market. For each of the following events, draw the new
outcome. [LO 3.5]
a. The price of wool increases.
b. Demand for sweaters decreases.
c. A particularly cold winter is expected to begin next month.
d. Demand for sweaters increases.
Answer: A change in the price of a good will cause a movement along
the supply curve. A change in a nonprice determinant will cause a shift of
the supply curve.
a. Point C: This is a change in a nonprice determinant. The supply
b. Point E: A decrease in the demand for sweaters will decrease the
c. Point B: This is a change in a nonprice determinant. The supply
d. Point D: An increase in the demand for sweaters will increase the
3-15
Copyright © 2018 McGraw-Hill Education. All rights reserved. No reproduction or distribution without the prior written consent of McGraw-Hill
Education.
Chapter 03 – Markets
13. Refer to the demand and supply schedule shown in Table 3P-3. [LO
3.6]
a. If pizza parlors charge $3.50 per slice, will there be excess supply or
excess demand? What is the amount of excess supply or excess
demand at that price?
b. If pizza parlors charge $1.00 per slice, will there be excess supply or
excess demand? What is the amount of excess supply or excess
demand at that price?
c. What are the equilibrium price and quantity in this market?
Answer:
a. When the price is above the equilibrium price there is an excess
supply. In this case, there is an excess supply of 400 slices.
The graph in Figure 3P-3 shows the weekly market for pizzas in a
small town. Use this graph to answer Problems 14–16.
14. Which of the following events will occur at a price of $20? [LO 3.6]
a. Equilibrium.
b. Excess demand.
c. Excess supply.
d. No pizzas supplied.
e. No pizzas demanded.
Answer: There is an excess supply. $20 is above the equilibrium price,
15. Which of the following events will occur at a price of $10? [LO 3.6]
a. Equilibrium.
b. Excess demand.
c. Excess supply.
d. No pizzas supplied.
e. No pizzas demanded.
Answer: There is an excess demand. $10 is below the equilibrium price,
16. What are the equilibrium price and quantity of pizzas? [LO 3.6]
Answer: Graphically the equilibrium price and quantity are found at the
point where the supply curve intersects the demand curve. At this
3-16
Copyright © 2018 McGraw-Hill Education. All rights reserved. No reproduction or distribution without the prior written consent of McGraw-Hill
Education.
Chapter 03 – Markets
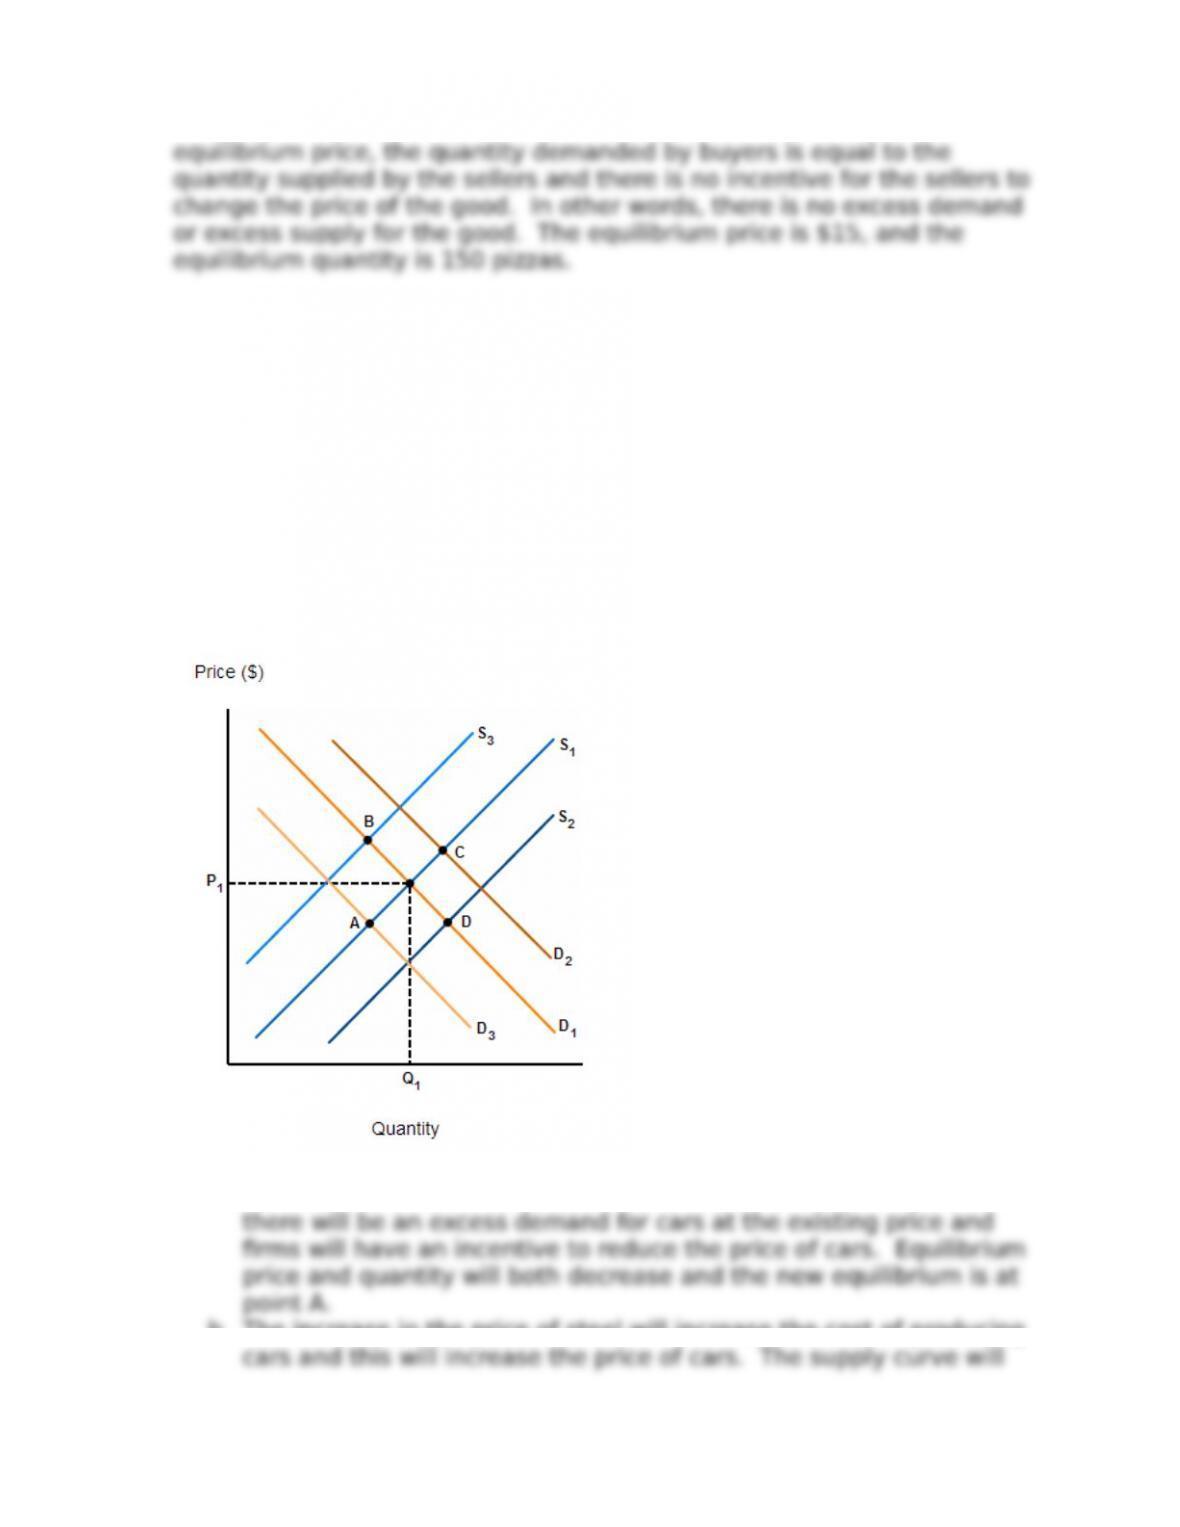
17. The graph in Figure 3P-4 shows supply and demand in the market for
automobiles. For each of the following events, draw the new market
outcome, and say whether the equilibrium price and quantity will increase or
decrease. [LO 3.7]
a. Environmentalists launch a successful One Family, One Car campaign.
b. A steel tari2 increases the price of steel.
c. A baby boom occurred 16 years ago.
d. An oil shortage causes the price of gasoline to soar.
e. Improvements in robotics increase eEciency and reduce costs.
f. The government offer a tax rebate for the purchase of commuter rail
tickets.
Answer:
a. If more families decide to own only one car instead of two or three
cars then there is a decrease in the demand for cars. As a result,
b. The increase in the price of steel will increase the cost of producing
3-17
Copyright © 2018 McGraw-Hill Education. All rights reserved. No reproduction or distribution without the prior written consent of McGraw-Hill
Education.
Chapter 03 – Markets
c. As these children turn 16 they will learn to drive and some of them
d. An increase in the price of gas will make driving more expensive
e. If the cost of production falls, then *rms are willing to sell cars for a
f. A tax rebate on rail tickets will reduce the cost of train travel (a
18. Say whether each of the following changes will increase or decrease the
equilibrium price and quantity, or whether the effect cannot be predicted.
[LO 3.7]
a. Demand increases; supply remains constant.
b. Supply increases; demand remains constant.
c. Demand decreases; supply remains constant.
d. Supply decreases; demand remains constant.
e. Demand increases; supply increases.
f. Demand decreases; supply decreases.
g. Demand increases; supply decreases.
h. Demand decreases; supply increases.
Answer: In the first four parts, only one curve is shifting, so the impact
on equilibrium price and quantity can be predicted. In the last four parts,
two changes are occurring at the same time, so the impact on either
equilibrium price or quantity cannot be predicted. Consider a
a. The equilibrium price increases, and the equilibrium quantity
increases.
3-18
Copyright © 2018 McGraw-Hill Education. All rights reserved. No reproduction or distribution without the prior written consent of McGraw-Hill
Education.
Chapter 03 – Markets
d. The equilibrium price increases, and the equilibrium quantity
decreases.
3-19
Copyright © 2018 McGraw-Hill Education. All rights reserved. No reproduction or distribution without the prior written consent of McGraw-Hill
Education.