Chapter 21 – Poverty, Inequality, and Discrimination
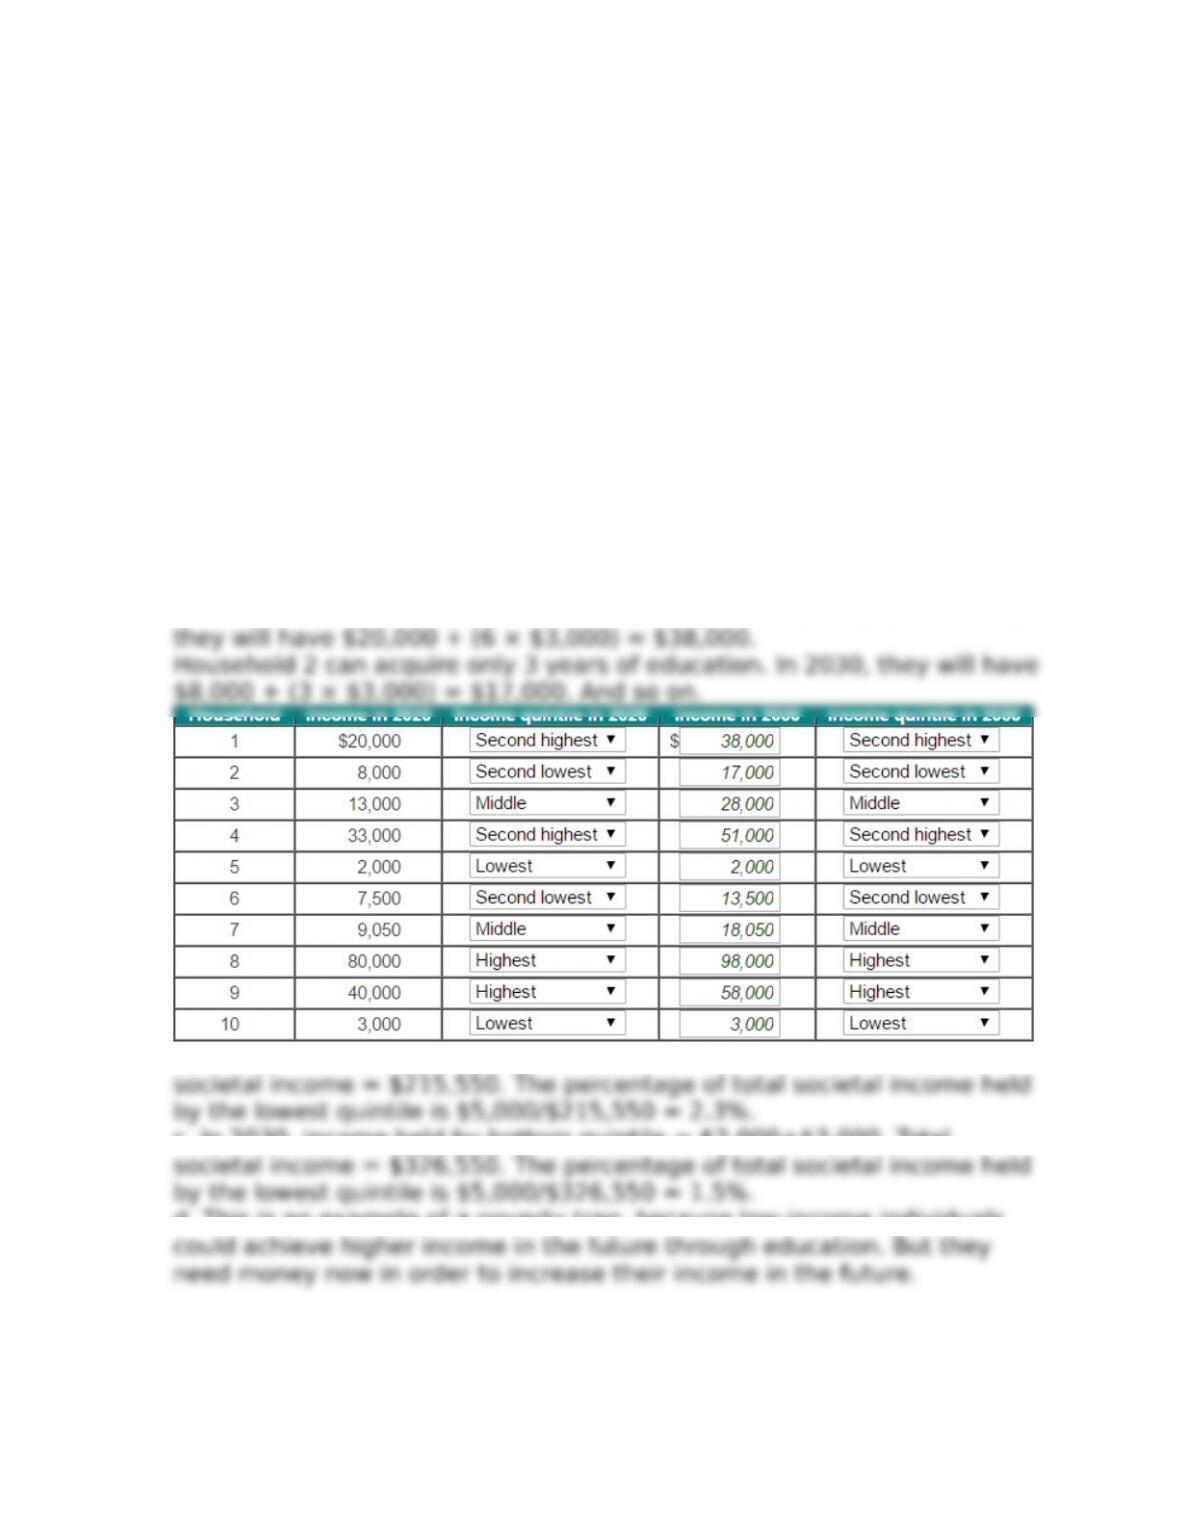
1. Table 21P-3 shows the incomes of 10 households in two different years,
2020 and 2030. Each household makes a choice in 2020 about how many
years of education they will acquire. Suppose each year of education costs
$2,000 and households can acquire a maximum of six years of education. For
the sake of simplicity, suppose that there is no risk in education. Each year of
education will increase your 2030 income by $3,000. Otherwise, your 2030
income will be the same as your 2020 income. Finally, suppose you need at
least $2,000 to survive. [LO 21.2]
a. Fill in the three remaining columns in the table.
b. What is the percentage of total societal income held by the lowest quintile
in 2020?
c. What is the percentage of total societal income held by the lowest quintile
in 2030?
d. How is this an example of a poverty trap?
Answer:
a. Household 1 can invest in the maximum 6 years of education. In 2030,
b. In 2020, income held by bottom quintile = $2,000+$3,000. Total
c. In 2030, income held by bottom quintile = $2,000+$3,000. Total
d. This is an example of a poverty trap, because low-income individuals
2. Using the data for income distribution found in Table 21-4, determine the
following. (The data are provided by the World Bank.) [LO 21.3]
21-1
Copyright © 2018 McGraw-Hill Education. All rights reserved. No reproduction or distribution without the prior written consent of McGraw-Hill
Education.
Chapter 21 – Poverty, Inequality, and Discrimination
a. Does Sweden or Brazil have a higher Gini coefficient?
b. From the bottom quintile to the middle quintile, is the Lorenz curve for
Brazil above or below Sweden’s?
Answer: If everyone earned the same amount and income distribution
were perfectly equal, the Gini coefficient would be zero: The Lorenz curve
a. Table 21-4 shows that Brazil has a more unequal distribution of income:
Sweden.
b. The Lorenz curve plots percentiles on the horizontal axis and percent of
3. Look at the various measures of poverty in 2013 for several countries in
Table 21P-4. (The data are provided by the World Bank.) [LO 21.3]
a. Rank the countries from the country with the highest inequality to the
lowest using the Gini coefficient. (Higher Gini coefficients represent higher
inequality.)
b. Rank the countries from the country with the highest inequality to the
lowest using the ratio of the top decile to the bottom decile.
c. Rank the countries from the country with the highest inequality to the
lowest inequality using the share of total income held by the top 10 percent.
Answer:
a. Countries from highest to lowest, using the Gini index: Honduras,
b. Countries from the highest inequality to the lowest, using the ratio of
c. Countries from the highest inequality to the lowest inequality, using
4. Determine whether each of the scenarios is possible. [LO 21.4]
a. A poverty rate based on a relative measure is high, income mobility is
low, and there is perfect income equality.
b. A poverty rate based on an absolute measure is high, income mobility is
zero, and there is perfect income equality.
21-2
Copyright © 2018 McGraw-Hill Education. All rights reserved. No reproduction or distribution without the prior written consent of McGraw-Hill
Education.
Chapter 21 – Poverty, Inequality, and Discrimination
c. A poverty rate based on an absolute measure is high, income mobility is
high, and there is high income equality.
d. There is no poverty based on a relative measure, income mobility is high,
and there is perfect income equality.
Answer:
a. Impossible. If there is perfect income equality there can be no income
b. Possible. Even though there is perfect income equality, which implies
c. Possible. With high income equality, there can still be some income
6. Classify the following social policies based on the approach taken to
alleviating poverty: economic development, safety nets, or redistribution.
[LO 21.5]
a. The government of Zimbabwe reorganizes property rights, giving
traditionally marginalized black Zimbabweans access to land owned by white
Zimbabweans.
b. As part of a package called the GI Bill, the United States offered to pay the
college tuition of newly returned veterans of World War II.
c. The government of Chile privatizes its social security system. The new
system sets up private accounts that require contributions of at least 10
percent of income. This money is invested by private actors and then
returned to each person at retirement.
21-3
Copyright © 2018 McGraw-Hill Education. All rights reserved. No reproduction or distribution without the prior written consent of McGraw-Hill
Education.
Chapter 21 – Poverty, Inequality, and Discrimination
Answer: The goal of economic development is not only the immediate
effect of the policy on poverty but also the growth it will produce for the
entire economy in the future. Common examples of such policies include
Some policies may redistribute resources with the explicit purpose of
reducing chronic poverty or lessening income inequality.
a. The social policy is one of redistribution.
7. Imagine a person who makes $400 per week working 40 hours per week
for 50 weeks of the year. She is currently eligible for a welfare program,
available to people with income below $21,000, which gives her $800 a year.
No such program is available to people with income above $21,000 per year.
Her boss offers her a promotion that would increase her wage by 25 cents
per hour. [LO 21.5]
a. What is her total income before the promotion?
b. What is her total income if she accepts the promotion?
c. Should she accept the promotion if she wants to have higher income?
Answer:
a. Before the promotion her total income is $20,800 a year ($20,000 +
$800).
8. President Joe Nositall just published a report for his country, laying out
various scenarios for the economy in the next year. Table 21P-6 shows his
report, with various levels of GDP growth, income equality, and tax rates.
[LO 21.6]
a. Rank the scenarios from the most equal to the most unequal income
distribution (deKned as the average income of the top decile of earners
divided by the average income of the bot-tom decile of earners).
b. Rank each scenario in terms of the level of GDP growth between 2017 and
2018.
c. Between which scenarios is there no trade-off between GDP growth and
income equality?
Answer:
a. Scenarios from the most equal to the most unequal income
distribution: B, D, C, A
21-4
Copyright © 2018 McGraw-Hill Education. All rights reserved. No reproduction or distribution without the prior written consent of McGraw-Hill
Education.
Chapter 21 – Poverty, Inequality, and Discrimination
9. Which of the following are means-tested programs? [LO 21.6]
a. A local public university starts to give Knancial aid to individuals who
score above the 98th percentile on the SAT.
b. The United Kingdom decides to start giving out pension beneKts based on
individuals’ prior amount of savings.
c. A government decides to give tax credits to anyone who purchases
computers made domestically.
d. Canada begins to pay half of the cost of public transportation for people
who do not own a car.
Answer: Many programs are means-tested: They deKne eligibility for
beneKts based on recipients’ income.
a. This is not means-tested; it is a merit-based program.
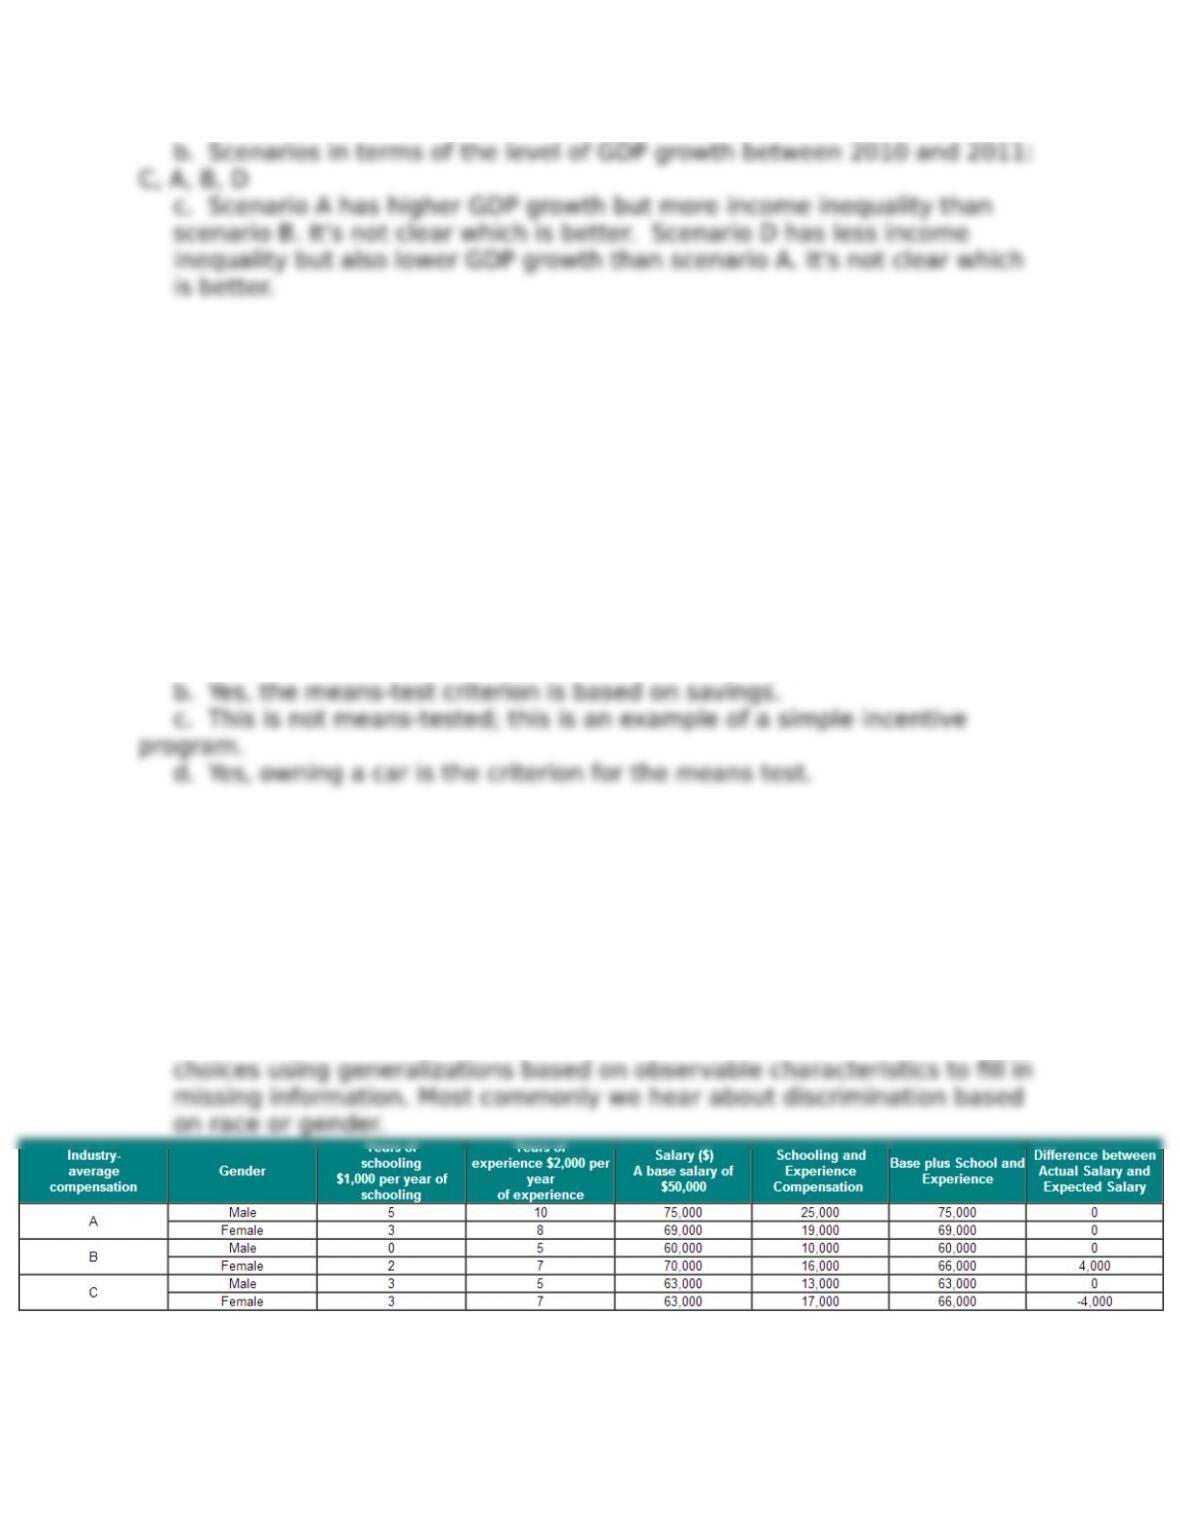
10. Table 21P-7 shows hypothetical salaries for three pairs of men and
women who share the same position. It also shows the average increase in
income associated with having certain qualities as a worker; assume these
represent the only qualities that are relevant for doing the job well. Using
these averages, determine for each pair whether there is gender
discrimination. If so, say who it is against and how large the gap is in dollar
terms. [LO 21.7]
Answer: Economists think about discrimination as the practice of making
a. There is no gender discrimination.
b. There is gender discrimination against the male, with a gap of $4,000.
21-5
Copyright © 2018 McGraw-Hill Education. All rights reserved. No reproduction or distribution without the prior written consent of McGraw-Hill
Education.
Chapter 21 – Poverty, Inequality, and Discrimination
11. Working women in the United States earn only three-quarters of what
men earn. Consider each of the following explanations for this statistic, and
say whether each could be true or must not be true in order to explain this
fact. [LO 21.7]
a. Women choose lower-paying professions (e.g., becoming a nurse rather
than a doctor).
b. Women are discriminated against when being considered for promotions
or raises.
c. Women are more educated and have more work experience than men, on
average.
d. Women are discriminated against in the hiring process.
e. Women beneKt from a@rmative action in the hiring process.
Answer: Average income for adults still varies widely across gender and
racial groups. It’s possible that these differences are due to discrimination
in the labor market. There are also plenty of other explanations: For
a. Could be true.
12. Are the workings of the free market likely to encourage or discourage
discrimination in the following examples? [LO 21.7]
a. The musical director of a symphony orchestra that records but never
performs in front of an audience refuses to hire female musicians.
b. In apartheid South Africa (where racial discrimination was legal and
popular among white voters for many decades), a white business owner
refuses to hire black candidates to work in management positions dealing
with white customers.
c. In a Martian culture in which blue hair is considered the most beautiful, a
Martian modeling agency preferentially hires blue-haired models.
Answer: Under some conditions, markets may help to eliminate
discrimination. When consumer preferences are not in agreement with the
21-6
Copyright © 2018 McGraw-Hill Education. All rights reserved. No reproduction or distribution without the prior written consent of McGraw-Hill
Education.
Chapter 21 – Poverty, Inequality, and Discrimination
a. Discourage: The talent should win out, as no one can see the members
b. Encourage: Prejudiced customers may not support a business that
c. Encourage: Blue-haired candidates have a natural advantage in hiring
13. Consider Table 21P-8, which shows several different types of goods
sold in a hypothetical town. Imagine a new competitor enters who refuses to
discriminate between locals and foreigners in hiring employees. Determine
whether the new competitor will do well in the town, given market
conditions, for each market (pajama pants, bow ties, and yo-yos). [LO 21.7]
Answer: Under some conditions, markets may help to eliminate
discrimination. When consumer preferences are not in agreement with the
discrimination (or when the discrimination is irrelevant to consumers’
preferences), markets will cause those who discriminate to lose proKtable
21-7
Copyright © 2018 McGraw-Hill Education. All rights reserved. No reproduction or distribution without the prior written consent of McGraw-Hill
Education.