Chapter 18 – Externalities
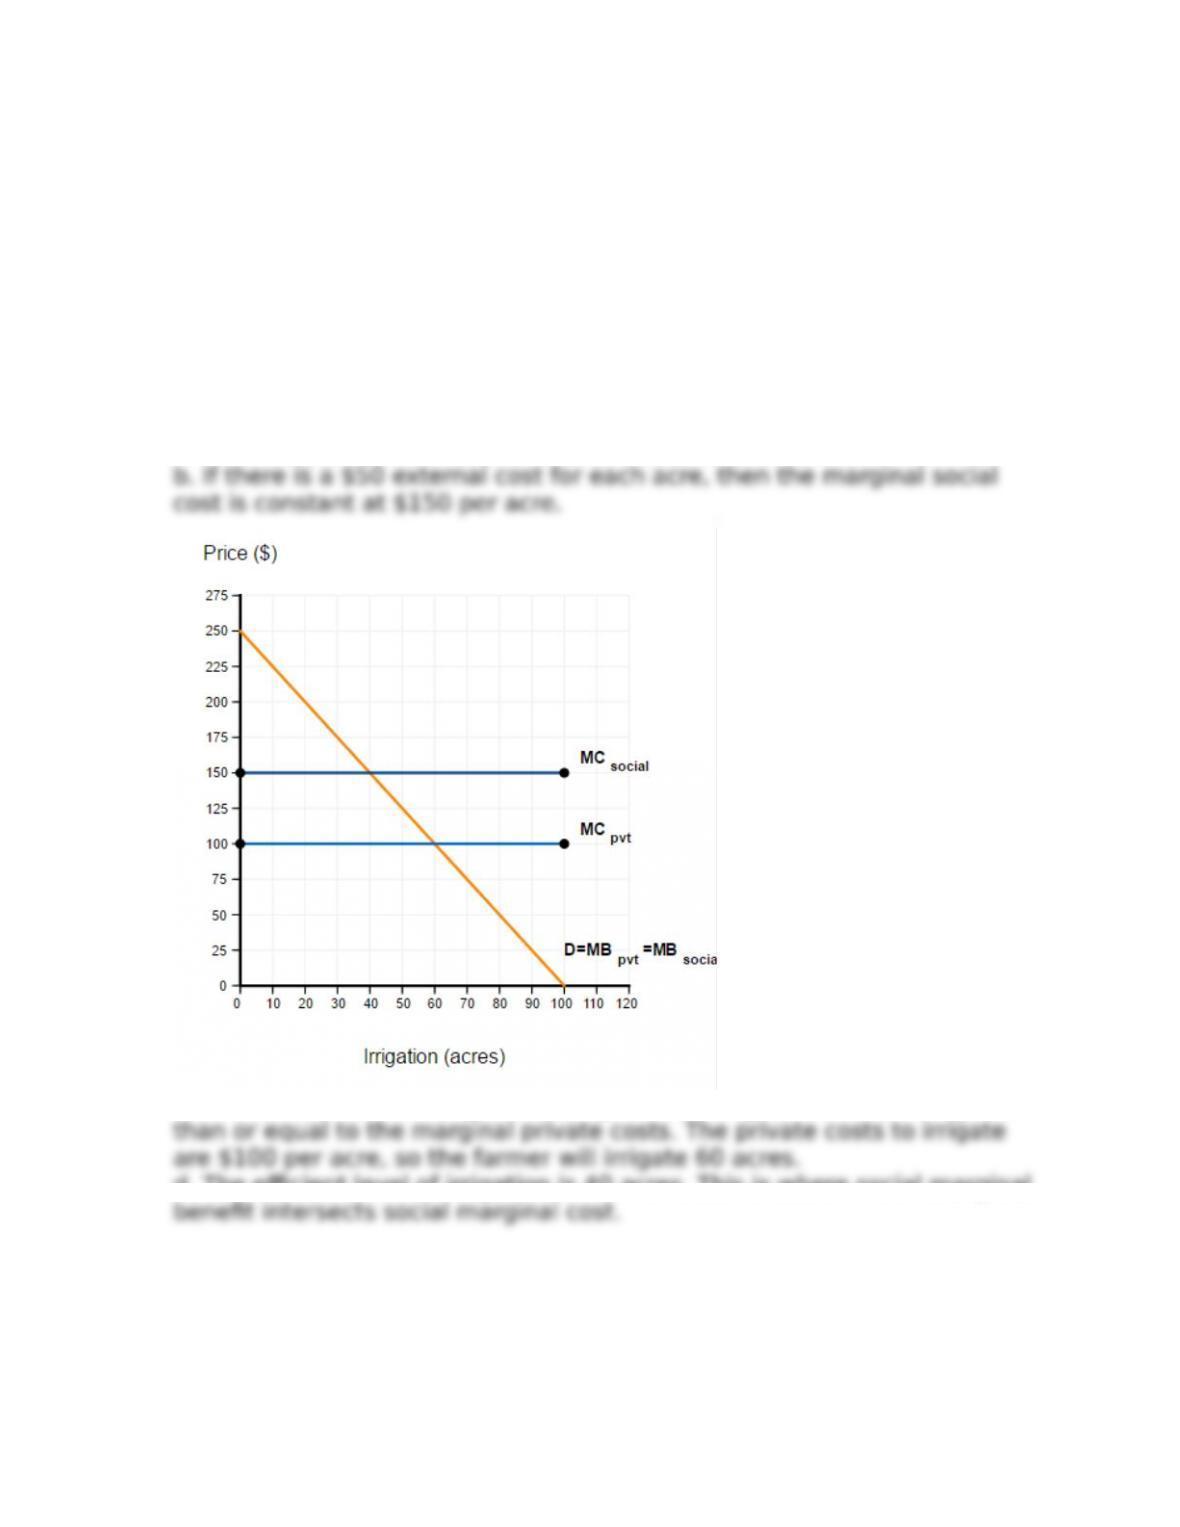
3. Figure 18P-1 shows the demand curve for a U.S. farmer for irrigating his
land. It costs the farmer $100 per acre to irrigate the land. Each acre of land
irrigation generates salty runo# that winds up in the Colorado River. It costs
$50 to desalinate this river water so Mexican farmers can irrigate their crops.
[LO 18.2]
a. Draw the marginal private cost of irrigation on the graph.
b. Draw the marginal social cost of irrigation on the graph.
c. How many acres will the U.S. farmer irrigate?
d. What is the e.cient level of irrigation?
Answer:
a. The marginal private cost is constant at $100 per acre.
c. The U.S. farmer will irrigate as long as the marginal benefit are greater
d. The e.cient level of irrigation is 40 acres. This is where social marginal
18-1
Copyright © 2018 McGraw-Hill Education. All rights reserved. No reproduction or distribution without the prior written consent of McGraw-Hill
Education.
Chapter 18 – Externalities
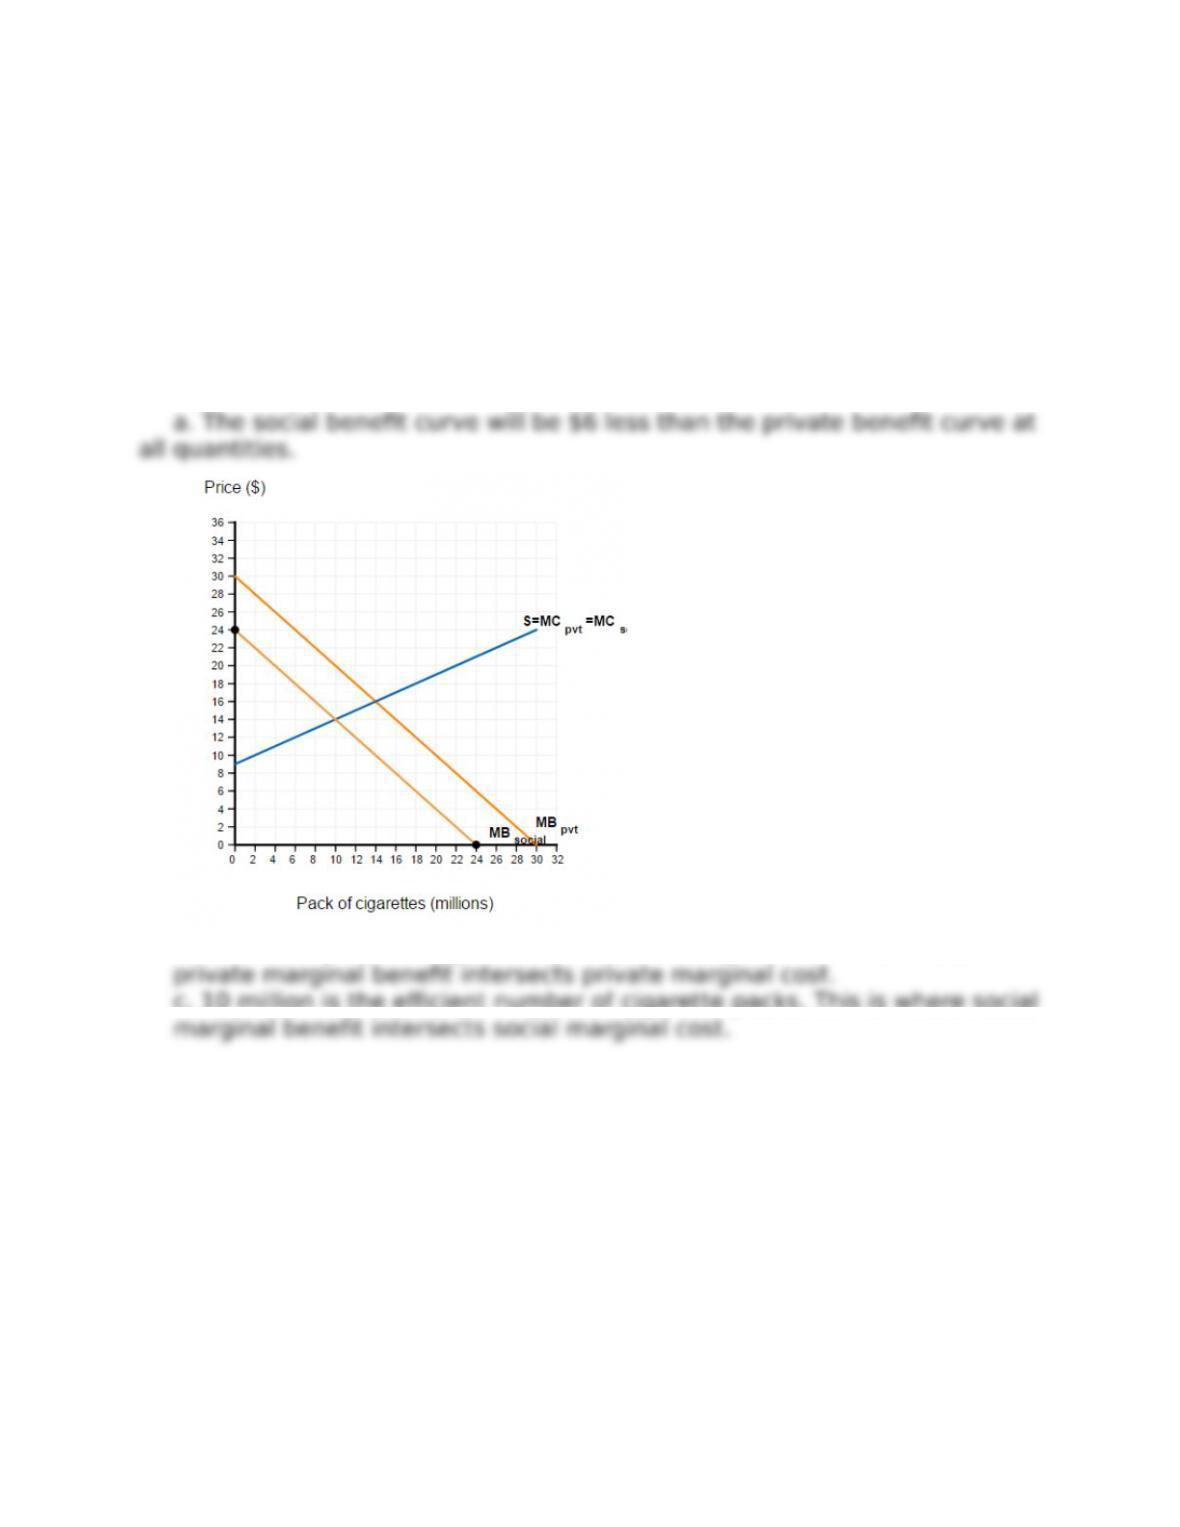
4. The weekly supply and demand for packs of cigarettes in the U.S is given
in Figure 18P-2. [LO 18.2]
a. Suppose cigarette smoking causes a $6/pack external cost on
nonsmokers. Draw the social bene1t curve that accounts for the external
cost associated with smoking.
b. Assuming the externality associated with smoking is not faced by
consumers, how many packs of cigarettes are consumed per week?
c. What is the e.cient number of cigarette packs?
Answer:
b. 14 million packs of cigarettes are consumed per week. This is where
c. 10 million is the e.cient number of cigarette packs. This is where social
18-2
Copyright © 2018 McGraw-Hill Education. All rights reserved. No reproduction or distribution without the prior written consent of McGraw-Hill
Education.
Chapter 18 – Externalities
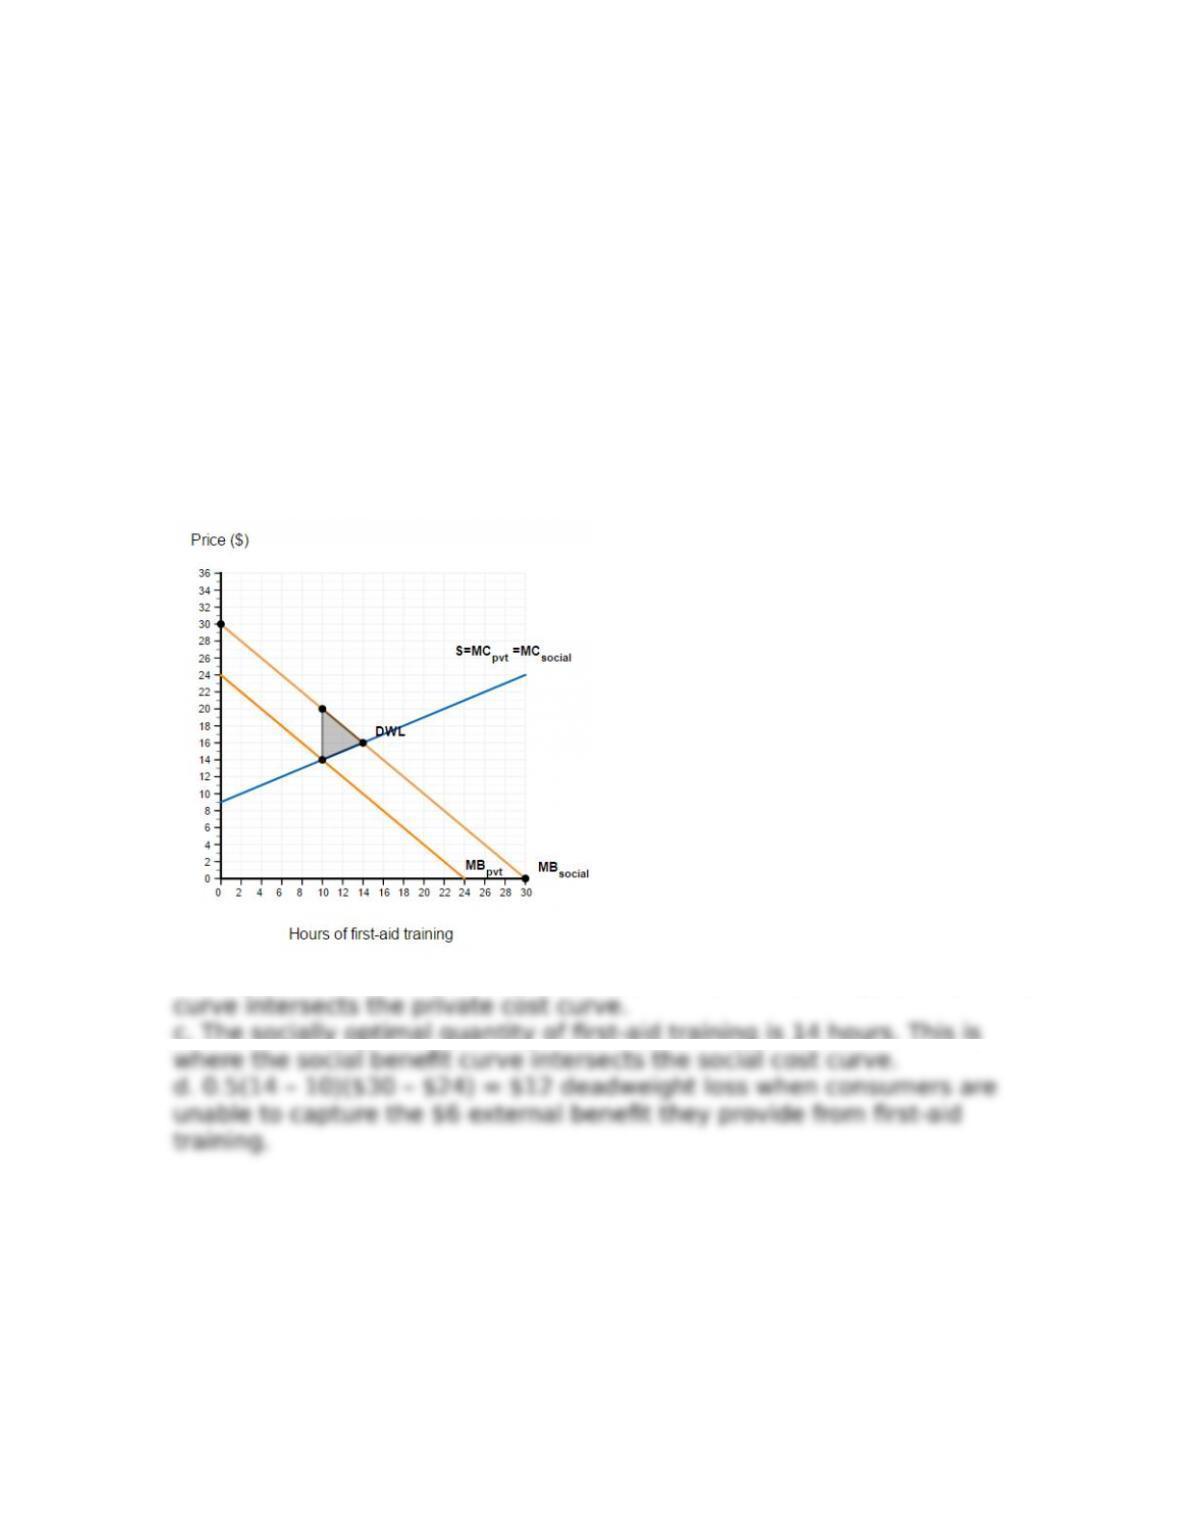
5. Figure 18P-3 shows supply and demand for 1rst-aid training, based on
private costs and benefit. [LO 18.3]
a. Suppose that the external bene1t from 1rst-aid training is worth $6. Graph
the social bene1t curve for 1rst-aid training that accounts for the external
bene1t.
b. Ignoring the social benefit of training, how many hours of 1rst-aid
training will occur?
c. What is the socially optimal quantity of 1rst-aid training?
d. What is the deadweight loss to society when consumers are unable to
capture the $6 external bene1t they provide from 1rst-aid training? Graph
the deadweight loss.
Answer:
a. The social bene1t curve is $6 higher than the private bene1t curve.
b. 10 hours of 1rst-aid training will occur. This is where the private bene1t
c. The socially optimal quantity of 1rst-aid training is 14 hours. This is
18-3
Copyright © 2018 McGraw-Hill Education. All rights reserved. No reproduction or distribution without the prior written consent of McGraw-Hill
Education.
Chapter 18 – Externalities
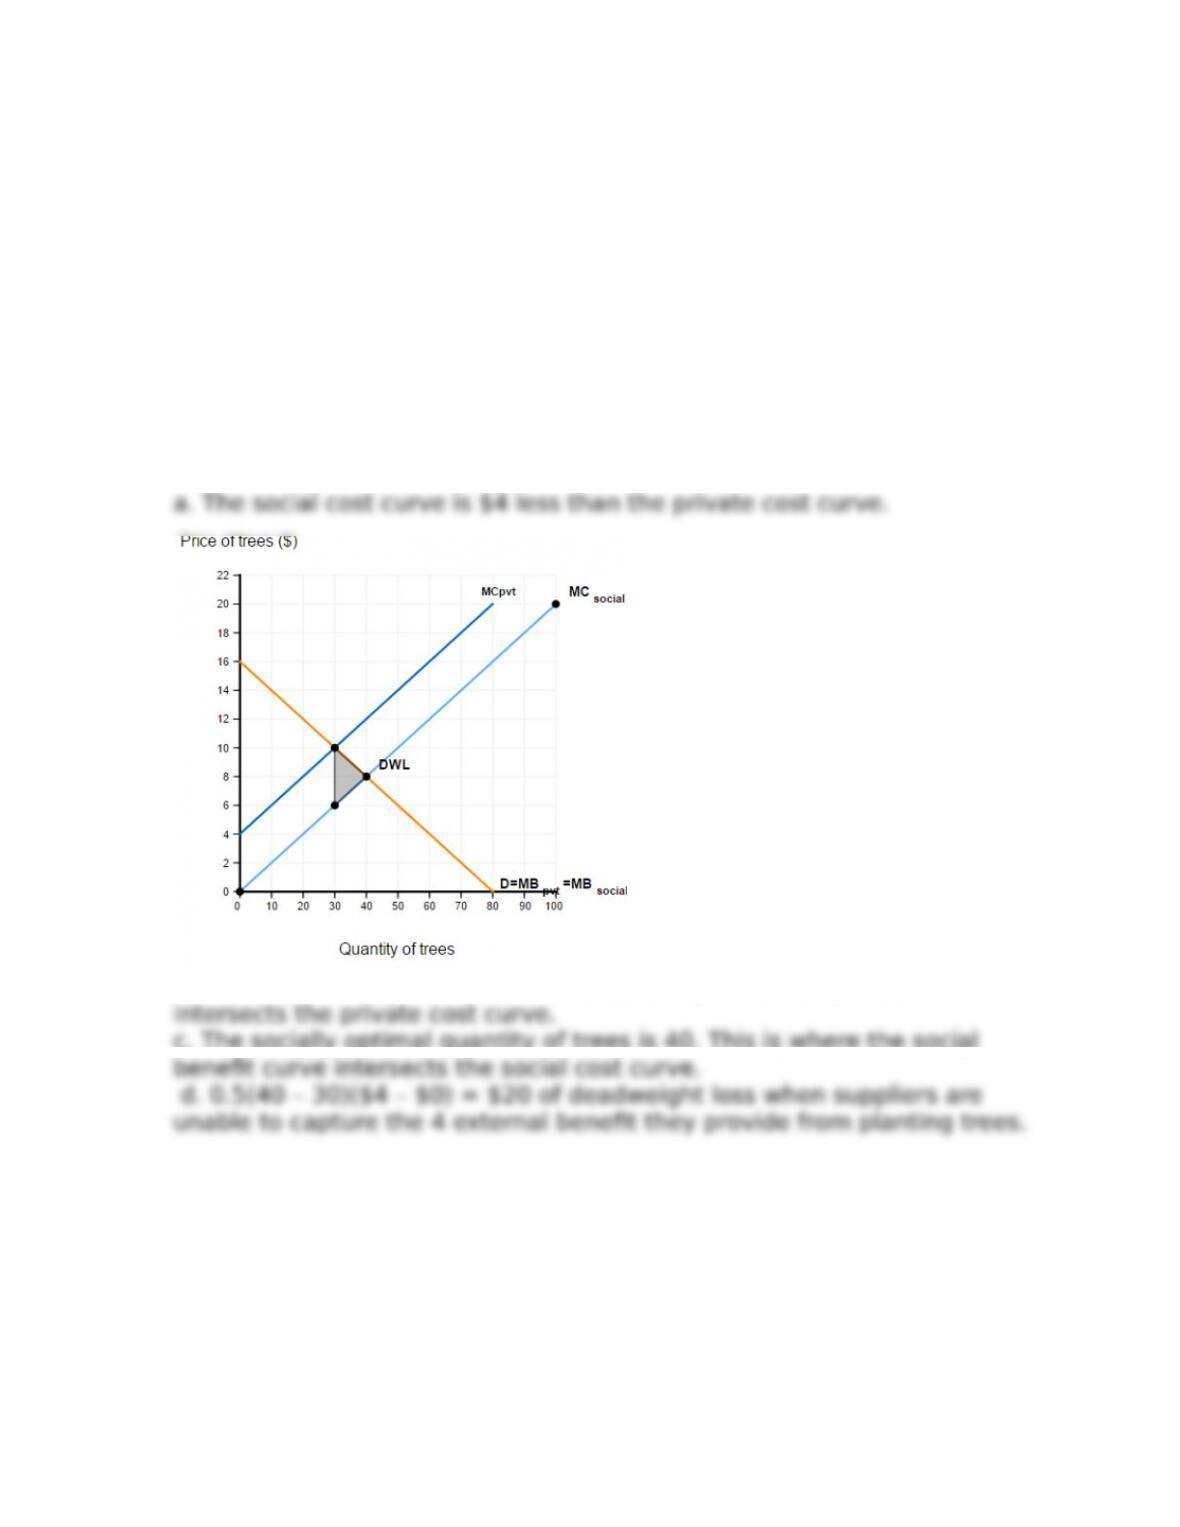
6. Figure 18P-4 shows supply and demand for planting trees, based on
private costs and benefit. Trees sequester carbon, meaning that they help
counteract pollutants that contribute to climate change. [LO 18.3]
a. Suppose that the carbon sequestration that results from planting a tree is
worth $4. Graph the social cost curve for tree planting that accounts for the
positive externality of trees.
b. Ignoring the positive externality, how many trees will be planted?
c. What is the socially optimal quantity of trees?
d. What is the deadweight loss that occurs when suppliers are unable to
capture the $4 external bene1t they provide from planting trees? Graph the
deadweight loss.
Answer:
b. 30 trees will be planted. This is where the private bene1t curve
c. The socially optimal quantity of trees is 40. This is where the social
18-4
Copyright © 2018 McGraw-Hill Education. All rights reserved. No reproduction or distribution without the prior written consent of McGraw-Hill
Education.
Chapter 18 – Externalities
7. Your neighbor never mows her lawn. You don’t have any legal right to
force her to mow, but the mess in her front yard is making your
neighborhood unsightly and reducing the value of your house. The reduction
in the value of your house is $5,000, and the value of her time to mow the
lawn once a week is $1,000. Suppose you offer her a deal in which you pay
her $3,000 to mow. How does this deal affect surplus? [LO 18.4]
a. The deal increases only your surplus.
b. The deal increases only your neighbor’s surplus.
c. The deal increases both your surplus and your neighbor’s.
d. The deal increases your surplus but decreases your neighbor’s.
e. The deal increases your neighbor’s surplus but decreases yours.
f. The deal does not affect surplus.
8. Johnston Forest in Rhode Island has a cave that houses thousands of fruit
bats. Bat droppings are highly acidic and have ruined the paint on many
cars. The Cying radius of the Johnston Forest bats encompasses two towns,
Johnston and Foster. The residents of Johnston collectively value bat removal
at $400,000. Foster residents collectively value bat removal at $500,000.
Pest control experts estimate that the cost of bat removal would be
$450,000. Which of the following scenarios would lead to removal of the
bats? Check all that apply. [LO 18.4]
a. Foster pays Johnston $50,000 to contribute to bat removal.
b. Foster and Johnston evenly split the cost of bat removal.
c. Johnston contributes nothing toward bat removal.
18-5
Copyright © 2018 McGraw-Hill Education. All rights reserved. No reproduction or distribution without the prior written consent of McGraw-Hill
Education.
Chapter 18 – Externalities
9. The local government has decided that because children’s health has
large external benefit, it will offer a subsidy to help families pay for visits to
the pediatrician. However, the government isn’t sure at what level to set the
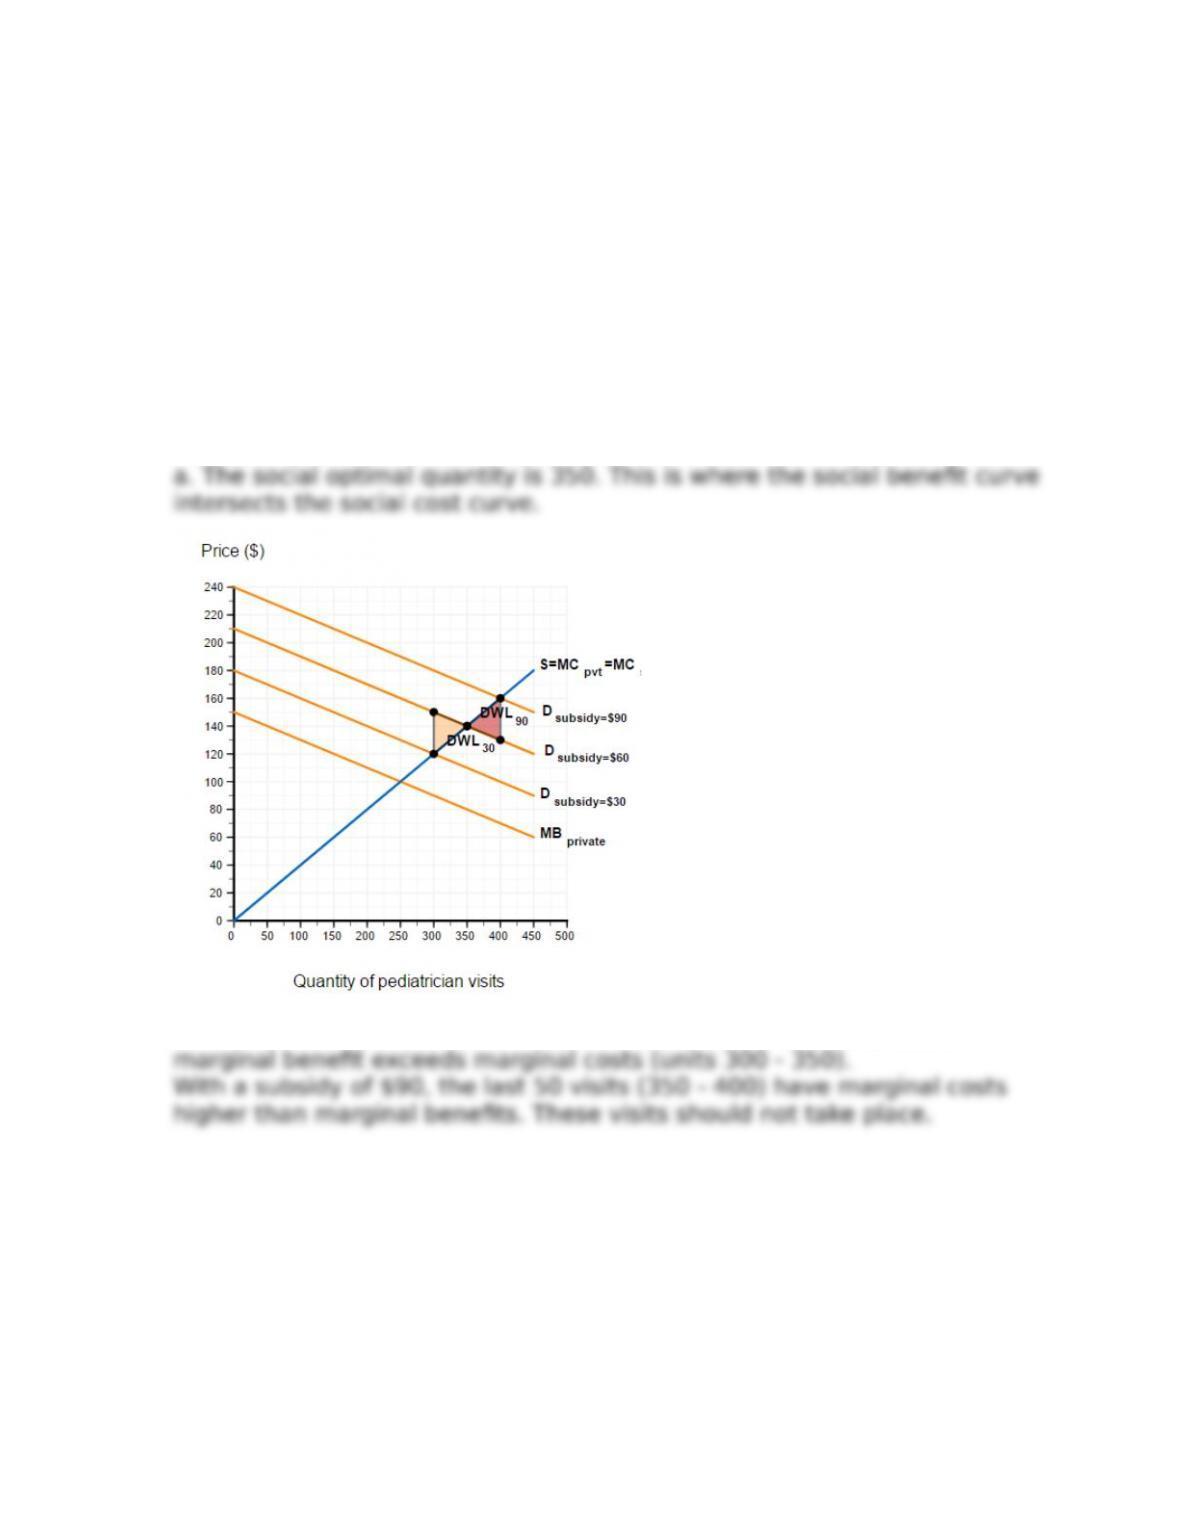
subsidy. Figure 18P-5 shows the current demand curve for pediatricians’
visits (D1), and three alternative subsidies, represented by curves D2, D3, and
D4. [LO 18.5]
a. Assume that the correct level of subsidy is D3. Compared to the e.cient
outcome, graph the loss in total surplus that would result from subsidies D2
and D4.
b. What is the socially optimal level of pediatrician visits?
Answer:
b. With a subsidy of $30, there are 50 more pediatrician visits where
18-6
Copyright © 2018 McGraw-Hill Education. All rights reserved. No reproduction or distribution without the prior written consent of McGraw-Hill
Education.
Chapter 18 – Externalities
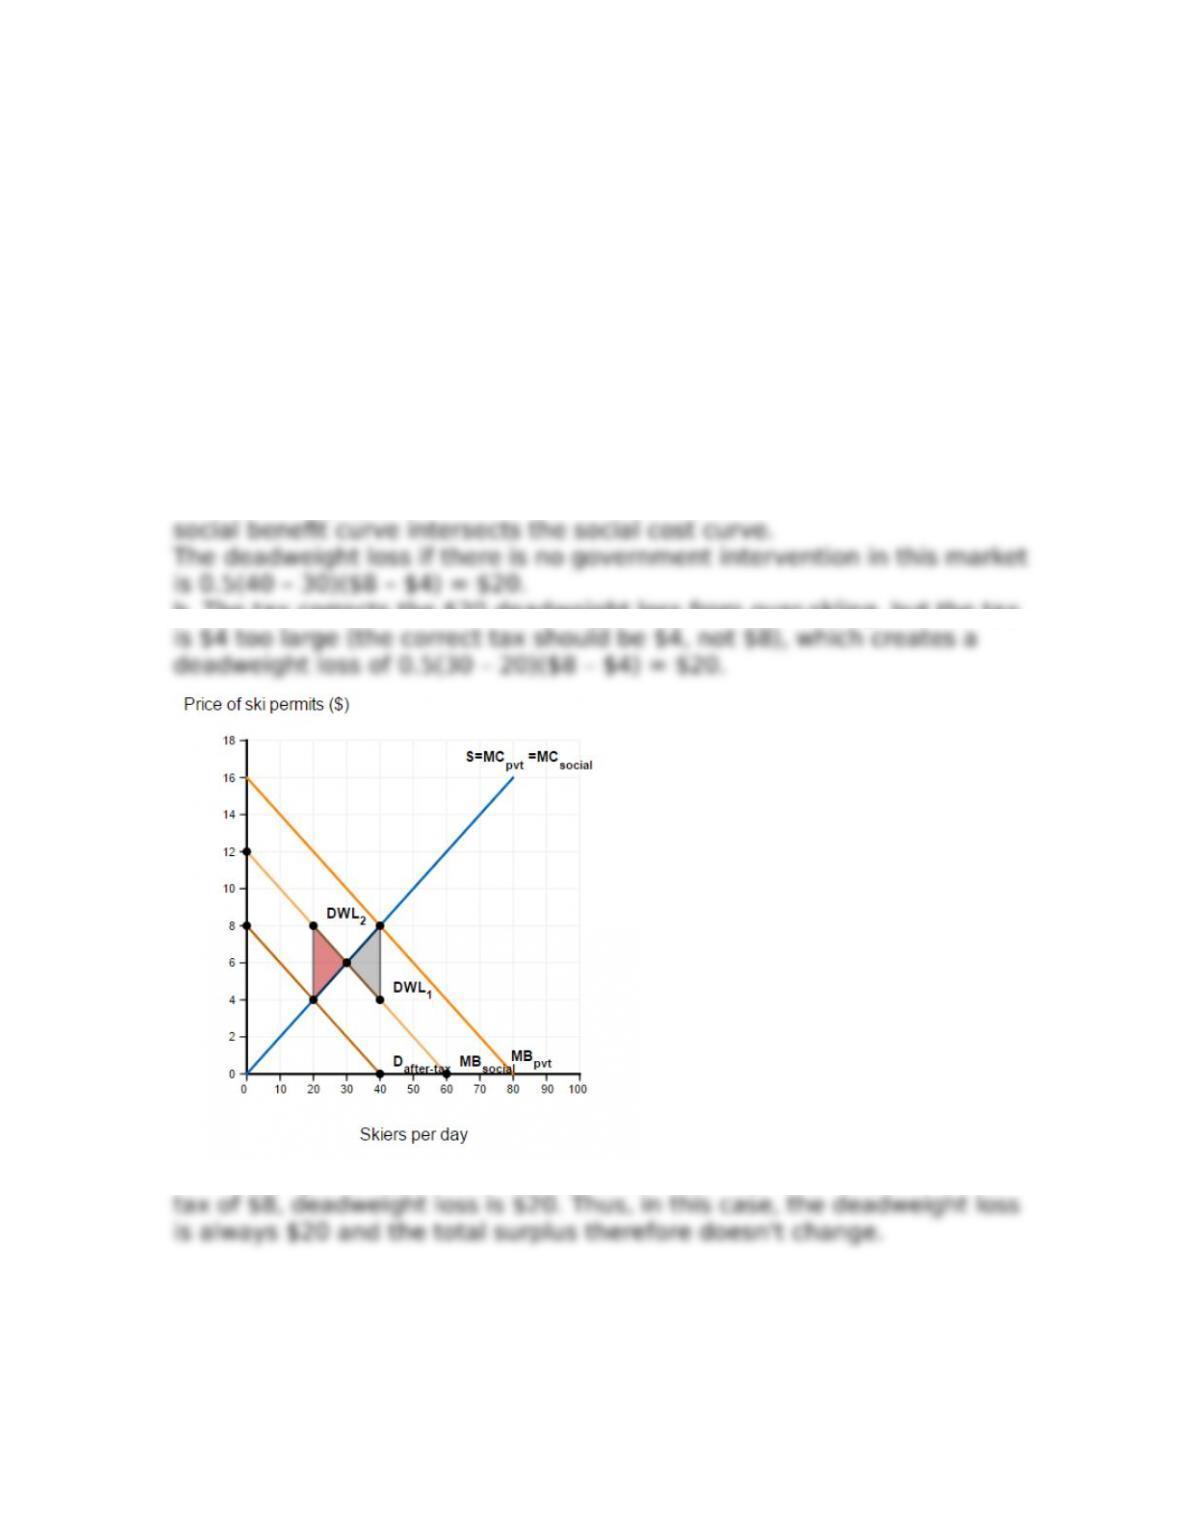
10. Figure 18P-6 shows the daily market for water skiing permits on El
Dorado Lake. Suppose each skier (each permit) causes $4 of damage to the
lake. [LO 18.5]
a. Draw the social bene1t curve that accounts for the external cost of skiers,
and draw the deadweight loss that occurs at the market equilibrium. What is
the socially optimal level of water skiing? Calculate the deadweight loss if
there is no government intervention in this market.
b. Suppose the government imposes an $8 tax on buyers of ski permits.
Draw the after-tax demand curve. Is this tax too high or too low? Draw the
deadweight loss associated with this tax.
c. Compared to no intervention, how does the tax affect total surplus?
Answer:
a. The socially optimal level of permits is 30 permits. This is where the
b. The tax corrects the $20 deadweight loss from over-skiing, but the tax
c. Without government intervention, the deadweight loss is $20. With a
18-7
Copyright © 2018 McGraw-Hill Education. All rights reserved. No reproduction or distribution without the prior written consent of McGraw-Hill
Education.
Chapter 18 – Externalities
11. Suppose certain 1reworks are legal in a residential area on the Fourth
of July. The 1reworks have been approved for safety, but they do cause noise
pollution so their use must be limited. Jenny and Salo like to purchase
1reworks for their families; Table 18P-1 shows each individual’s willingness-
to-pay for 1reworks. The price of 1reworks is $2 per 1rework. [LO 18.6]
a. If a quota of 30 1reworks per person is imposed, what is each individual’s
willingness-to-pay for their last 1rework?
b. If the government wants no more than 60 1reworks total to be purchased,
what amount of tax should be imposed? How many 1reworks will Jenny and
Salo purchase under this tax?
Answer:
a. Jenny is willing to pay $7. Salo is willing to pay $4.
12. Many municipalities are concerned about the environmental impact of
plastic bags, which often end up as litter, clogging drains and hanging from
tree branches. A town is considering whether to impose a tax on plastic bags
to be collected at the store, or a per person quota. Cindy and Carl are two
average citizens who both use plastic bags when they go grocery shopping.
Plastic bags are currently free when they shop. Figure 18P-7 shows each
individual’s demand curve for plastic bags. [LO 18.6]
a. Under the quota, what is each individual’s willingness-to-pay for the last
bag used?
b. How many bags will each shopper use under the tax? What is each
individual’s willingness-to-pay for the last bag used under the tax?
c. Would you recommend that the town adopt a plastic-bag quota or tax?
Answer:
a. The willingness to pay for the last bag used is $0.30 for Carl and $0.60
for Cindy.
18-8
Copyright © 2018 McGraw-Hill Education. All rights reserved. No reproduction or distribution without the prior written consent of McGraw-Hill
Education.