Unlock document.
This document is partially blurred.
Unlock all pages and 1 million more documents.
Get Access
Chapter 13 - Equity Valuation
CHAPTER THIRTEEN
EQUITY VALUATION
CHAPTER OVERVIEW
This chapter discusses models to calculate the intrinsic value of common stock. Balance sheet
models, dividend discount models (DDMs), Price/Earnings ratios and free cash flow models are
presented. These are models used in fundamental analysis rather than technical analysis. The
strengths and weaknesses of these techniques are presented and discussed.
LEARNING OBJECTIVES
After studying this chapter, the student should be able to value a firm using either a constant
CHAPTER OUTLINE
1. Equity Valuation
PPT 13-2 through PPT 13-3
Book value is the value of common equity on the balance sheet. It is based on historical values of
assets and liabilities, which may not reflect current values. Some assets such as brand name or
specialized skills are not even on a balance sheet. Using a market value of equity to book ratio
is thought to be a measure of market valuation over the book value, presumably due to future
growth opportunities of the firm. Some believe that if the market to book is less than one it
indicates an undervalued security that should be purchased. There are unlikely to be very many
of these firms and one would have to examine them further to avoid firms that are
underperforming for a good reason. Liquidation value is the net amount realized from sale of
assets and paying off all debt. The firm becomes a takeover target if the market value of stock
falls below this amount, so liquidation value may serve as a floor value. Tobin’s Q = Market
Value/Replacement Cost; and this ratio should tend toward 1 over time. This ratio may put a
ceiling on market value in the long run because values above replacement cost will attract new
entrants into the market.
Chapter 13 - Equity Valuation
2. Intrinsic Value versus Market Price
PPT 13-4 through PPT 13-6
Underlying the process of fundamental analysis is the concept of intrinsic value. The intrinsic
value is the value that the analyst places on a stock. It establishes the basis for a trading signal.
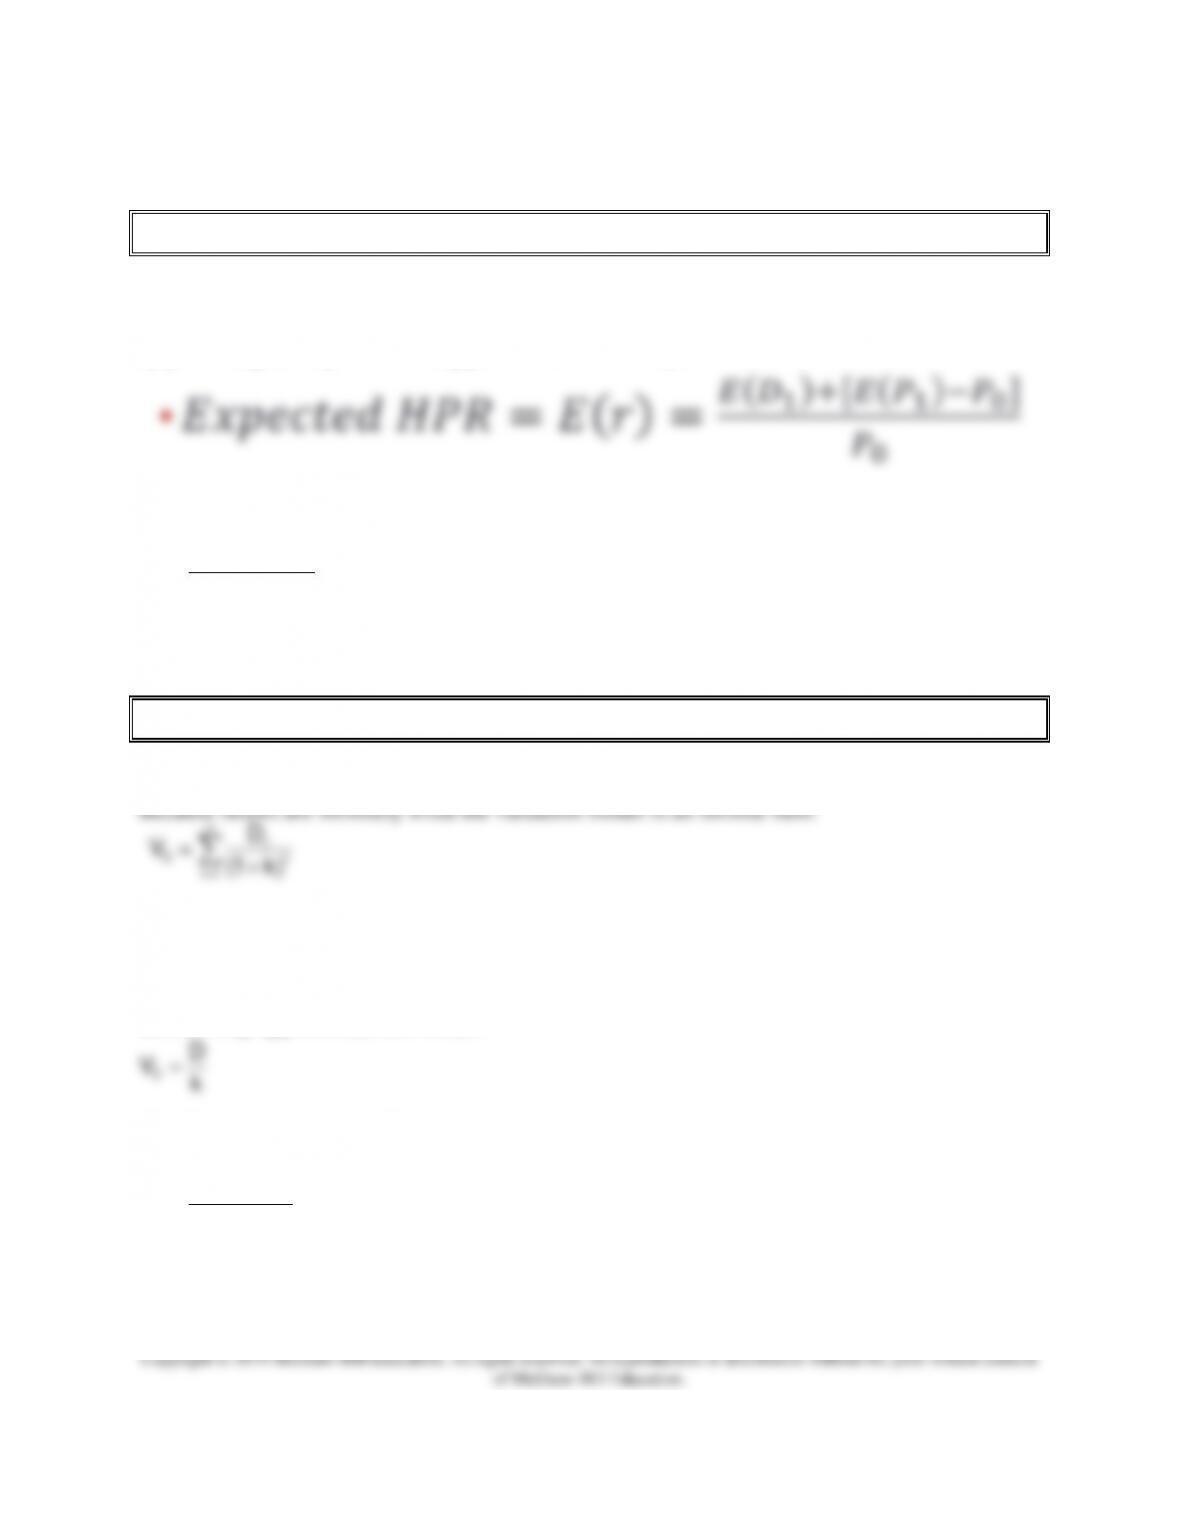
An intrinsic value can be estimated using a variety of models or approaches. The section starts
by presenting the expected holding period return for one year:
Intrinsic value (V0) is the present value of all expected future cash flows discounted by a risk
adjusted required return. Based on a one year holding period one can estimate value with:
Comparing intrinsic value and market price can generate buy or sell signals.
3. Dividend Discount Models
PPT 13-7 through PPT 13-13
The intrinsic value equation can be generalized to multiple periods by realizing that E(P1) (the
sale price in time 1) is the present value of expected future dividends after the time of sale.
This equation is not useable because it is an infinite sum of variable cash flows. Therefore one
must make assumptions about the dividends to make the model tractable. If a firm’s earnings and
dividends are not expected to grow in the foreseeable future, the value of the stock can be
estimated using the no growth model. Preferred stock exactly fits this model although regulated
utilities may approximate this model:
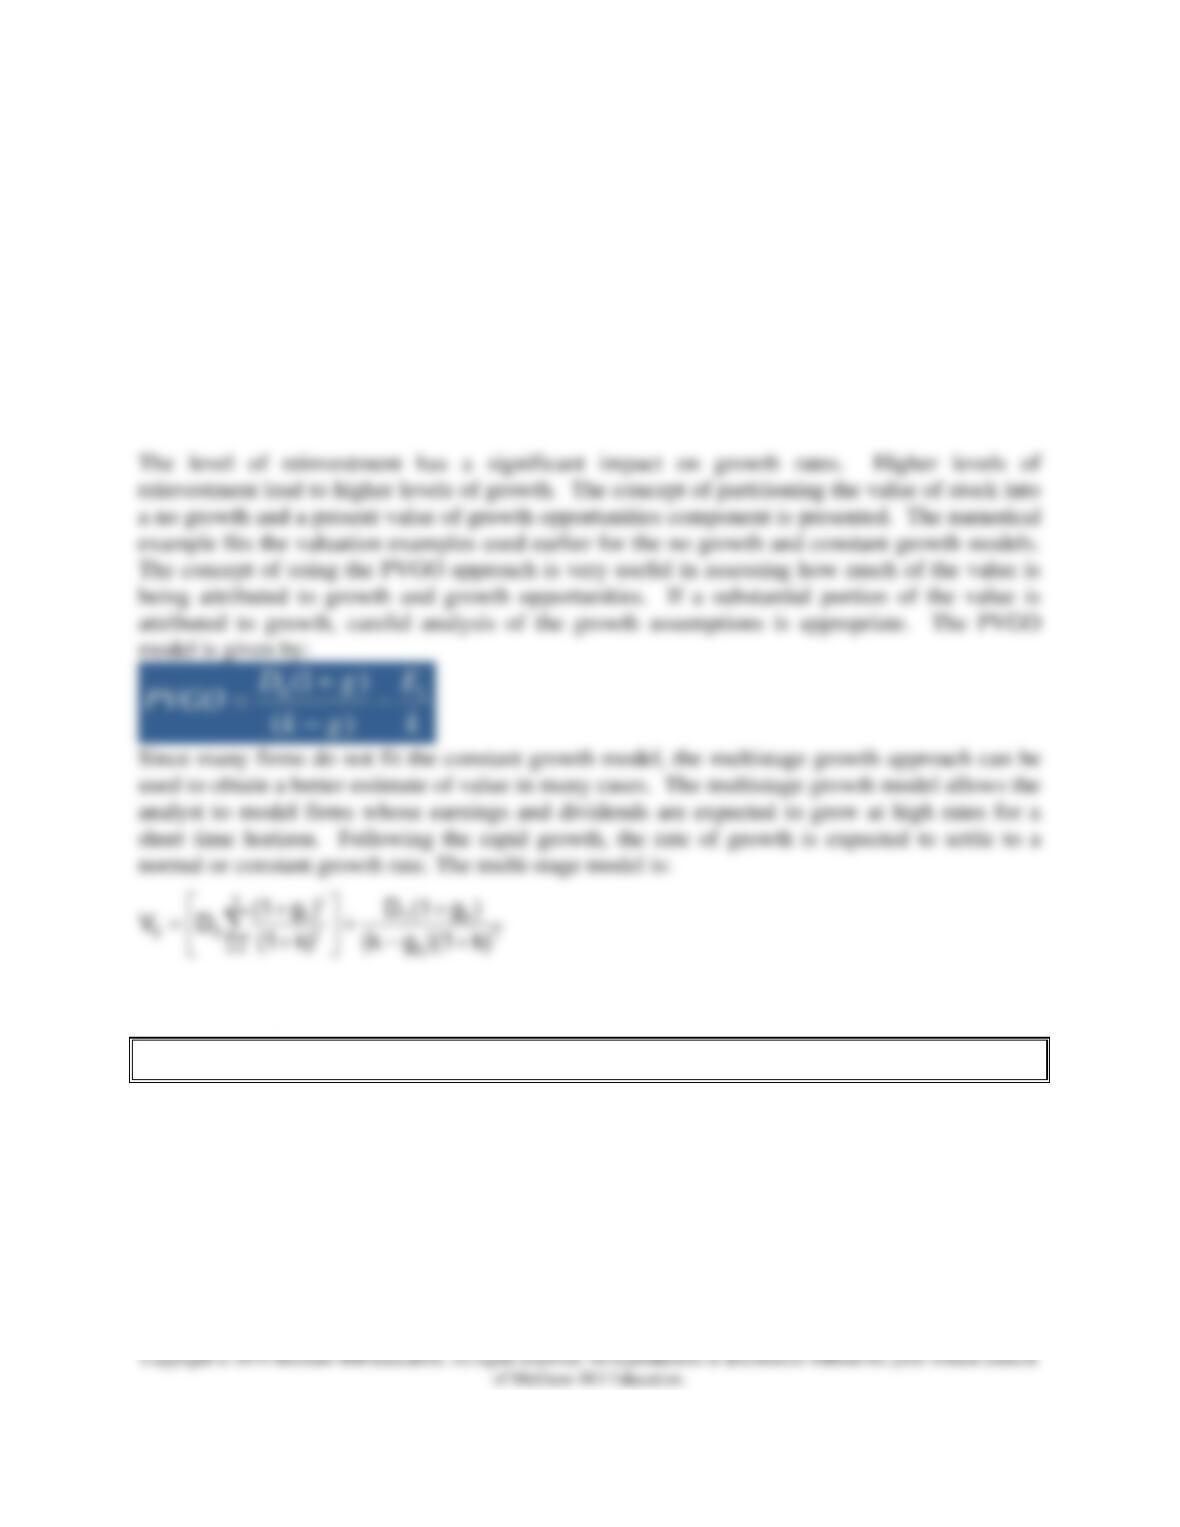
If a firm’s earnings and dividends are expected to grow at a constant rate in the foreseeable
future, the general model simplifies to the constant growth model.
k1
)P(E)D(E
V11
0+
+
=
=+
1t t
dividends in rate growth perpetualg;
g-k
)g1(D
V0
0=
+
=
Chapter 13 - Equity Valuation
The growth rate that is used in the constant model is a long-term and permanent growth rate.
Students often are not clear on this concept. The approach to estimating growth using return on
equity and retention rates only applies if current measures are reasonable estimates for long term
values and this is a key point that the instructor should stress.
Stocks with high growth cost more. In other words one must pay for expected growth. This
does not necessarily mean these stocks will have better returns to investors. Buying stocks that
have high expected growth is risky, because if the growth does not occur, the stock’s price will
collapse.
4. Price Earnings Ratios
PPT 13-14 through PPT 13-20
An alternative approach to using the dividend growth model approach is to use a P/E approach.
The P/E method is used extensively in industry and is helpful in comparing relative values of
firms, particularly with respect to future growth opportunities. The appropriate P/E is a function
of two factors; the required rate of return and expected growth in earnings, with the latter
dominating. While the P/E appears easier to use, the same estimates that apply to the dividend
discount approach apply to the P/E approach. The appropriate P/E multiple depends on growth
and is really a version of the dividend discount mode.
Chapter 13 - Equity Valuation
The price earnings ratios that are presented in the chapter are based on next year’s expected
earnings. The P/E ratios that are reported in the financial press are often based on historical
earnings. Both measures of Price/Earnings ratios are used in industry but theoretically the P/E
should be based on forward or next year’s earnings. A higher P/E ratio generally implies a
higher expected future growth rate of earnings and if the earnings growth does not materialize,
the P/E will eventually fall, generating losses for investors.
Riskier stocks, all else equal, will have lower P/E multiples as riskier firms will have a higher
required rate of return. Some analysts look at the PEG ratio, which is the P/E ratio divided by
the expected growth rate of earnings and dividends. Since the P/E is a proxy for growth, some
investors believe that stocks with a PEG less than one are a good buy.
Alternative valuation models and ratios are presented. With the price-to-book a high ratio
indicates a large premium over book value, and a ‘floor’ value that is often far below market
price. The price-to-cash flow ratio may be used instead of P/E because the former is less subject
to accounting manipulation. The price-to-sales ratio is useful for firms with low or negative
earnings such as firms in the early growth stage. Analysts may have to be creative and identify
the key variables in an industry.
5. Free Cash Flow Valuation Approaches
PPT 13-21 through PPT 13-30
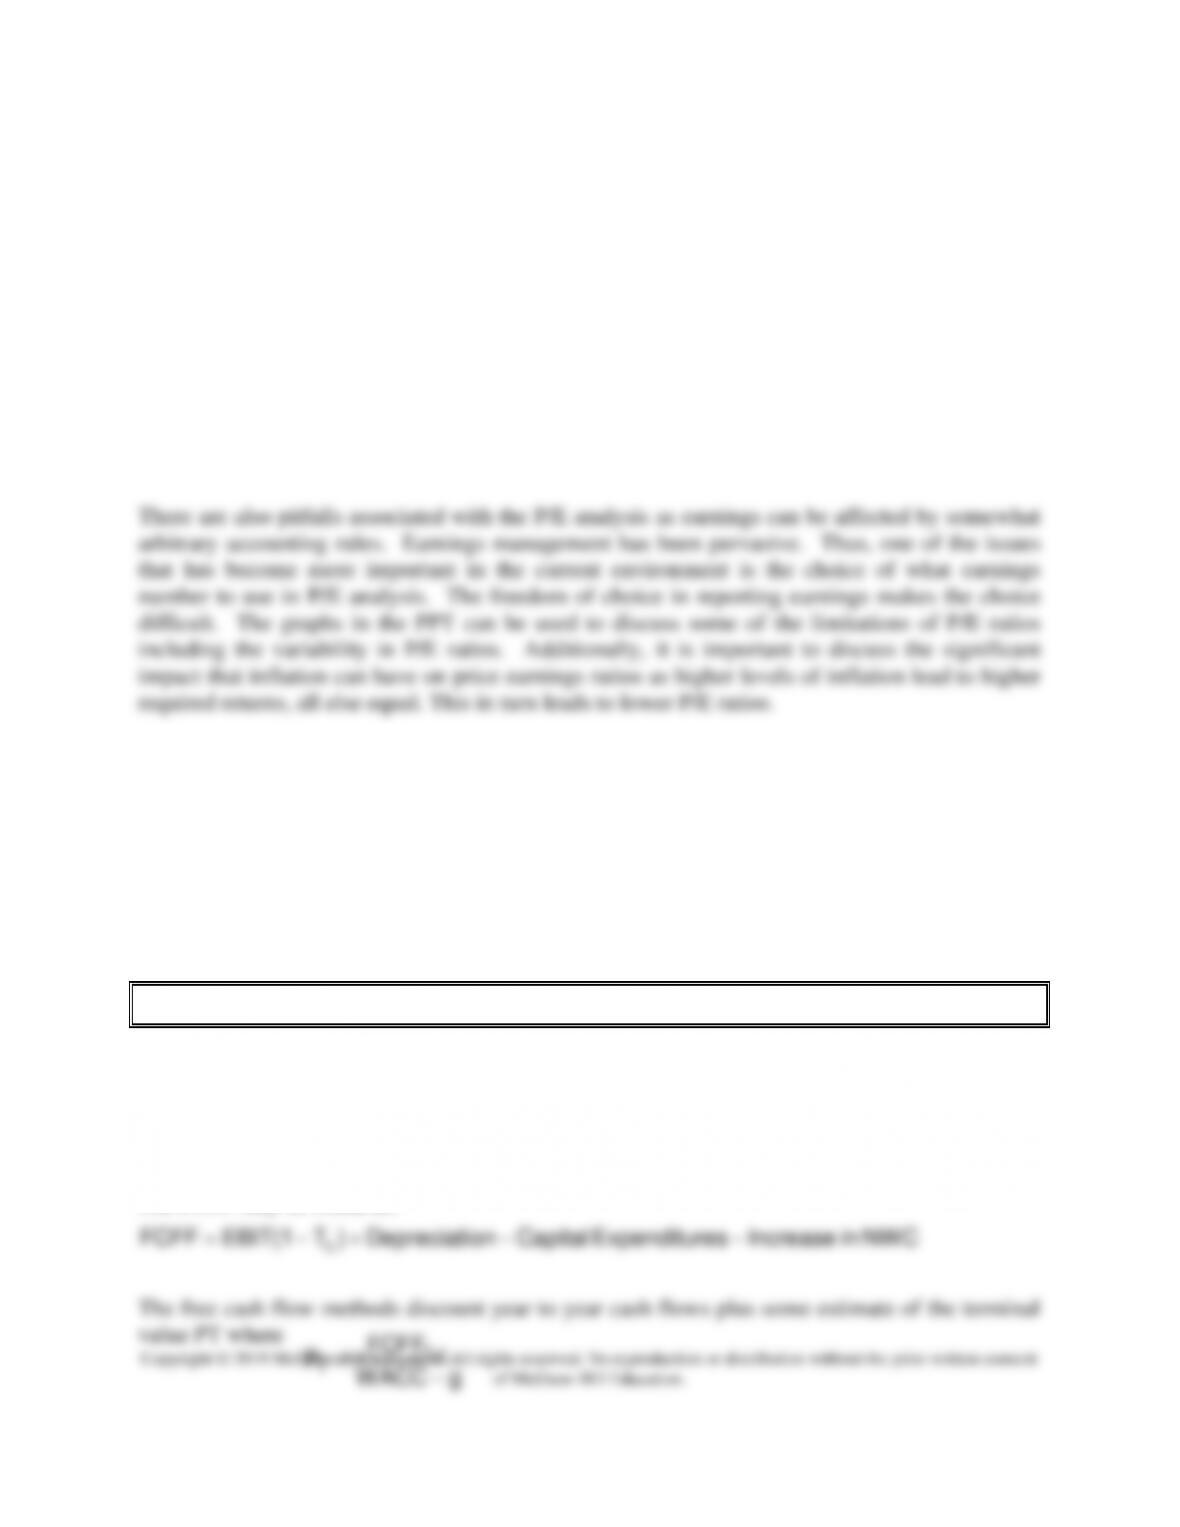
An alternative approach to the dividend discount model values the firm using free cash flow.
One approach uses the free cash flow for the firm (FCFF) discounted at the weighted-average
cost of capital. The value of equity is then found by subtracting the existing market value of
debt. A similar approach focuses on the equity holders and discounts cash flows directly at the
cost of equity to obtain the market value of the firm equity. These methods are useful for firms
that don’t pay dividends, and are very helpful to understand sources and uses of cash.
The FCFF may be found as:
Chapter 13 - Equity Valuation
Equity residual free cash flows (FCFE) can be directly calculated with the following:
In theory free cash flow approaches should provide the same estimate of intrinsic value as the
dividend growth model. In practice the various approaches often differ substantially.
Simplifying assumptions are used in all models and the details may vary slightly in the different
approaches. At best the models establish ranges of likely intrinsic value and using multiple
models forces rigorous thinking about the inputs.
6. The Aggregate Stock Market
PPT 13-31 through PPT 13-33
The most popular approach for forecasting the overall market is to use the earnings multiplier
technique applied to aggregate earnings. The earnings multiplier approach takes a forecast of
corporate profits for the coming period for an index such as the S&P500. Derive an estimate for
the aggregate P/E ratio using long-term interest rates. This can be done based on the relationship
between the ‘earnings yield’ or E/P ratio for the S&P 500 and the yield on 10 year Treasuries.
This graph is depicted in the PPT. The product of the two forecasts is the estimate of the end-of-
period level of the market.
Excel Applications
This chapter contains an Excel exhibit that allows calculation of a two-stage and multi-stage
dividend stock price. The multi-stage model makes it easier to apply the valuation concepts to a
larger group of firms.
Debt Net in Increase)TExpense(1 InterestFCFFFCFE C+−−=


