Solutions to Questions – Chapter 9
Income-Producing Properties: Leases, Rents, and the Market for Space
Question 9-1
How does the use of leases shift the risk of rising operating expenses from lessor to the lessee?
Question 9-2
What is the difference between base rents and effective rents?
Question 9-3
What is meant by usable vs. rentable space?
Question 9-4
What are CAM charges?
Question 9-5
What are (a) pass through expenses, (b) recoverable expenses, (c) common area expenses? Give examples of each.
Question 9-6
What is an estoppel? Why is it used?
Question 9-7
What is meant by “loss to lease”?
Question 9-8
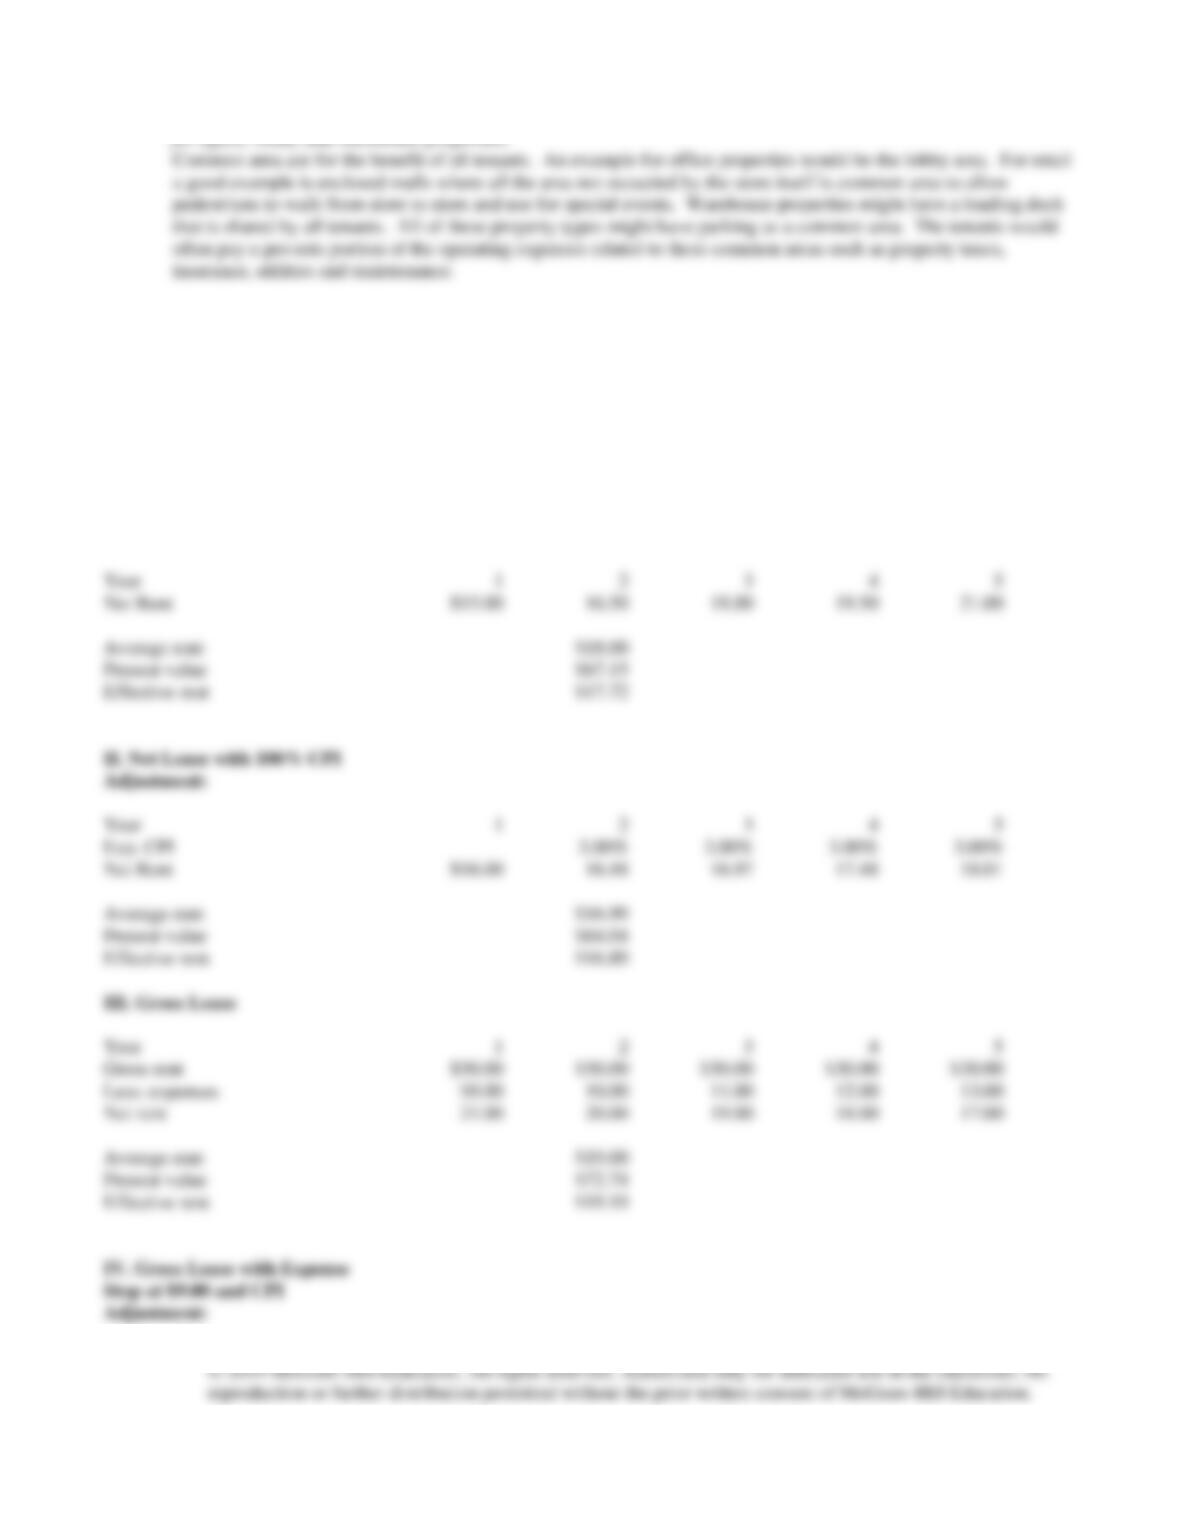
Adjustment:
Year
1
2
3
4
5
Exp. CPI
Net Rent
$16.00
16.48
16.97
17.48
18.01
Average rent
$16.99
Present value
$64.04
Effective rent
$16.89
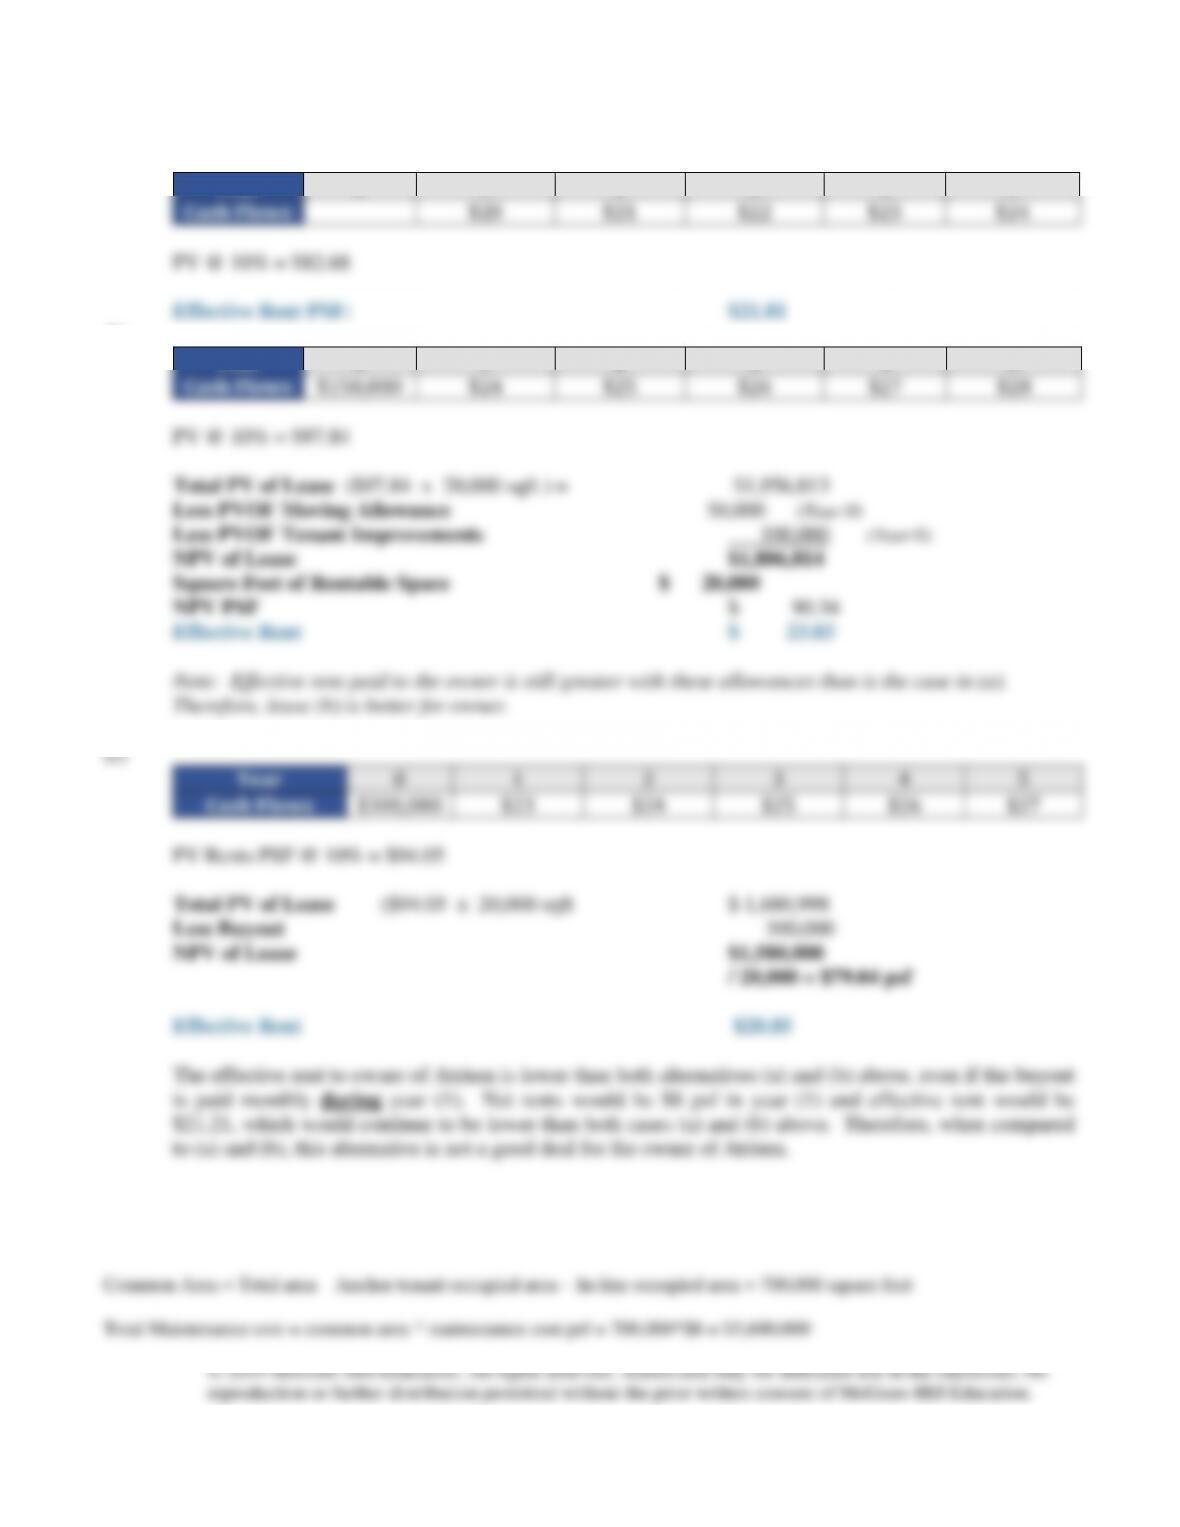
III. Gross Lease
Year
1
2
3
4
5
Gross rent
$30.00
$30.00
$30.00
$30.00
$30.00
Less: expenses
10.00
11.00
12.00
13.00
Net rent
21.00
20.00
19.00
18.00
17.00
Average rent
$19.00
Present value
$72.74
Effective rent
$19.19
Adjustment:
What types of expenses would property owners pay when operating and maintaining common areas? Give examples
for office, retail, and warehouse properties.
Solutions to Problems – Chapter 9
Introduction to Income-Producing Properties: Leases and Market for Space
Problem 9-1
a)
Discount rate
10.00%
I. Net Lease with Steps:
Year
1
2
3
4
5
Net Rent
$15.00
16.50
18.00
19.50
21.00
Average rent
$18.00
Present value
$67.15
Effective rent
$17.72
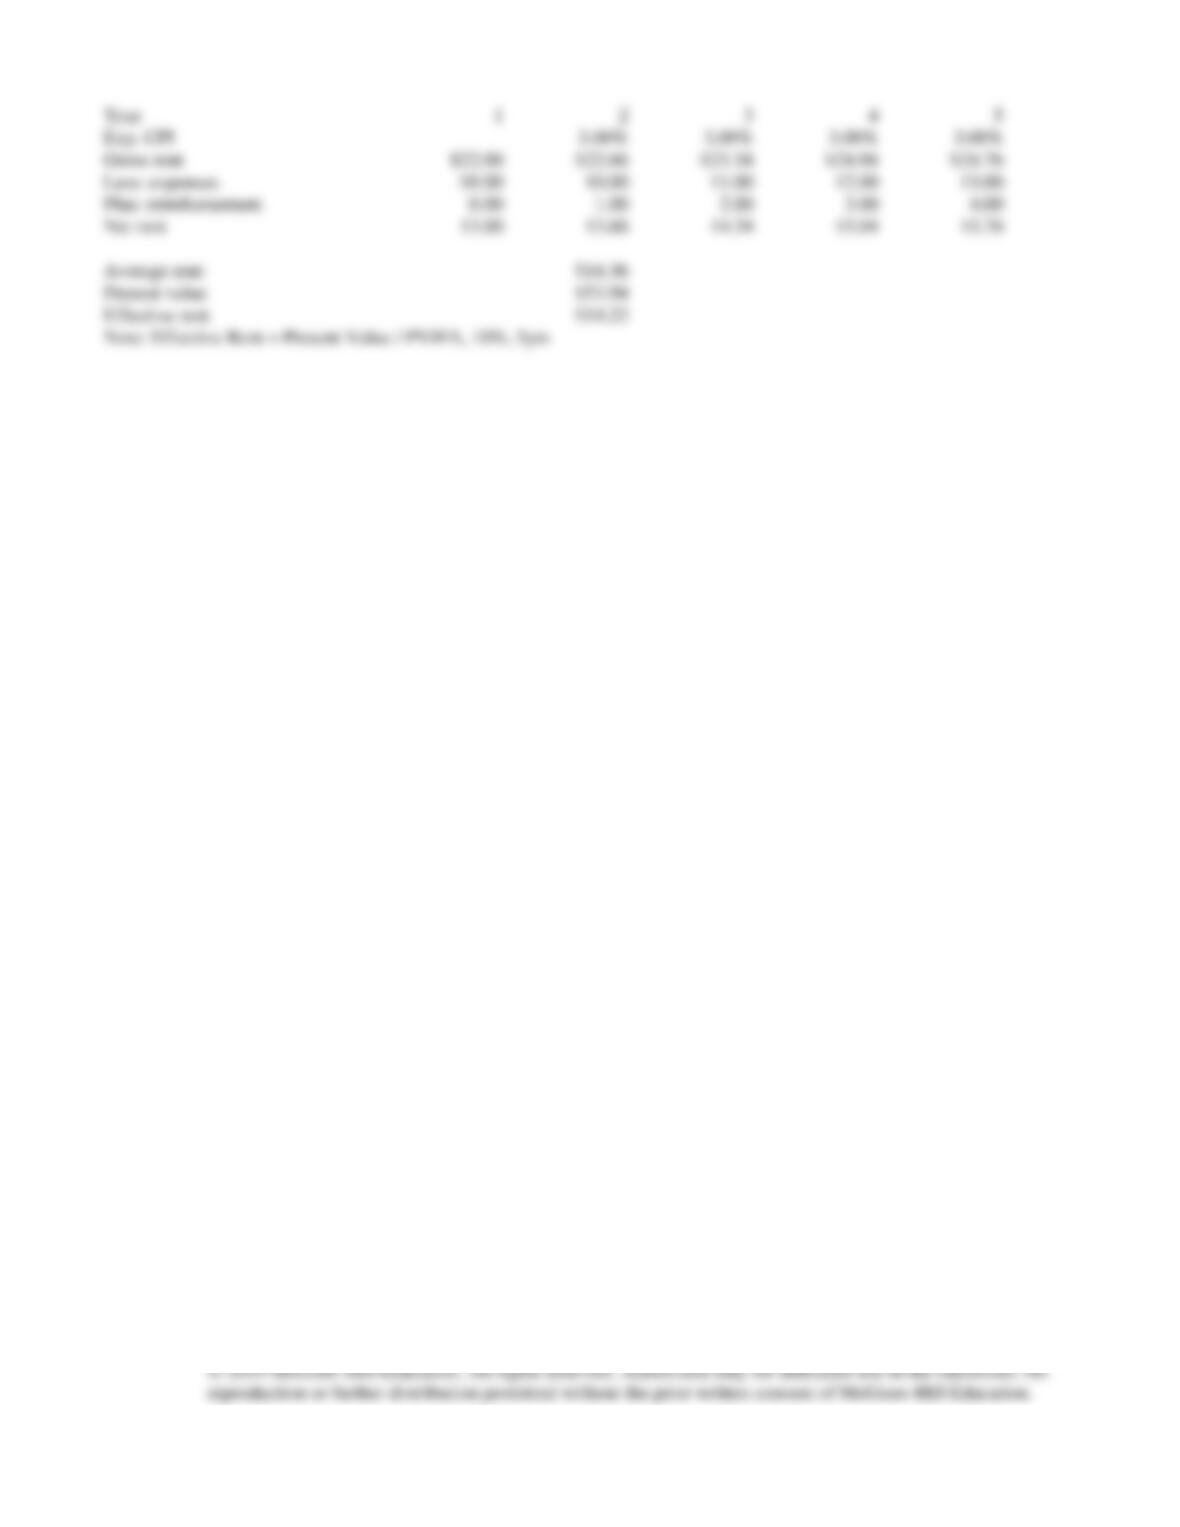
Year
1
2
3
4
5
Exp. CPI
3.00%
3.00%
3.00%
3.00%
Gross rent
$22.00
$22.66
$23.34
$24.04
$24.76
Less: expenses
$9.00
10.00
11.00
12.00
13.00
Plus: reimbursement
0.00
1.00
2.00
3.00
4.00
Net rent
13.00
13.66
14.34
15.04
15.76
Average rent
$14.36
Present value
$53.94
Effective rent
$14.23
Note: Effective Rent = Present Value / PVIFA, 10%, 5yrs
Problem 9-2
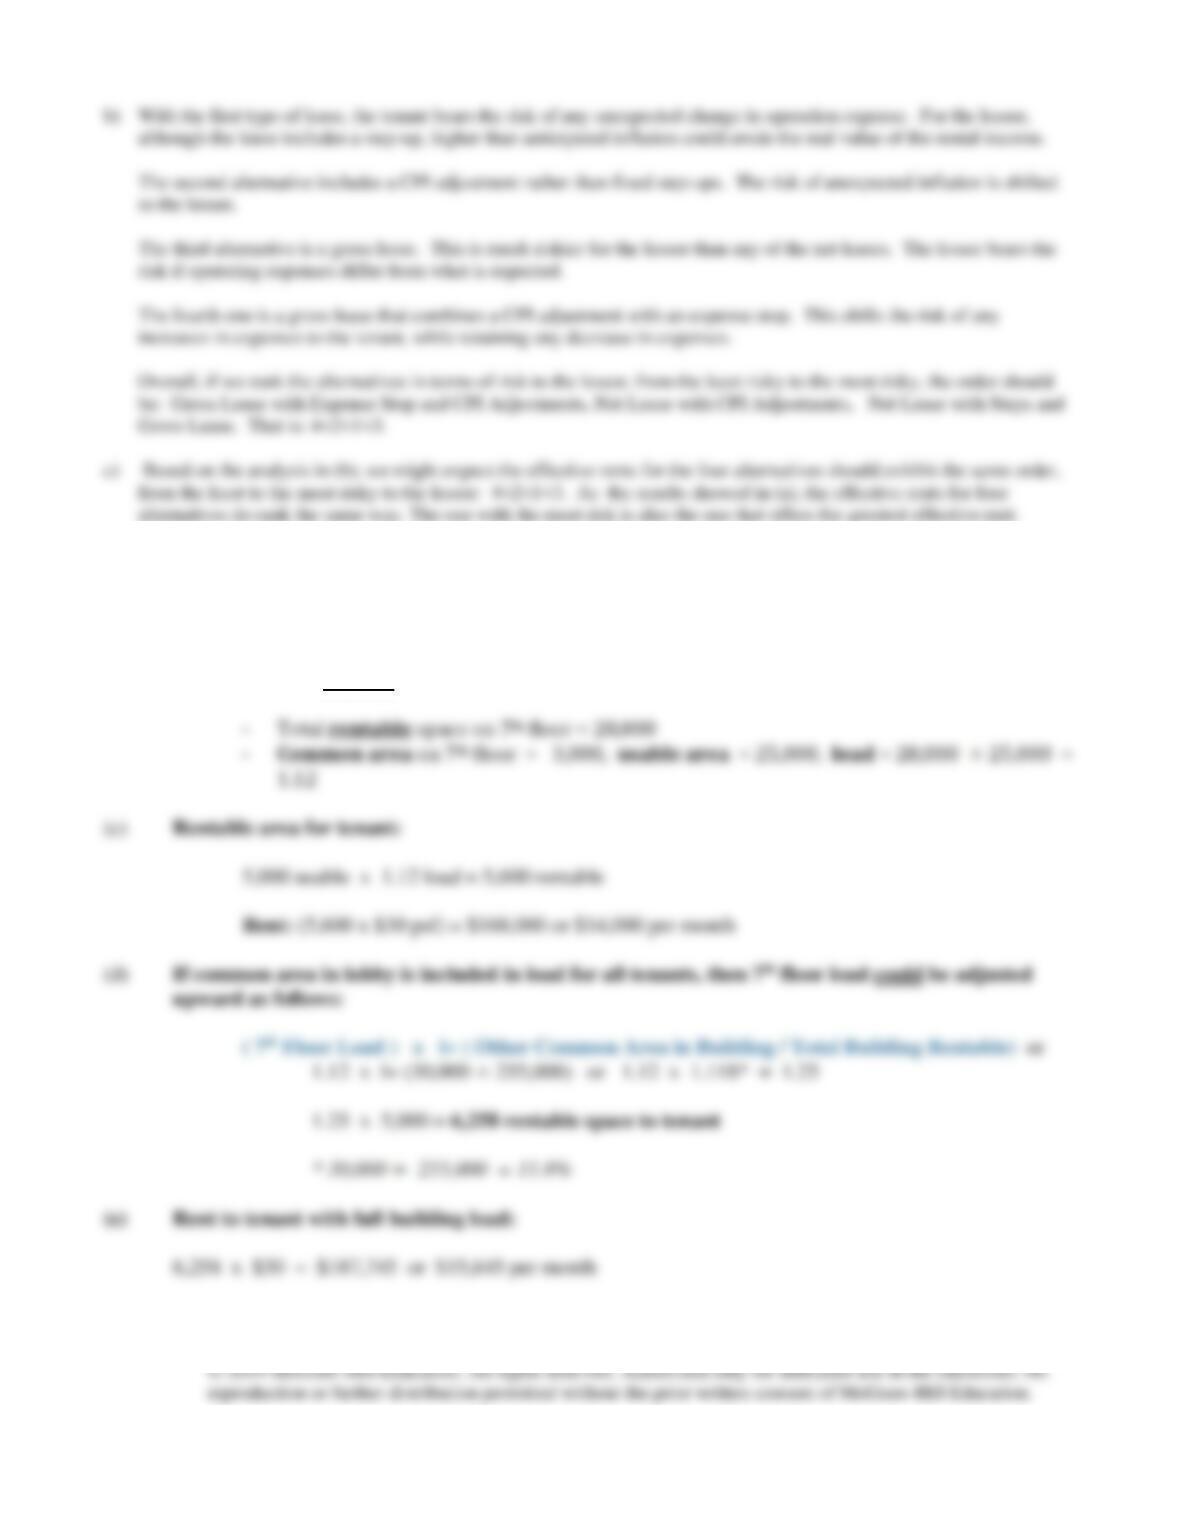
(a) Total rentable area in building if leased to one tenant:
300,000 (total building area) – 45,000 (non-rentable area) = 255,000 sqft (rentable)
(b) Load Factor for 7th floor:
0
1
2
3
4
5
$23
$24
$25
$26
Problem 9-3
(a)
Year
0
1
2
3
4
5
Cash Flows
$20
$21
$22
$23
$24
(b)
Year
0
1
2
3
4
5
Cash Flows
$150,000
$24
$25
$26
$27
$28
Problem 9-5
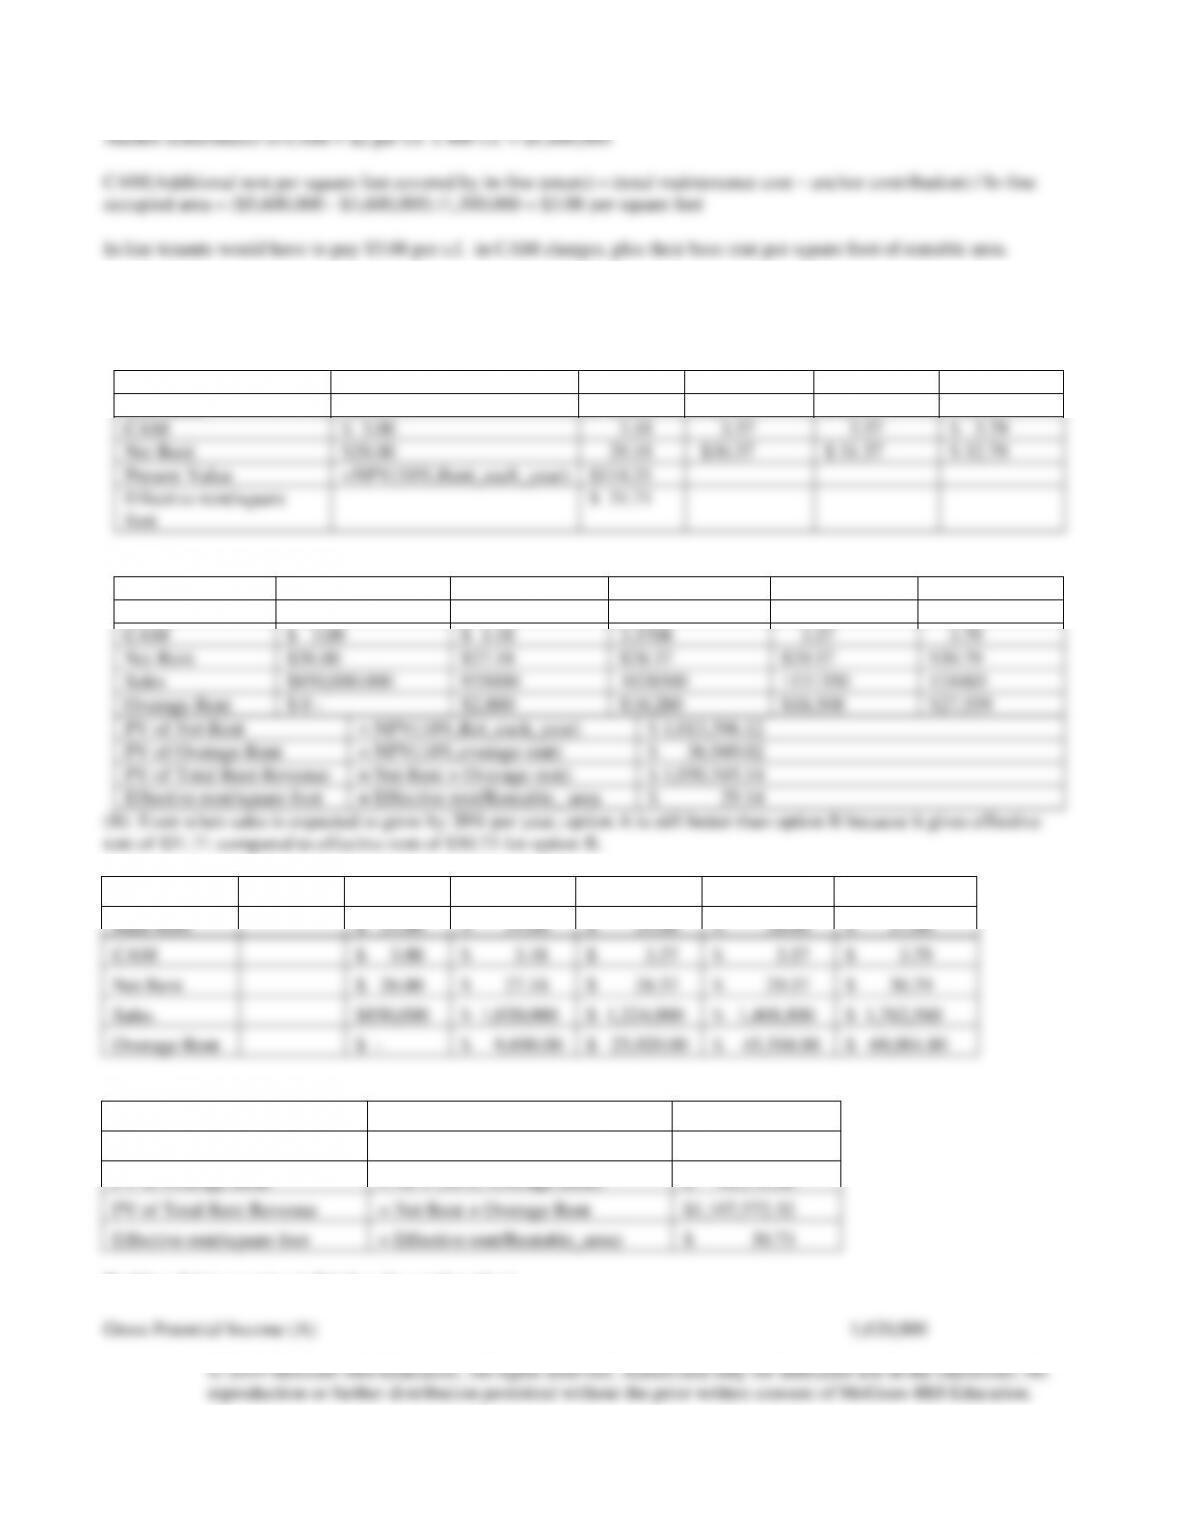
(A) Option A is best because it gives higher effective rent psf. See the calculations below
Option A
Year
1
2
3
4
5
Base Rent
$25.00
$ 26.00
$ 27.00
$ 28.00
$ 29.00
CAM
$ 3.00
3.18
3.37
3.57
$ 3.79
Net Rent
$28.00
29.18
$30.37
$ 31.57
$ 32.79
Present Value
=NPV(10%,Rent_each_year)
$114.31
Effective rent/square
foot
$ 31.71
Option B
Year
1
2
3
4
5
Base Rent
$23.00
$24.00
$25.00
$26.00
$27.00
CAM
$ 3.00
$ 3.18
3.3708
3.57
3.79
Net Rent
$26.00
$27.18
$28.37
$29.57
$30.79
Sales
$850,000.000
935000
1028500
1131350
124485
Overage Rent
$ 0 –
$2,800
$10,280
$18,508
$27,559
PV of Net Rent
= NPV(10%,Ret_each_year)
$ 1,013,396.12
PV of Overage Rent
= NPV(10%,overage rent)
$ 36,949.02
PV of Total Rent Revenue
= Net Rent + Overage rent)
$ 1,050,345.14
Effective rent/square foot
= Effective rent/Rentable_ area
$ 29.14
(B) Even when sales is expected to grow by 20% per year, option A is still better than option B because it gives effective
rent of $31.71 compared to effective rent of $30.73 for option B.
Year
1
2
3
4
5
Base Rent
$ 23.00
$ 24.00
$ 25.00
$ 26.00
$ 27.00
CAM
$ 3.00
$ 3.18
$ 3.37
$ 3.57
$ 3.79
Net Rent
$ 26.00
$ 27.18
$ 28.37
$ 29.57
$ 30.79
Sales
$850,000
$ 1,020,000
$ 1,224,000
$ 1,468,800
$ 1,762,560
Overage Rent
$ –
$ 9,600.00
$ 25,920.00
$ 45,504.00
$ 69,004.80
Calculate Effective Rent:
PV of Net Rent
= NPV (10%, Rent_each_year)
$1,013,396.12
PV of Overage Rent
= NPV (10%, Overage Rent)
$ 94,176.20
PV of Total Rent Revenue
= Net Rent + Overage Rent
$1,107,572.32
Effective rent/square foot
= Effective rent/Rentable_area)
$ 30.73
Problem 9-6 (see notes A-E below for explanation)
Gross Potential Income (A)
1,620,000
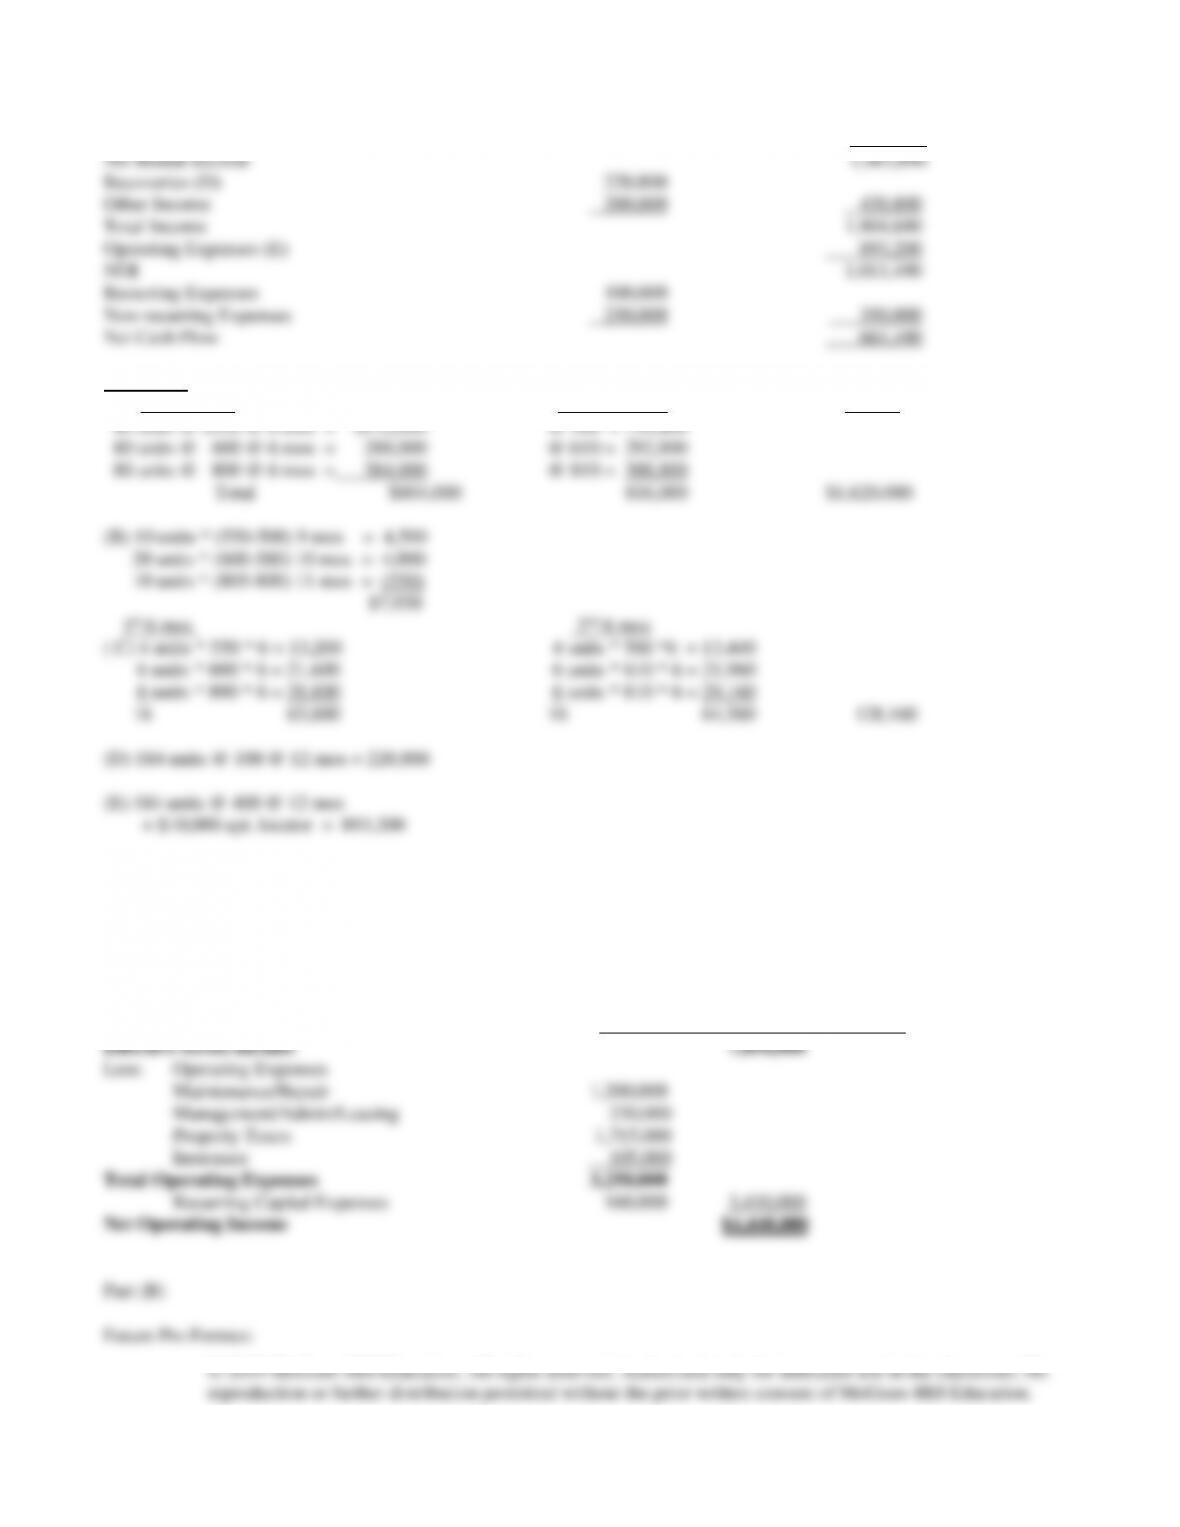
Loss to Lease (B)
7,950
Vacancy & Collection Loss ( C)
128,160
Net Rental Income
1,483,890
Recoveries (D)
220,800
Other Income
200,000
420,800
Total Income
1,904,690
Operating Expenses (E)
893,200
NOI
1,011,490
Recurring Expenses
100,000
Non-recurring Expenses
250,000
350,000
Net Cash Flow
661,490
Notes A-E
(A) 1st 6 months
2nd 6 months
Total
40 units @ $550 @ 6 mos = $132,000
@ 560 = 134,400
80 units @ 600 @ 6 mos = 288,000
@ 610 = 292,800
80 units @ 800 @ 6 mos = 384,000
@ 810 = 388,800
Total $804,000
816,000
$1,620,000
(B) 10 units * (550-500) 9 mos = 4,500
20 units * (600-580) 10 mos = 4,000
10 units * (805-800) 11 mos = (550)
$7,950
1st 6 mos
2nd 6 mos
( C) 4 units * 550 * 6 = 13,200
4 units * 560 *6 = 13,440
6 units * 600 * 6 = 21,600
6 units * 610 * 6 = 21,960
6 units * 800 * 6 = 28,800
6 units * 810 * 6 = 29,160
16 63,600
16 64,560
128,160
(D) 184 units @ 100 @ 12 mos = 220,800
(E) 184 units @ 400 @ 12 mos
+ $10,000 apt. locator = 893,200
Problem 9-7
Part (A) SUMMER PLACE MALL
Revenue: Base Rents (400,000 sq. ft. @ $20) 8,000,000
Add: Overage Rents 400,000
CAM recoveries 250,000
Less: Vacancy @ 10% of Base Rents 800,000

© 2019 McGraw-Hill Education. All rights reserved. Authorized only for instructor use in the classroom. No
reproduction or further distribution permitted without the prior written consent of McGraw-Hill Education.
1) The possibility of vacancy reduction from a high level of 10%.
2) Operating expenses in the pro forma may be underestimated as to utility expense which may not be included in the
statement.
3) The likelihood of overage rents continuing or increasing from current levels.
4) A lease rollover schedule should be developed to assess the probability of lease renewal among 40 tenants.
5) A market analysis to determine the likelihood of new retail (competitive) space coming into the marketplace.
Problem 9-8
Part (A) BETTS DISTRIBUTION CENTER
Rent: (200,000 sq. ft. @$7.00) 1,400,000
Add: Recoveries @ $1.50 300,000
Insurance 15,000
Problem 9-9
Part (A) WEST OFFICE PLAZA
Revenue: (300,000 sq. ft. @$20) 6,000,000
Add: Other Income (parking) 450,000
Problem 9-10
(a) Only the leases with CPI adjustments are affected. The effective rent for the net lease with a CPI adjustment increases to