Solutions to Questions – Chapter 7
Single Family Housing: Pricing, Investment and Tax Considerations
Question 7-1
Why is the income approach to value often difficult to use on a single family residential appraisal?
Question 7-2
What are the differences between the cost and sales comparison approaches to appraising property?
Question 7-3
What are the capital gains rules as applied to residential property owners?
Question 7-4
List four important drivers of housing demand and price appreciation.
Question 7-5
What are public goods? How may they be reflected in house prices?
Question 7-6
When considering an investment in “distressed” properties, what are the most important areas of research that
should be considered?
Solutions to Problems – Chapter 7
Single Family Housing: Pricing, Investment and Tax Considerations
Problem 7-1
Loan-to-value ratio 80.00%
Purchase price $200,000 Loan amount $160,000
Initial Rent $24,000 Interest rate 6.00%
Rental growth rate 3.00% Loan term (years) 30
Property growth rate 3.00% Payments (per year) 12
Insurance $1,500
Maintenance $1,500
Expense growth 3.00%
Marginal tax rate 26.00%
Property tax % 2.00%
Selling expenses 7.00%
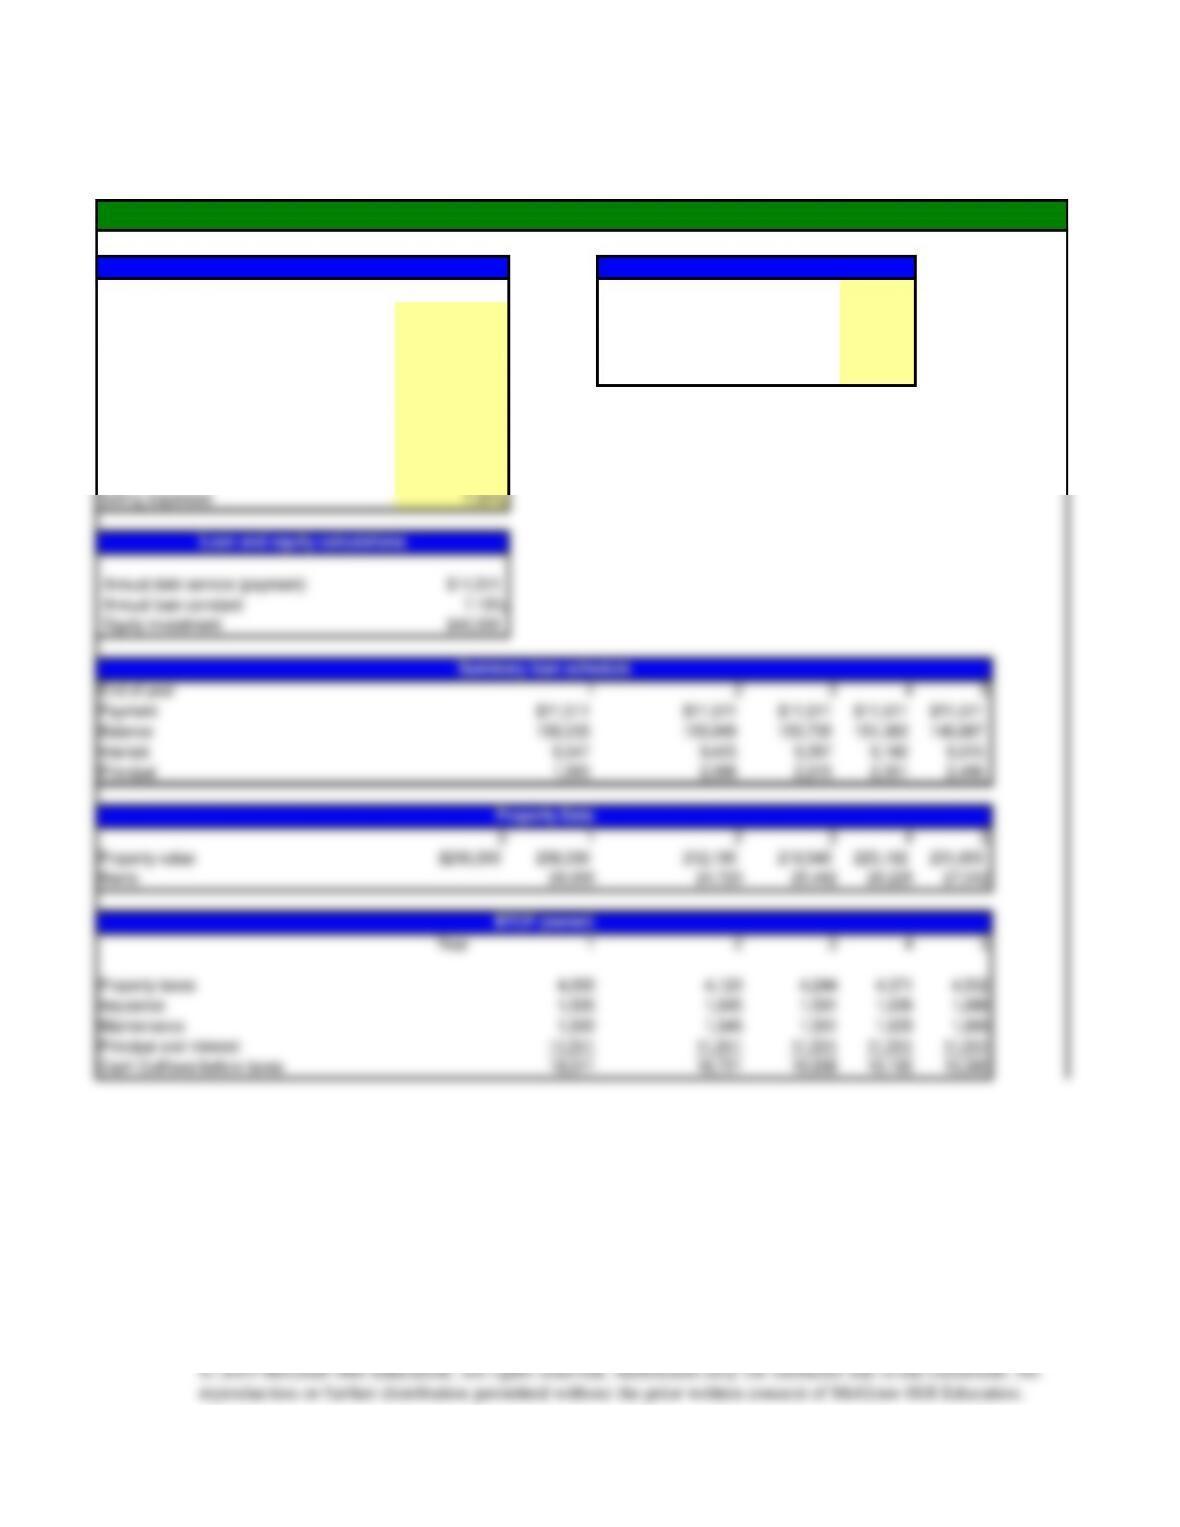
Annual debt service (payment) $11,511
Annual loan constant 7.19%
Equity investment $40,000
End of year 1 2 3 4 5
Payment $11,511 $11,511 $11,511 $11,511 $11,511
Balance 158,035 155,949 153,735 151,383 148,887
Interest 9,547 9,425 9,297 9,160 9,015
Principal 1,965 2,086 2,215 2,351 2,496
0 1 2 3 4 5
Property value $200,000 206,000 212,180 218,545 225,102 231,855
Rents 24,000 24,720 25,462 26,225 27,012
Year 1 2 3 4 5
Property taxes 4,000 4,120 4,244 4,371 4,502
Insurance 1,500 1,545 1,591 1,639 1,688
Maintenance 1,500 1,545 1,591 1,639 1,688
Cash Outflows before taxes 18,511 18,721 18,938 19,160 19,390
Loan and equity calculations
Summary loan schedule
Property Data
BTCF (owner)
Rent versus Own Analysis of a Personal Residence
Property information
Loan Information:
Problem 7-1 (B)
Property taxes $4,000 $4,120 $4,244 $4,371 $4,502
Interest 9,547 9,425 9,297 9,160 9,015
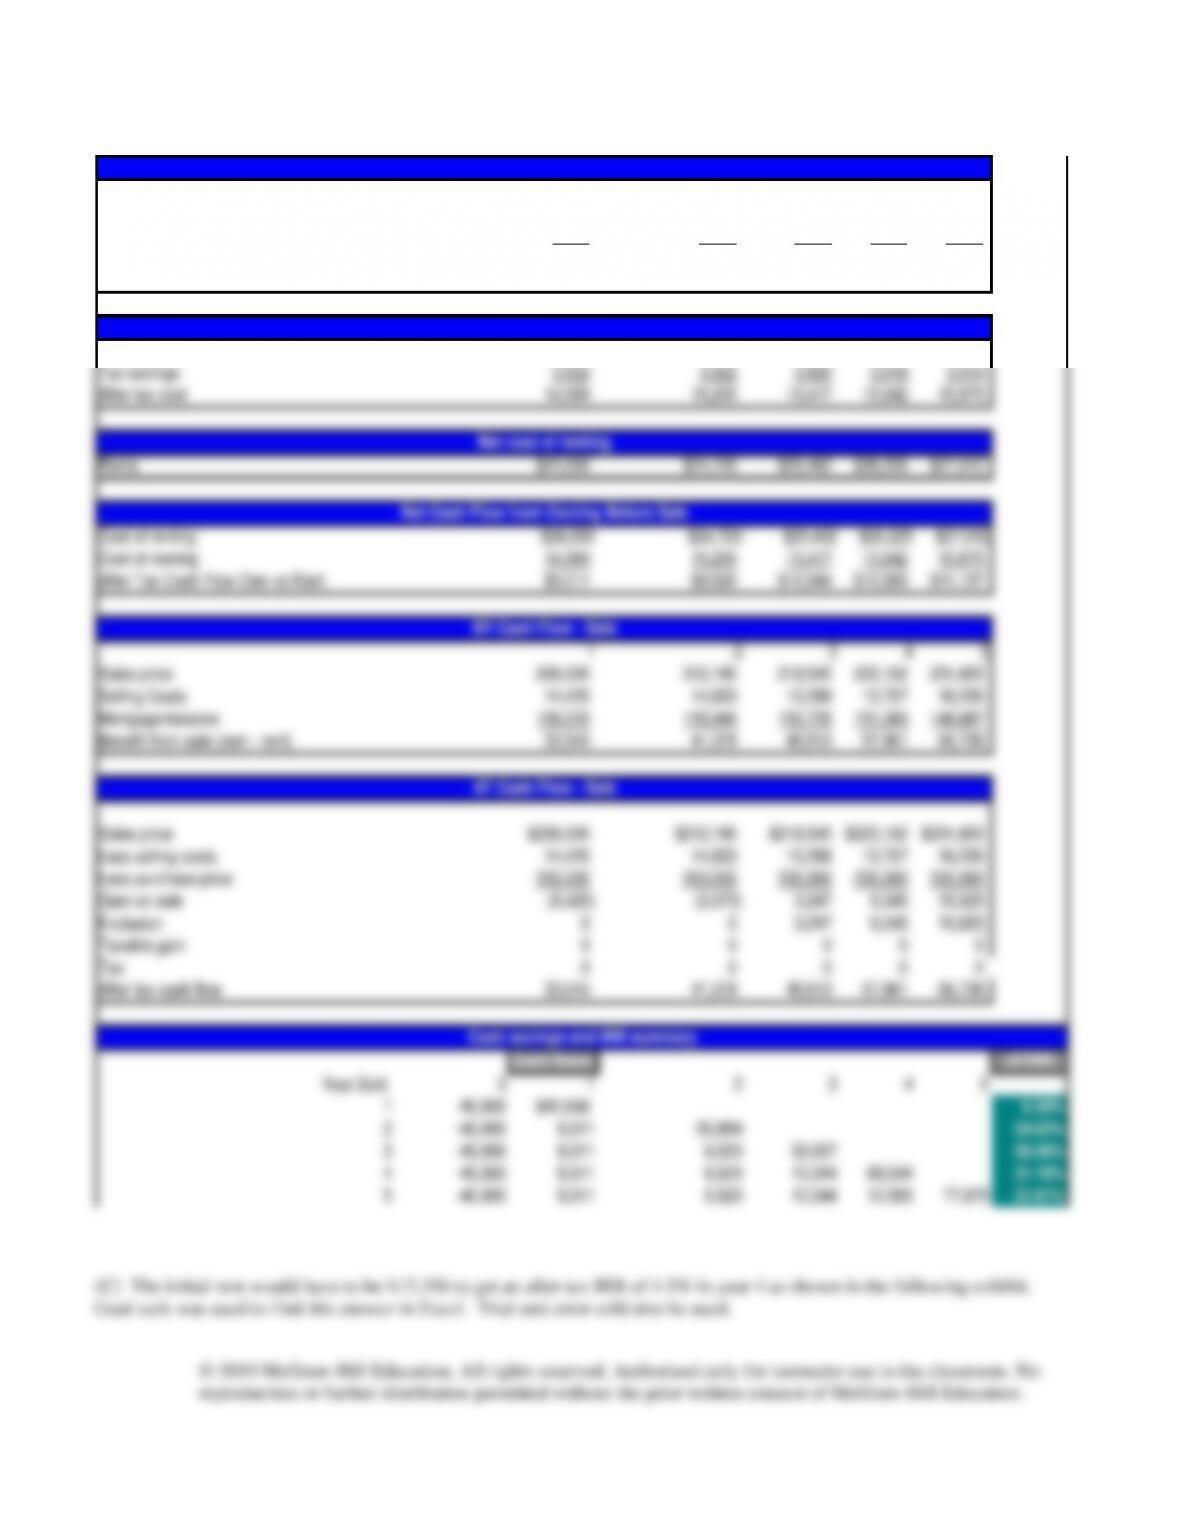
Total tax deductions $13,547 $13,545 $13,540 $13,531 $13,517
Tax savings 3,522 3,522 3,520 3,518 3,514
Cash Outflows before taxes 18,511 18,721 18,938 19,160 19,390
Tax savings 3,522 3,522 3,520 3,518 3,514
After tax cost 14,989 15,200 15,417 15,642 15,875
Rents $24,000 $24,720 $25,462 $26,225 $27,012
Cost of renting $24,000 $24,720 $25,462 $26,225 $27,012
Cost of owning 14,989 15,200 15,417 15,642 15,875
After Tax Cash Flow Own vs Rent $9,011 $9,520 $10,044 $10,583 $11,137
1 2 3 4 5
Sales price 206,000 212,180 218,545 225,102 231,855
Mortgage balance 158,035 155,949 153,735 151,383 148,887
Benefit from sale (own – rent) 33,545 41,378 49,513 57,961 66,738
Sales price $206,000 $212,180 $218,545 $225,102 $231,855
Less selling costs 14,420 14,853 15,298 15,757 16,230
Less purchase price 200,000 200,000 200,000 200,000 200,000
Gain on sale (8,420) (2,673) 3,247 9,345 15,625
Exclusion 0 0 3,247 9,345 15,625
Taxable gain 0 0 0 0 0
After tax cash flow 33,545 41,378 49,513 57,961 66,738
Cash flows ATIRR
Year Sold 0 1 2 3 4 5
1 -40,000 $42,556
6.39%
2 -40,000 9,011 50,899
24.63%
29.58%
31.18%
BT Cash Flow – Sale
AT Cash Flow – Sale
Tax deductions from owning
Net cost of owning
Net cost of renting
Net Cash Flow from Owning Before Sale
Goal seek was used to find this answer in Excel. Trial and error cold also be used.
Loan-to-value ratio 80.00%
Purchase price $200,000 Loan amount $160,000
Initial Rent $12,356 Interest rate 6.00%
Rental growth rate 3.00% Loan term (years) 30
Property growth rate 3.00% Payments (per year) 12
Insurance $1,500
Maintenance $1,500
Expense growth 3.00%
Marginal tax rate 26.00%
Property tax % 2.00%
Selling expenses 7.00%
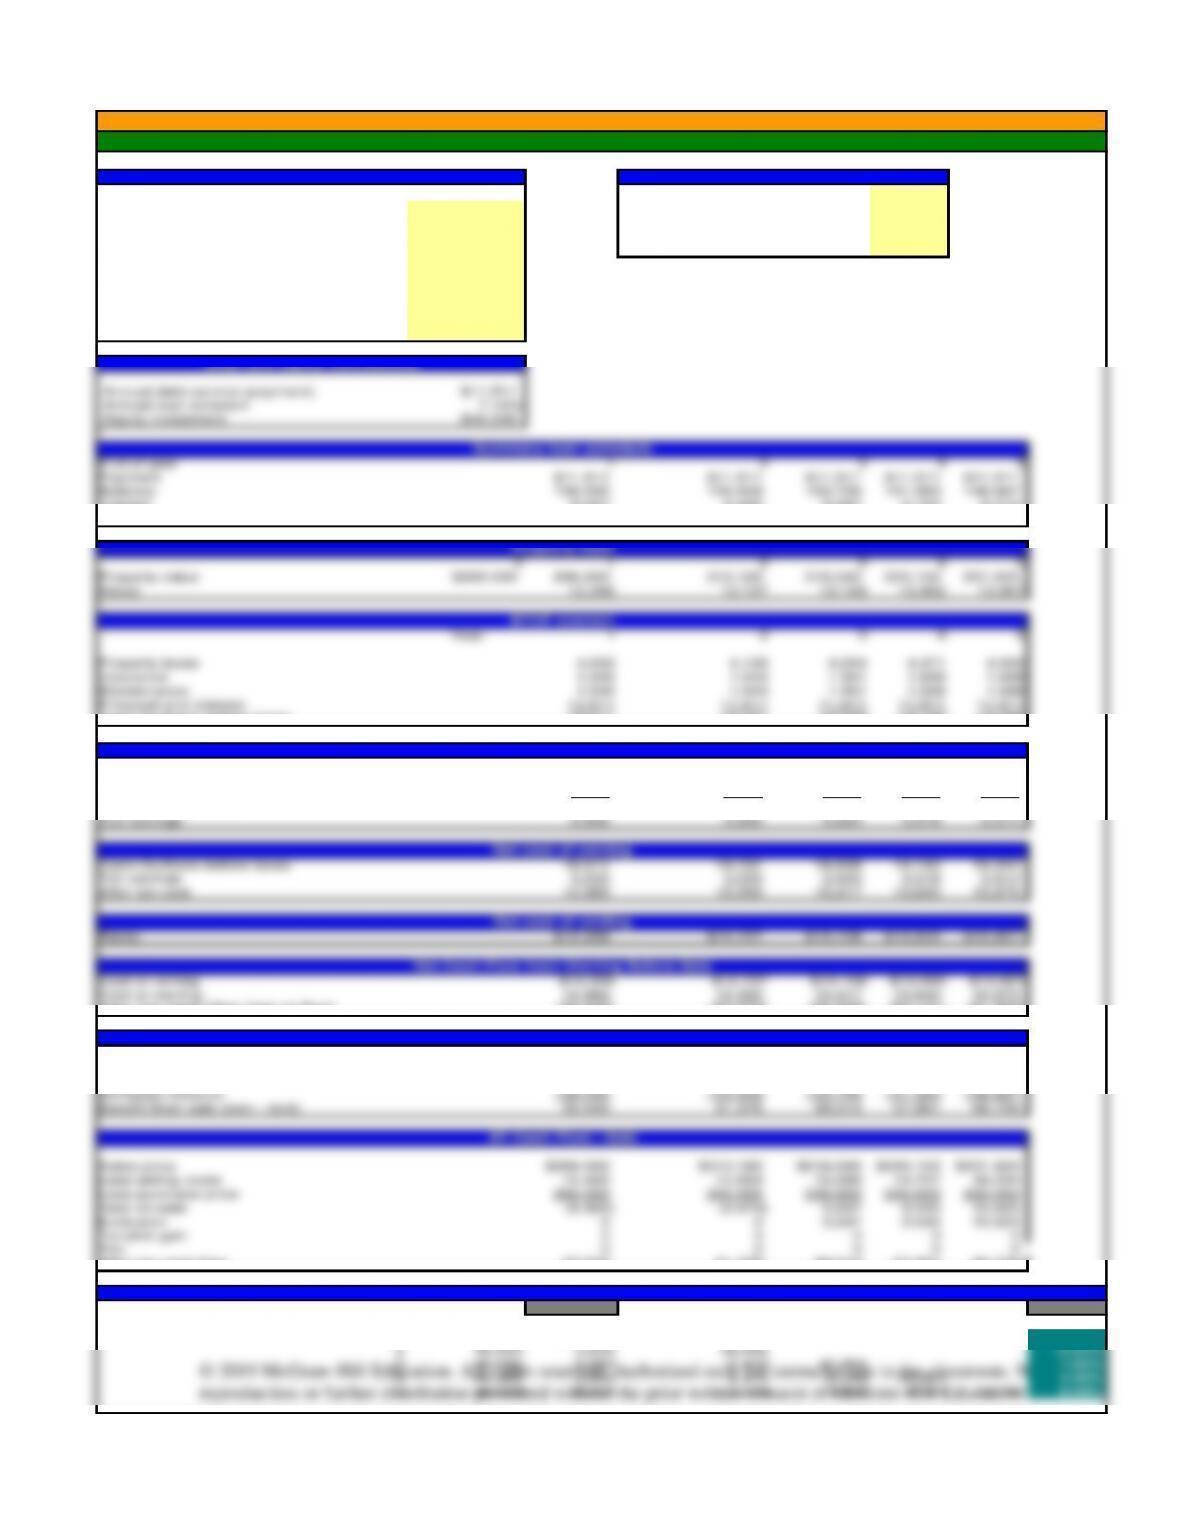
Annual debt service (payment) $11,511
Annual loan constant 7.19%
Equity investment $40,000
End of year 1 2 3 4 5
Payment $11,511 $11,511 $11,511 $11,511 $11,511
Balance 158,035 155,949 153,735 151,383 148,887
0 1 2 3 4 5
Year 1 2 3 4 5
Property taxes 4,000 4,120 4,244 4,371 4,502
Cash Outflows before taxes 18,511 18,721 18,938 19,160 19,390
Tax savings 3,522 3,522 3,520 3,518 3,514
Cash Outflows before taxes 18,511 18,721 18,938 19,160 19,390
Tax savings 3,522 3,522 3,520 3,518 3,514
After tax cost 14,989 15,200 15,417 15,642 15,875
Rents $12,356 $12,727 $13,108 $13,502 $13,907
After Tax Cash Flow Own vs Rent ($2,633) ($2,473) ($2,309) ($2,141) ($1,969)
1 2 3 4 5
Sales price 206,000 212,180 218,545 225,102 231,855
Selling Costs 14,420 14,853 15,298 15,757 16,230
Mortgage balance 158,035 155,949 153,735 151,383 148,887
Benefit from sale (own – rent) 33,545 41,378 49,513 57,961 66,738
Sales price $206,000 $212,180 $218,545 $225,102 $231,855
Less selling costs 14,420 14,853 15,298 15,757 16,230
Less purchase price 200,000 200,000 200,000 200,000 200,000
Exclusion 0 0 3,247 9,345 15,625
Taxable gain 0 0 0 0 0
Tax 0 0 0 0 0
After tax cash flow 33,545 41,378 49,513 57,961 66,738
BT Cash Flow – Sale
AT Cash Flow – Sale
Net cost of owning
Net cost of renting
Net Cash Flow from Owning Before Sale
Loan and equity calculations
Summary loan schedule
Property Data
BTCF (owner)
Chapter 7
Rent versus Own Analysis of a Personal Residence
Property information
Loan Information:

Problem 7-2
(a) Equity Investment = $60,000, House Value = $300,000 Less Mortgage $240,000
Problem 7-3
(a)
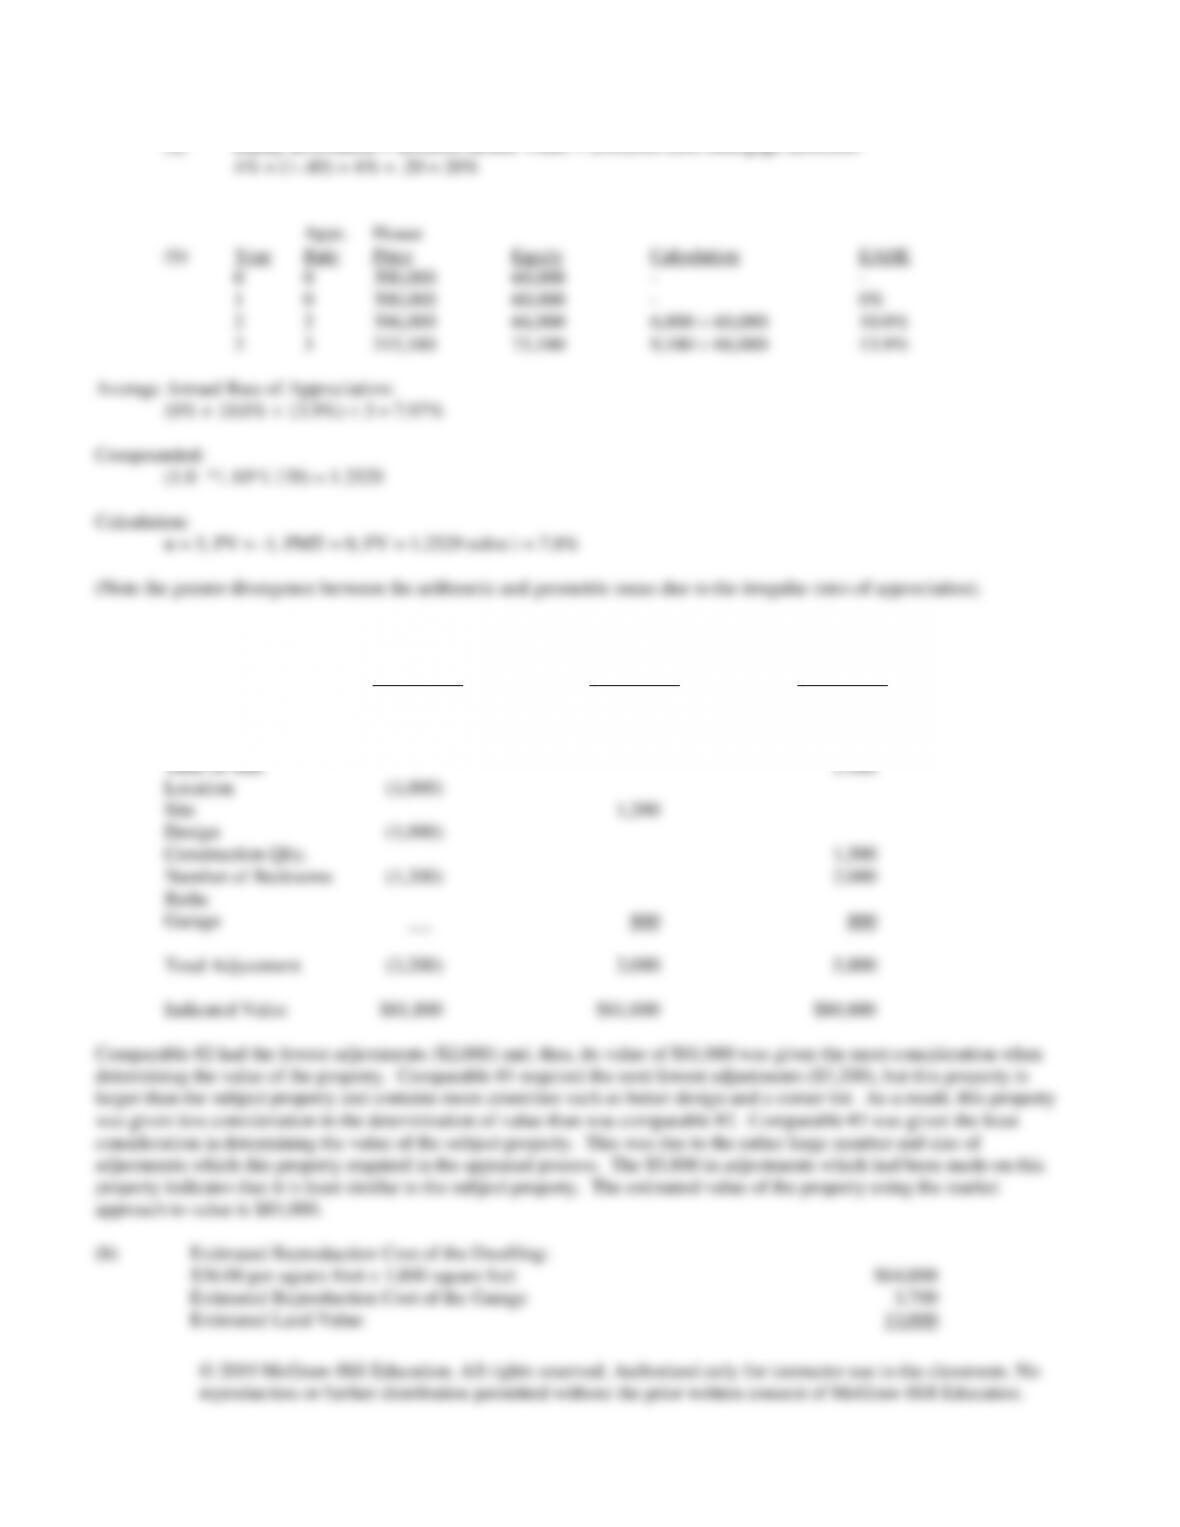
Property #1 Property #2 Property #3
Address 123 Clay St. 301 Cherry St. 119 Avenue X
Sale Price $85,000 $79,000 $75,000
Less: Adjustment
Estimated Value Using the Cost Approach $81,500
Problem 7-4
(a)
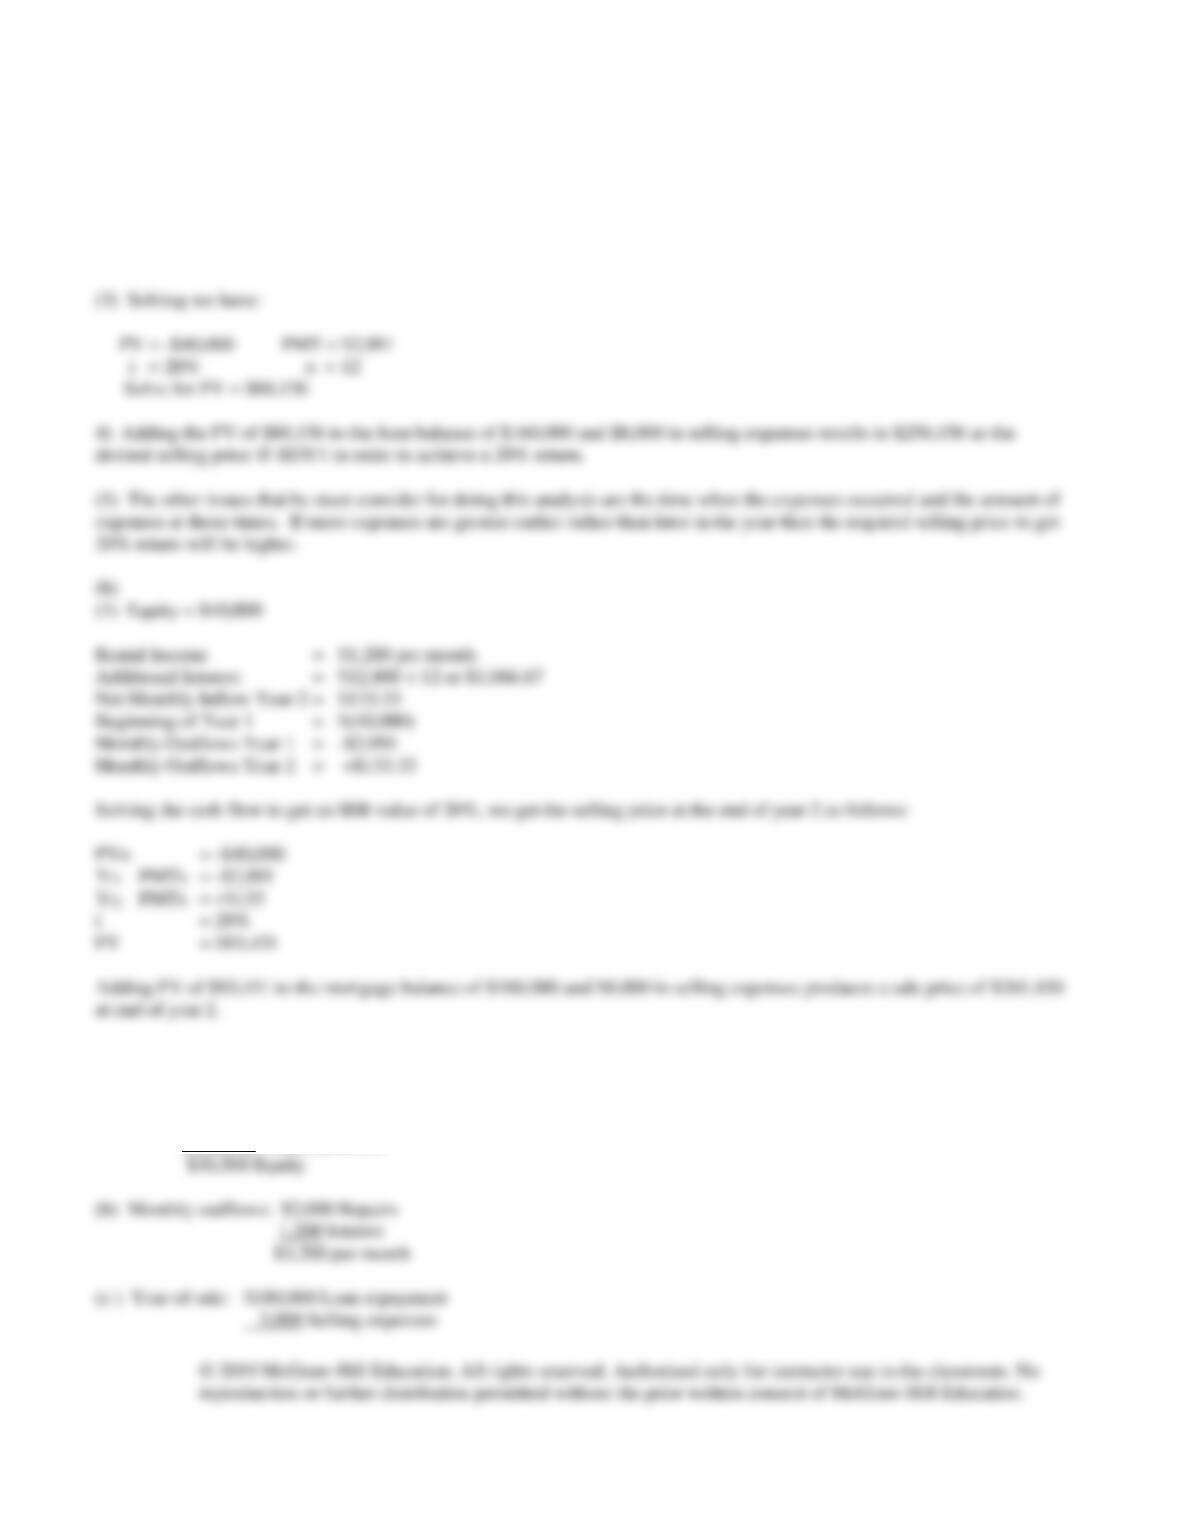
(1) Equity: Price $200,000 – Loan $160,000 = $40,000.
(2) Cash out flows are assumed to occur monthly and will average $2,991.
Problem 7-5
Cash flows are summarized as follows:
(a) PV = $200,000 Price
-$180,000 Loan
+$10,500 Acquisition fees
Problem 7-6
(a)
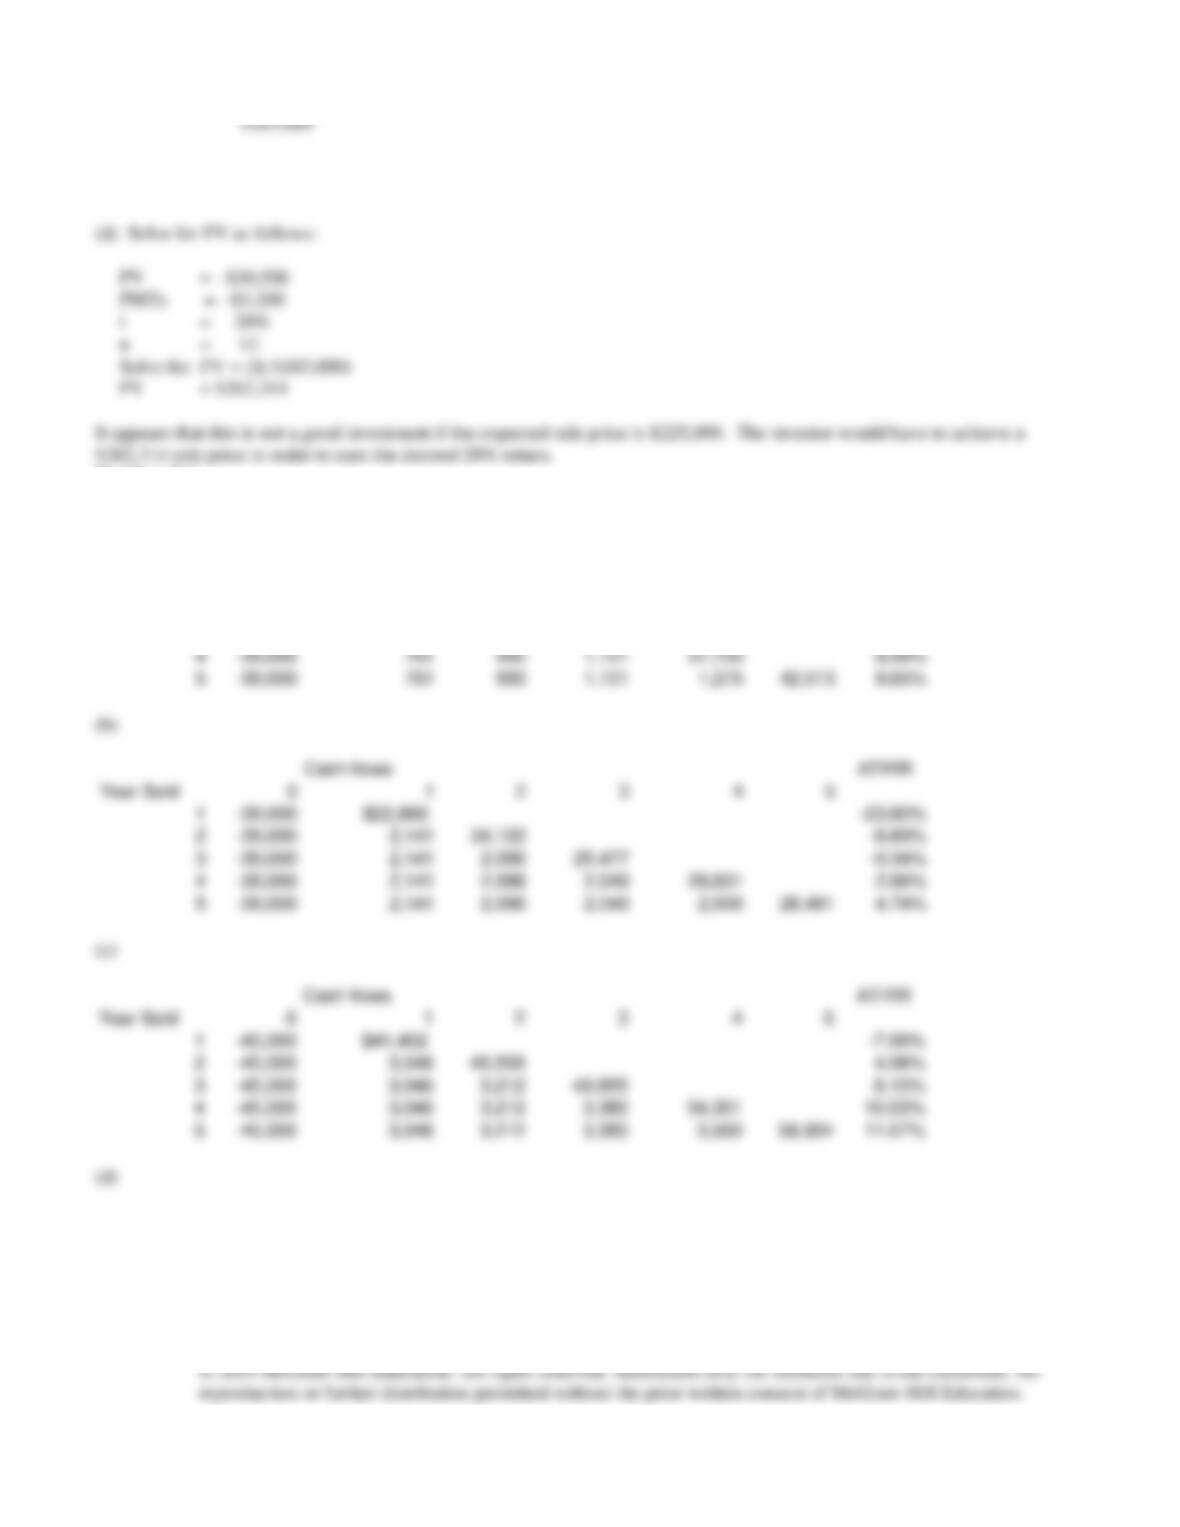
Cash flows ATIRR
Year Sold 0 1 2 3 4 5
1 -45,000 $41,402 -7.99%
2 -45,000 3,046 45,558 4.06%
3 -45,000 3,046 3,212 49,855 8.13%
4 -45,000 3,046 3,212 3,380 54,301 10.03%
Cash flows ATIRR
Year Sold 0 1 2 3 4 5
1 -30,000 $24,270 -19.10%
2 -30,000 761 28,592 -1.10%
3 -30,000 761 930 33,067 5.16%
4 -30,000 761 930 1,101 37,705 8.08%
5 -30,000 761 930 1,101 1,275 42,513 9.65%
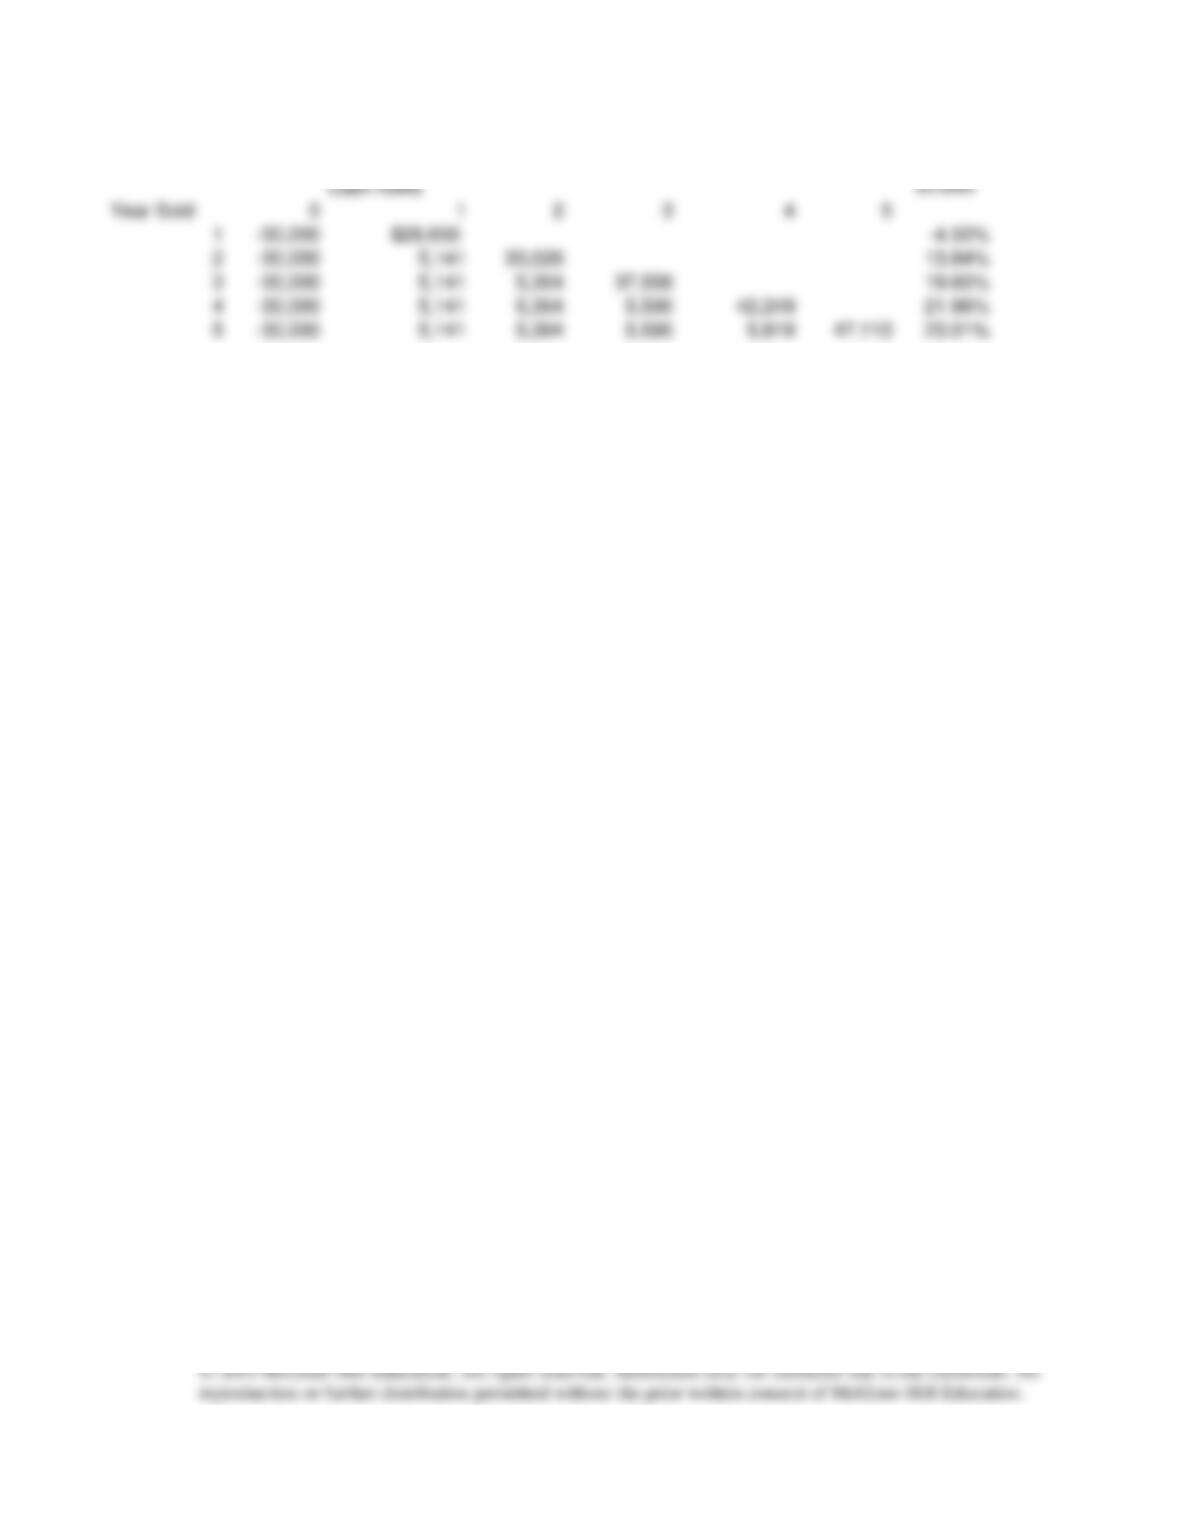
Cash flows ATIRR
Year Sold 0 1 2 3 4 5
1 -30,000 $28,650 -4.50%
2 -30,000 5,141 33,026 13.84%
3 -30,000 5,141 5,364 37,556 19.60%
4 -30,000 5,141 5,364 5,590 42,249 21.96%
5 -30,000 5,141 5,364 5,590 5,819 47,113 23.01%