
Solutions to Questions – Chapter 22
Real Estate Investment Performance and Portfolio Considerations
Question 22-1
What are some of the difficulties of obtaining data to measure real estate investment performance?
Question 22-2
What are the distinguishing characteristics between REIT data and the NCREIF Property Index?
Question 22-3
What is the difference between arithmetic and geometric mean returns?
Question 22-4
What statistical concept do many portfolio managers use to represent risk when considering investment
performance?
Question 22-5
When NCREIF returns and REIT returns are compared, NCREIF returns exhibit a much lower pattern of
variation. Why might this be the case?
Question 22-6
Mean returns for portfolios are calculated by taking the weighted average of the mean returns for each investment
in the portfolio. Why won’t this approach work to calculate the standard deviation of portfolio returns?
Question 22-7
What is the difference between covariance and correlation? Why are these concepts so important in portfolio
analysis?

Question 22-8
Results reported in the chapter showed that by including either REITs or the NCREIF Index in a portfolio
containing S&P 500 securities, corporate bonds, and T bills, diversification benefits resulted. Why was this true?
Did those benefits come about for the same reason for each category of real estate investment?
Question 22-9
Results presented in the chapter are based on historical data. Of what use are these results to a portfolio manager
who may be making an investment decision today? Elaborate.
Question 22-10
Why should an investor consider investing globally?
Question 22-11
What are the risks of global investment?
Question 22-12
How can derivative security be used to hedge portfolio risk?
Solutions to Problems – Chapter 22
Real Estate Investment Performance and Portfolio Considerations
Problem 22-1
ET&T
MREAF
Common Stock Fund
Real Estate Fund
Unit
Quarterly
Unit
Quarterly
Period Ending
Value
Dividend
Value
Dividend
1
701.00
8.28
70.00
2.17
2
752.50
8.11
80.05
2.14
3
850.52
10.30
90.80
2.01
4
953.75
9.81
100.50
2.01
5
1,047.57
12.05
99.14
1.87
6
1,221.70
14.17
95.50
1.81
7
1,443.90
17.18
93.77
1.79
8
1,263.31
14.91
80.31
1.54
9
1,258.56
13.84
77.34
1.49
10
1,526.72
18.32
76.53
1.44
11
1,616.81
19.73
78.42
1.51
12
1,624.08
19.98
79.01
1.53
13
1,560.25
18.88
81.75
1.55
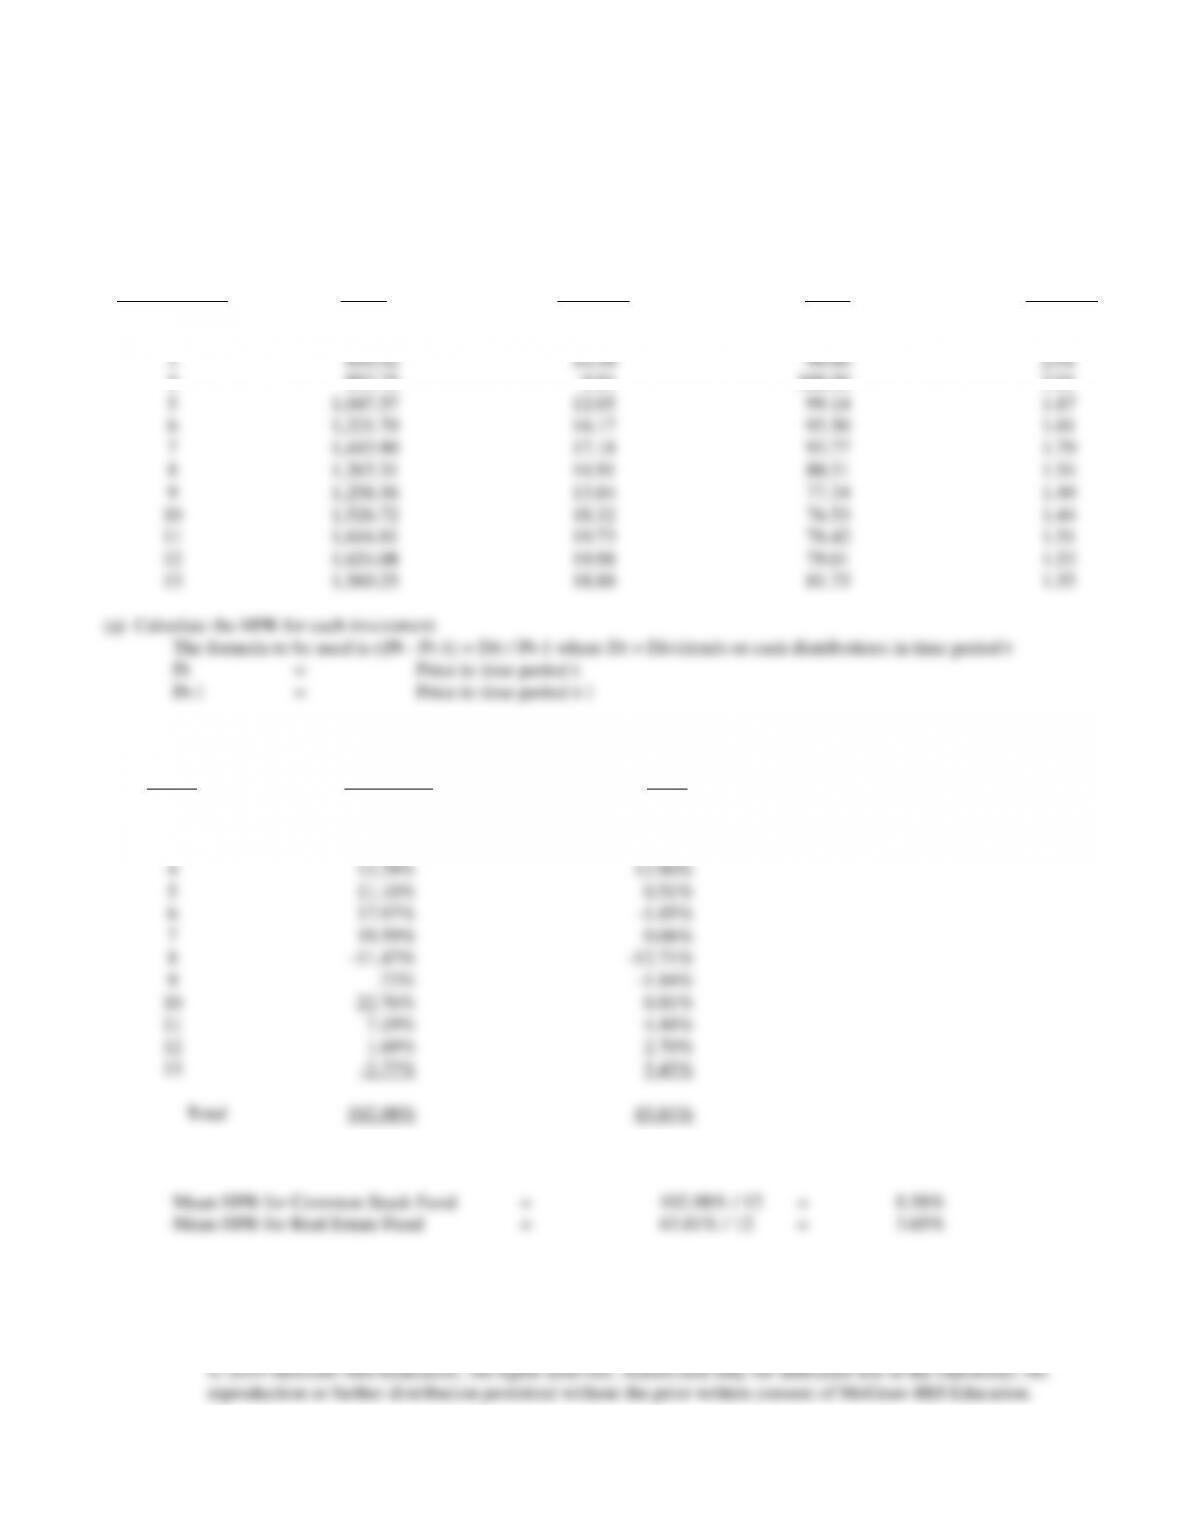
(a)
(b)
Common
Real Estate
Period
Stock Fund
Fund
1
NA
NA
2
8.50%
17.41%
3
14.39%
15.94%
4
13.29%
12.90%
5
11.10%
0.51%
6
17.97%
-1.85%
7
19.59%
0.06%
8
-11.47%
-12.71%
9
.72%
-1.84%
10
22.76%
0.81%
11
7.19%
4.44%
12
1.69%
2.70%
13
-2.77%
5.43%
Total
102.98%
43.81%
(b) Calculate Arithmetic Mean return
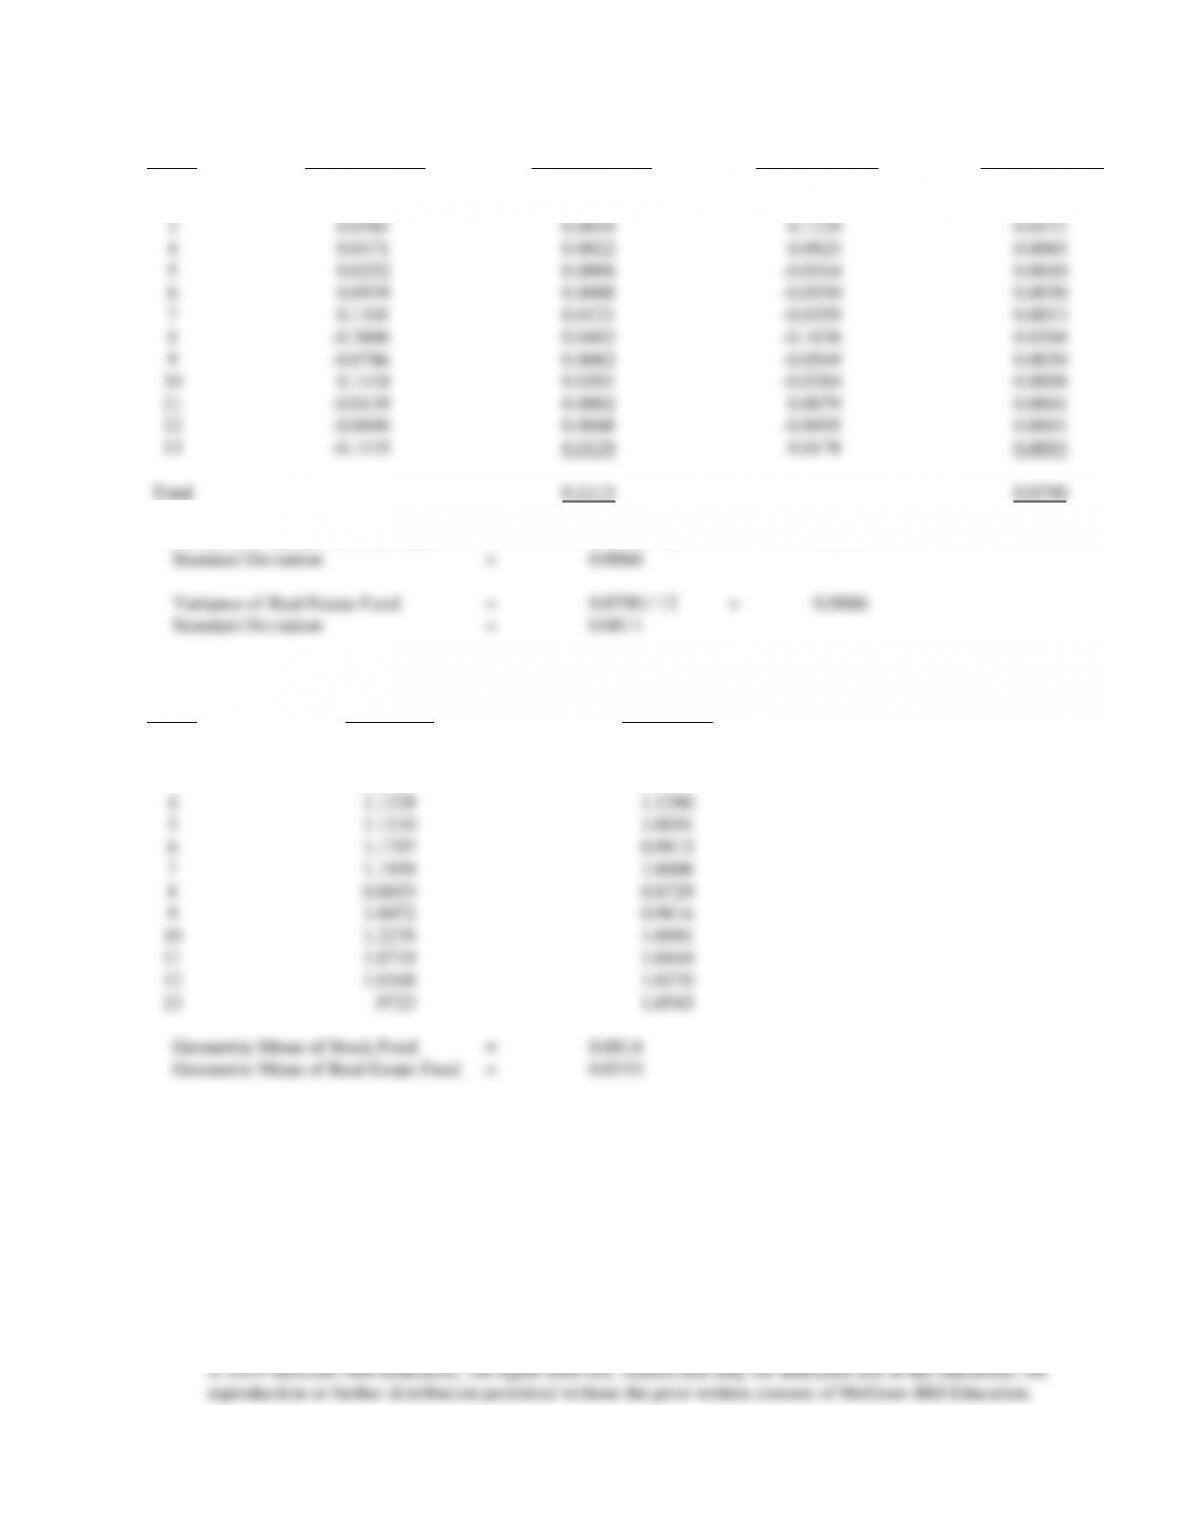
Calculate the Standard Deviation
Stock Fund
Real Estate fund
Period
(HPRa – HPRa)
(HPRa – HPRa)
(HPRb – HPRb)
(HPRb – HPRb)
1
2
-0.0008
0.0000
0.1376
0.0189
3
0.0581
0.0034
0.1229
0.0151
4
0.0471
0.0022
0.0925
0.0085
5
0.0252
0.0006
-0.0314
0.0010
6
0.0939
0.0088
-0.0550
0.0030
7
0.1101
0.0121
-0.0359
0.0013
8
-0.2006
0.0402
-0.1636
0.0268
9
-0.0786
0.0062
-0.0549
0.0030
10
0.1418
0.0201
-0.0284
0.0008
11
-0.0139
0.0002
0.0079
0.0001
12
-0.0690
0.0048
-0.0095
0.0001
13
-0.1135
0.0129
0.0178
0.0003
Total
0.1115
0.0790
Variance of Common Stock Fund = 0.1115 / 12 = 0.0093
Calculate the Geometric Mean
Stock Fund
Real Estate Fund
Period
(1 + HPRa)
(1 + HPRb)
1
2
1.0850
1.1741
3
1.1439
1.1594
4
1.1329
1.1290
5
1.1110
1.0051
6
1.1797
0.9815
7
1.1959
1.0006
8
0.8853
0.8729
9
1.0072
0.9816
10
1.2276
1.0081
11
1.0719
1.0444
12
1.0169
1.0270
13
.9723
1.0543
Geometric Mean of Stock Fund = 0.0814
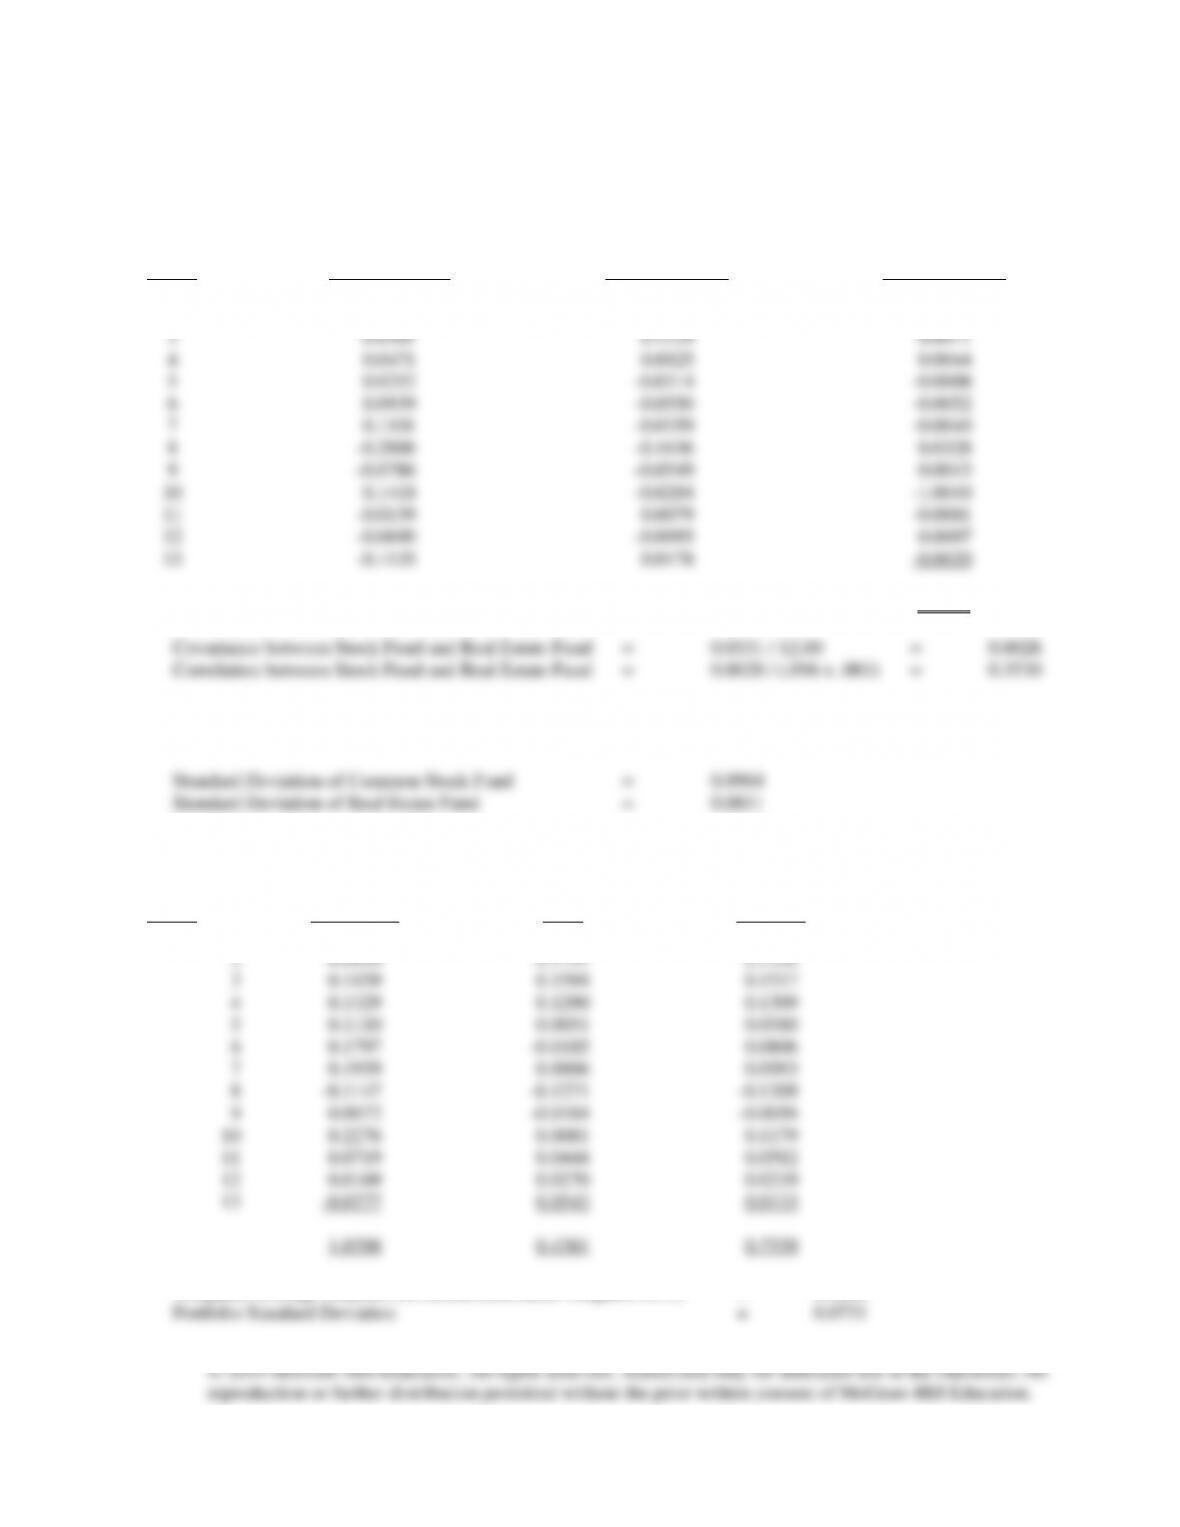
(c) Correlation between Common Stock Fund and Real Estate Fund
Correlation between Stock Fund and Real Estate Fund =[COVab] / [Std. Dev. (a) x Std. Dev. (b)]
COVab = [HPRa – HPRa] x [HPRb – HPRb] / N
[HPRa – HPRa] *
Period
(HPRa – HPRa)
(HPRb – HPRb)
[HPRb – HPRb]
1
2
-0.0008
0.1376
-0.0001
3
0.0581
0.1229
0.0071
4
0.0471
0.0925
0.0044
5
0.0252
-0.0314
-0.0008
6
0.0939
-0.0550
-0.0052
7
0.1101
-0.0359
-0.0040
8
-0.2006
-0.1636
0.0328
9
-0.0786
-0.0549
0.0043
10
0.1418
-0.0284
-1.0040
11
-0.0139
0.0079
-0.0001
12
-0.0690
-0.0095
0.0007
13
-0.1135
0.0178
-0.0020
Total
0.0331
Covariance between Stock Fund and Real Estate Fund = 0.0331 / 12.00 = 0.0028
(d) In order for a portfolio of assets to provide diversification, the standard deviation of the portfolio must be less than the
weighted average standard deviations of the individual assets.
The portfolio will be comprised of 50.00% Common Stock and
50.00% Real Estate Equities
Common
Real Estate
Period
Stock Fund
Fund
Portfolio
1
NA
NA
NA
2
0.0850
0.1741
0.1296
3
0.1439
0.1594
0.1517
4
0.1329
0.1290
0.1309
5
0.1110
0.0051
0.0580
6
0.1797
-0.0185
0.0806
7
0.1959
0.0006
0.0983
8
-0.1147
-0.1271
-0.1209
9
0.0072
-0.0184
-0.0056
10
0.2276
0.0081
0.1179
11
0.0719
0.0444
0.0582
12
0.0169
0.0270
0.0219
13
-0.0277
0.0543
0.0133
1.0298
0.4381
0.7339
Weighted Average Standard Deviation (each asset weighted 50%) = 0.0888

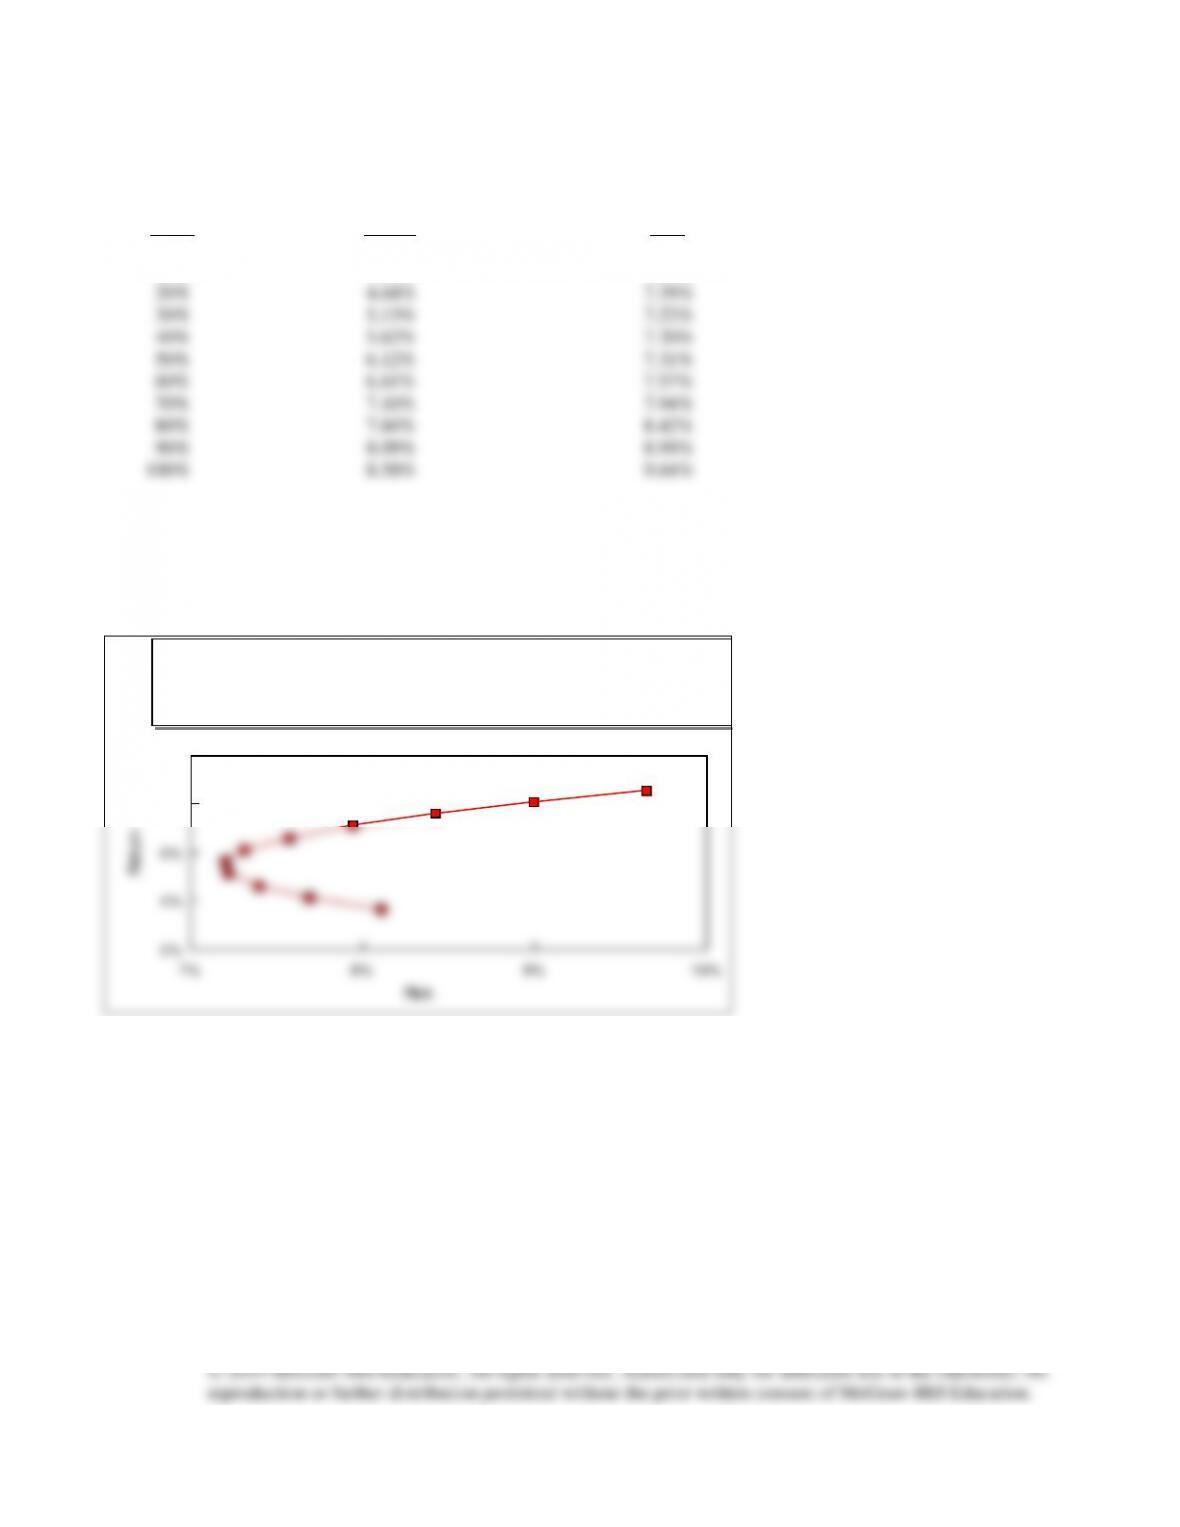
(e) Optional
Weight
of Common
Portfolio
Portfolio
Stock
Return
Risk
0%
3.65%
8.11%
10%
4.14%
7.69%
20%
4.64%
7.39%
30%
5.13%
7.22%
40%
5.62%
7.20%
50%
6.12%
7.31%
60%
6.61%
7.57%
70%
7.10%
7.94%
80%
7.60%
8.42%
90%
8.09%
8.99%
100%
8.58%
9.64%
(f) Based on the exhibit below, it would appear that substantial risk reduction occurs as more of the real estate fund is
combined with the stock fund. However, mean returns on the portfolio increase sharply as more common stock is added.
How much stock should be combined with real estate will depend on the degree of risk aversion of the portfolio manager,
however, the trade off between risk and return can be clearly seen in the Exhibit.
7% 8% 9% 10%
2%
4%
6%
8%
10%
Risk
Return
Portfolio of Stocks and Real Estate
Return vs. Risk
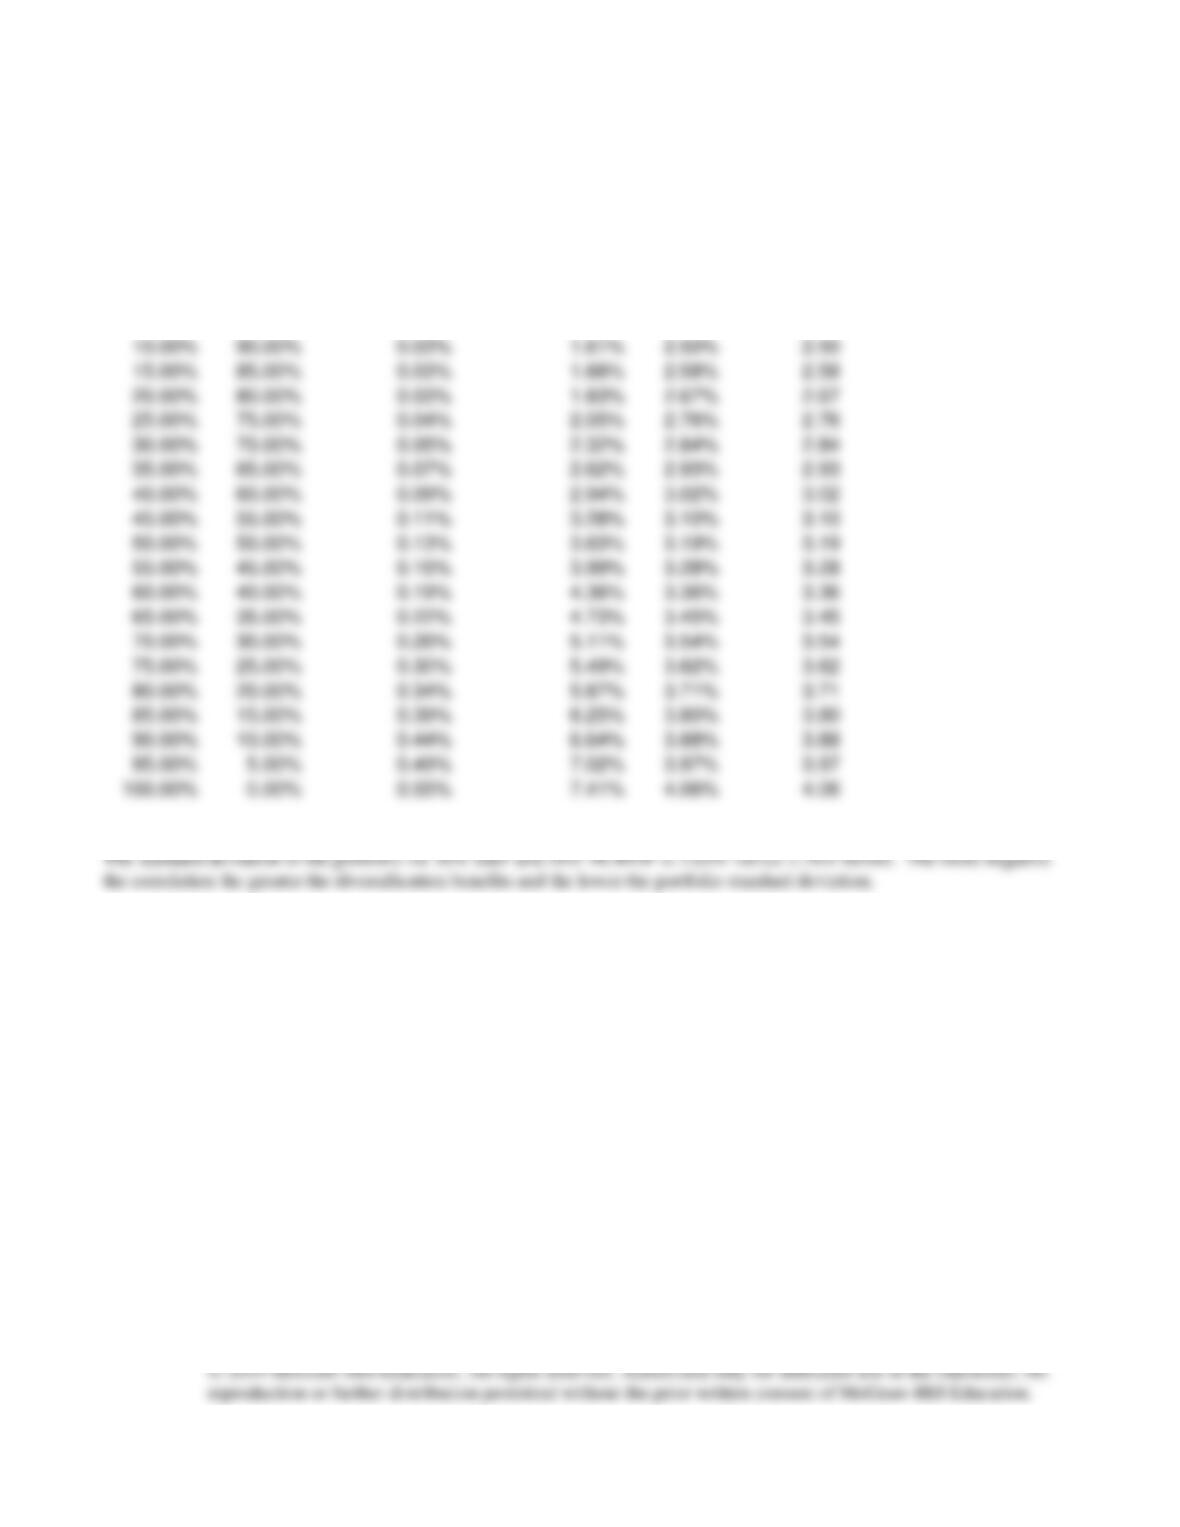
Problem 22-2
See below:
Portfolio
Portfolio
% S&P
% NCREIF
Variance
Stand. Dev
Return
Return x 100
0.00%
100.00%
0.03%
1.76%
2.32%
2.32
5.00%
95.00%
0.03%
1.64%
2.41%
2.41
10.00%
90.00%
0.03%
1.61%
2.50%
2.50
15.00%
85.00%
0.03%
1.68%
2.58%
2.58
20.00%
80.00%
0.03%
1.83%
2.67%
2.67
25.00%
75.00%
0.04%
2.05%
2.76%
2.76
30.00%
70.00%
0.05%
2.32%
2.84%
2.84
35.00%
65.00%
0.07%
2.62%
2.93%
2.93
40.00%
60.00%
0.09%
2.94%
3.02%
3.02
45.00%
55.00%
0.11%
3.28%
3.10%
3.10
50.00%
50.00%
0.13%
3.63%
3.19%
3.19
55.00%
45.00%
0.16%
3.99%
3.28%
3.28
60.00%
40.00%
0.19%
4.36%
3.36%
3.36
65.00%
35.00%
0.22%
4.73%
3.45%
3.45
70.00%
30.00%
0.26%
5.11%
3.54%
3.54
75.00%
25.00%
0.30%
5.49%
3.62%
3.62
80.00%
20.00%
0.34%
5.87%
3.71%
3.71
85.00%
15.00%
0.39%
6.25%
3.80%
3.80
90.00%
10.00%
0.44%
6.64%
3.88%
3.88
95.00%
5.00%
0.49%
7.02%
3.97%
3.97
100.00%
0.00%
0.55%
7.41%
4.06%
4.06