Question 17-1
How might land development activities be specialized? Why is this activity different from project development
discussed in the preceding chapter?
Question 17-2
What is an option contract? How is it used in land acquisition? What should developers be concerned with when
using such options? What contingencies may be included in a land option?
Question 17-3
What are some of the physical considerations that a developer should be concerned with when purchasing land?
How should such considerations be taken into account when determining the price that should be paid?
Question 17-4
In land development projects, why do lenders insist on loan repayment rates in excess of sales revenue? What is a
release price?
Question 17-5
What are the unique risks of land development projects from the developer’s and lender’s point of view?
Solutions to Problems – Chapter 17
Financing Land Development Projects
Problem 17-1
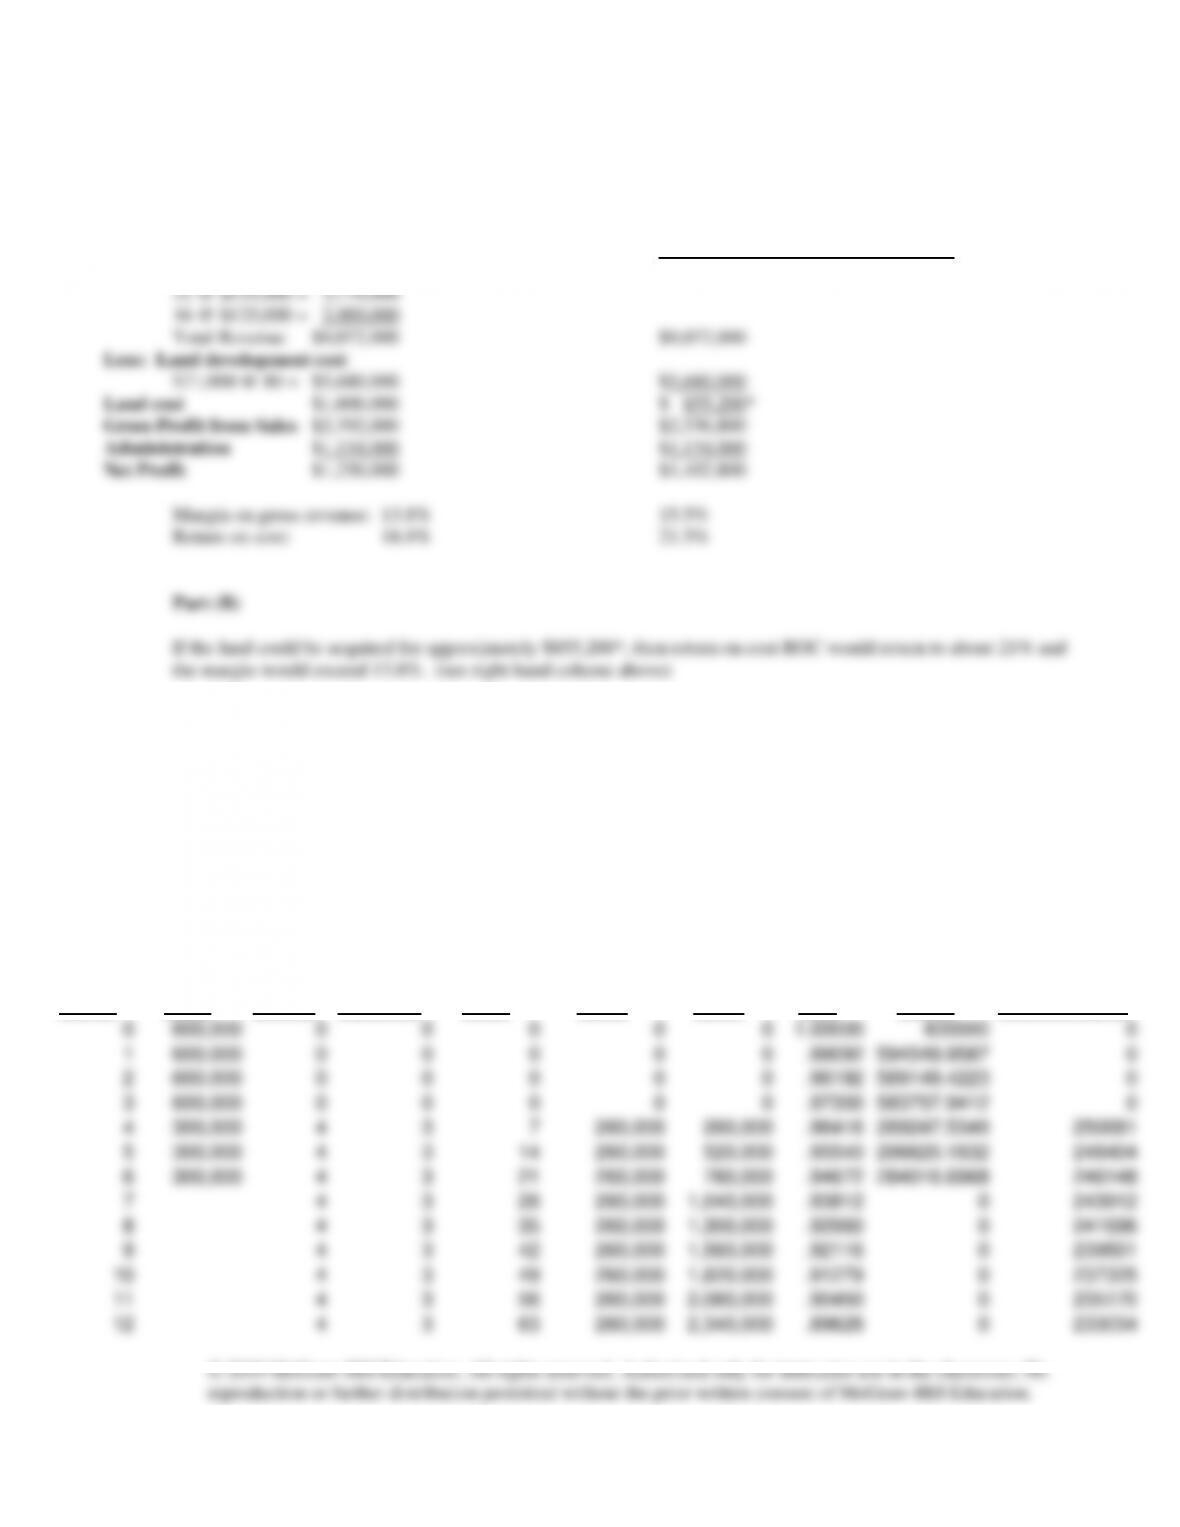
Part (A)
Revised revenues: Required land cost to achieve ROC:
32 @ $103,000 = $3,296,000
Problem 17-2
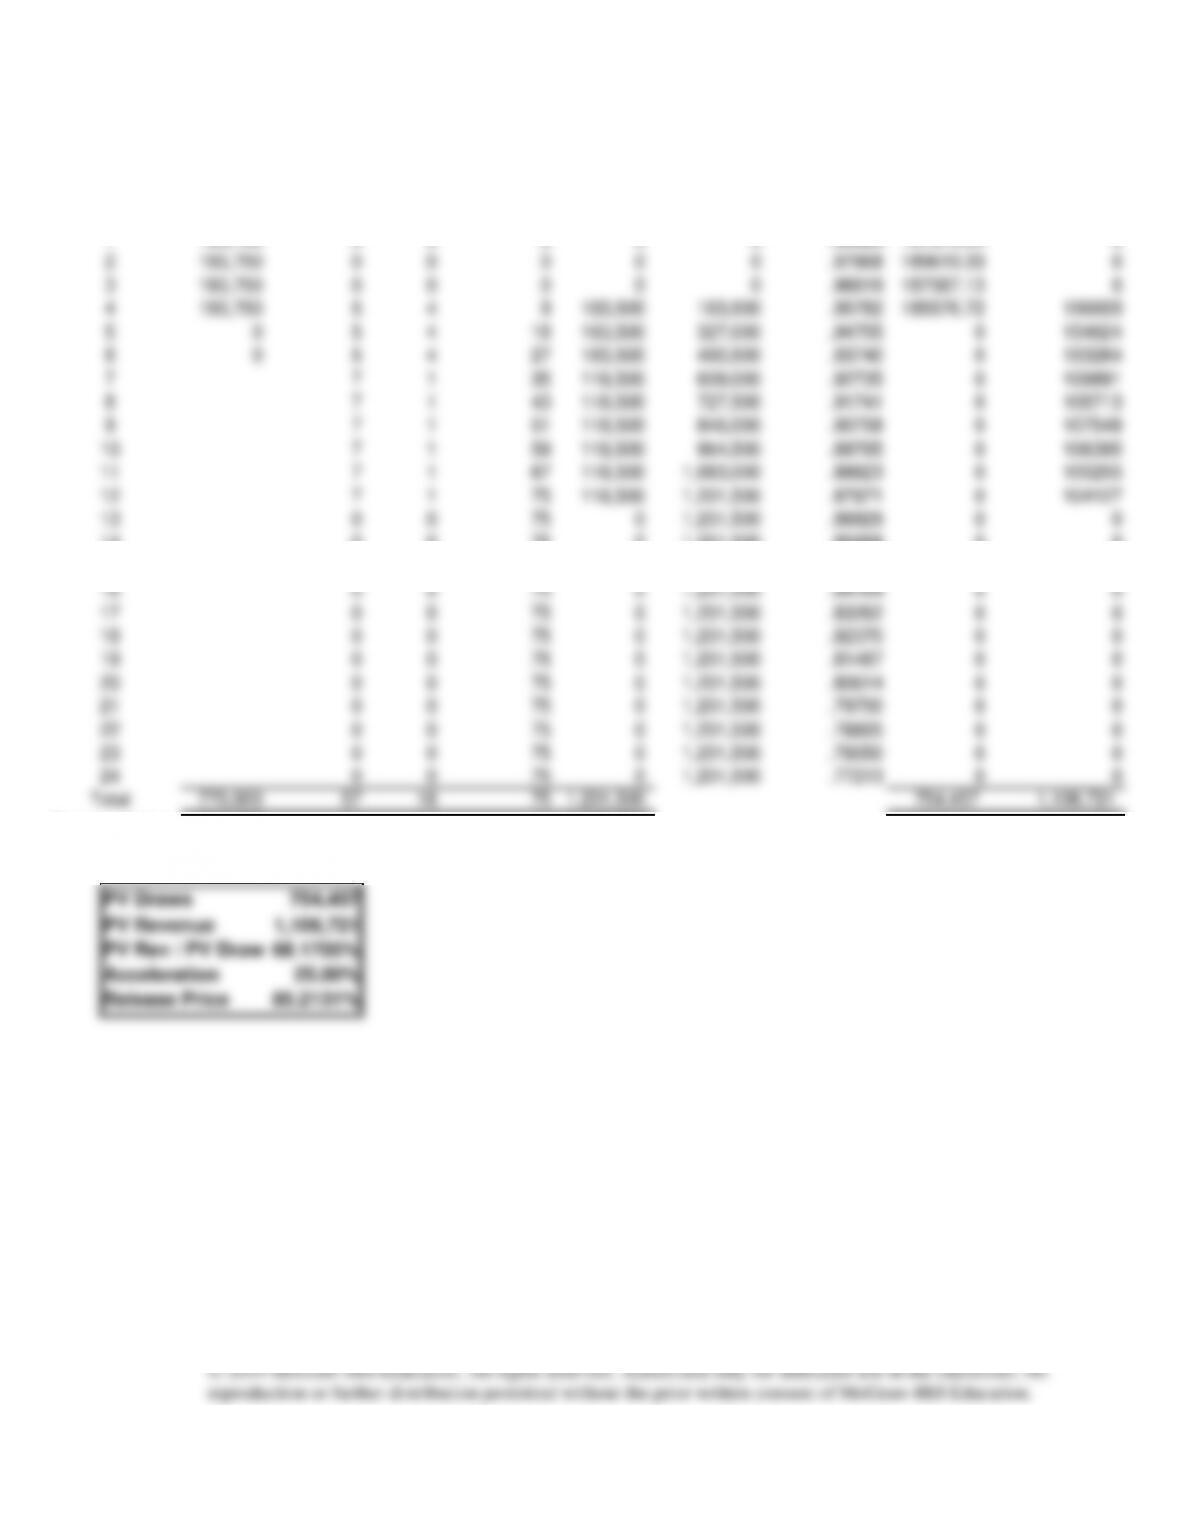
(a) Calculation of the Release Price Per Parcel
Note to users of the 10th edition: This edition of the book uses a simplified approach to calculate the release price. The
answer is identical to the previous edition if the release price is not accelerated and the loan is repaid exactly when the
last lot is sold. The accelerated release price differs slightly from the previous edition but is easier to calculate.
Neither approach is more “correct” than the other. We have simply taken a simpler approach to accelerating the
release price that no longer requires calculating the Total Interest Cary (TLF). Thus, the answer that follows will
differ slightly from the answer shown for the previous edition which uses a slightly different accelerated release price.
Cumulative
Monthly
Cumulative
MPVIF @
PV
Month
Draw
Deluxe
Standard
Units
Sales
Sales
11%
Draws
Monthly Sales
0
600,000
0
0
0
0
0
1.00000
600000
0
1
600,000
0
0
0
0
0
.99092
594549.9587
0
2
600,000
0
0
0
0
0
.98192
589149.4223
0
3
600,000
0
0
0
0
0
.97300
583797.9412
0
4
300,000
4
3
7
260,000
260,000
.96416
289247.5349
250681
5
300,000
4
3
14
260,000
520,000
.95540
286620.1832
248404
6
300,000
4
3
21
260,000
780,000
.94672
284016.6968
246148
7
4
3
28
260,000
1,040,000
.93812
0
243912
8
4
3
35
260,000
1,300,000
.92960
0
241696
9
4
3
42
260,000
1,560,000
.92116
0
239501
10
4
3
49
260,000
1,820,000
.91279
0
237325
11
4
3
56
260,000
2,080,000
.90450
0
235170
12
4
3
63
260,000
2,340,000
.89628
0
233034
13
2
5
70
256,000
2,596,000
.88814
0
227364
14
2
5
77
256,000
2,852,000
.88007
0
225299
15
2
5
84
256,000
3,108,000
.87208
0
223253
16
2
5
91
256,000
3,364,000
.86416
0
221225
17
2
5
98
256,000
3,620,000
.85631
0
219215
18
2
5
105
256,000
3,876,000
.84853
0
217224
19
2
5
112
256,000
4,132,000
.84082
0
215251
20
2
5
119
256,000
4,388,000
.83319
0
213296
21
2
5
126
256,000
4,644,000
.82562
0
211358
22
2
5
133
256,000
4,900,000
.81812
0
209438
23
2
5
140
256,000
5,156,000
.81069
0
207536
24
2
5
147
256,000
5,412,000
.80332
0
205651
Total
3,300,000
60
87
147
5,412,000
3,227,382
4,771,981
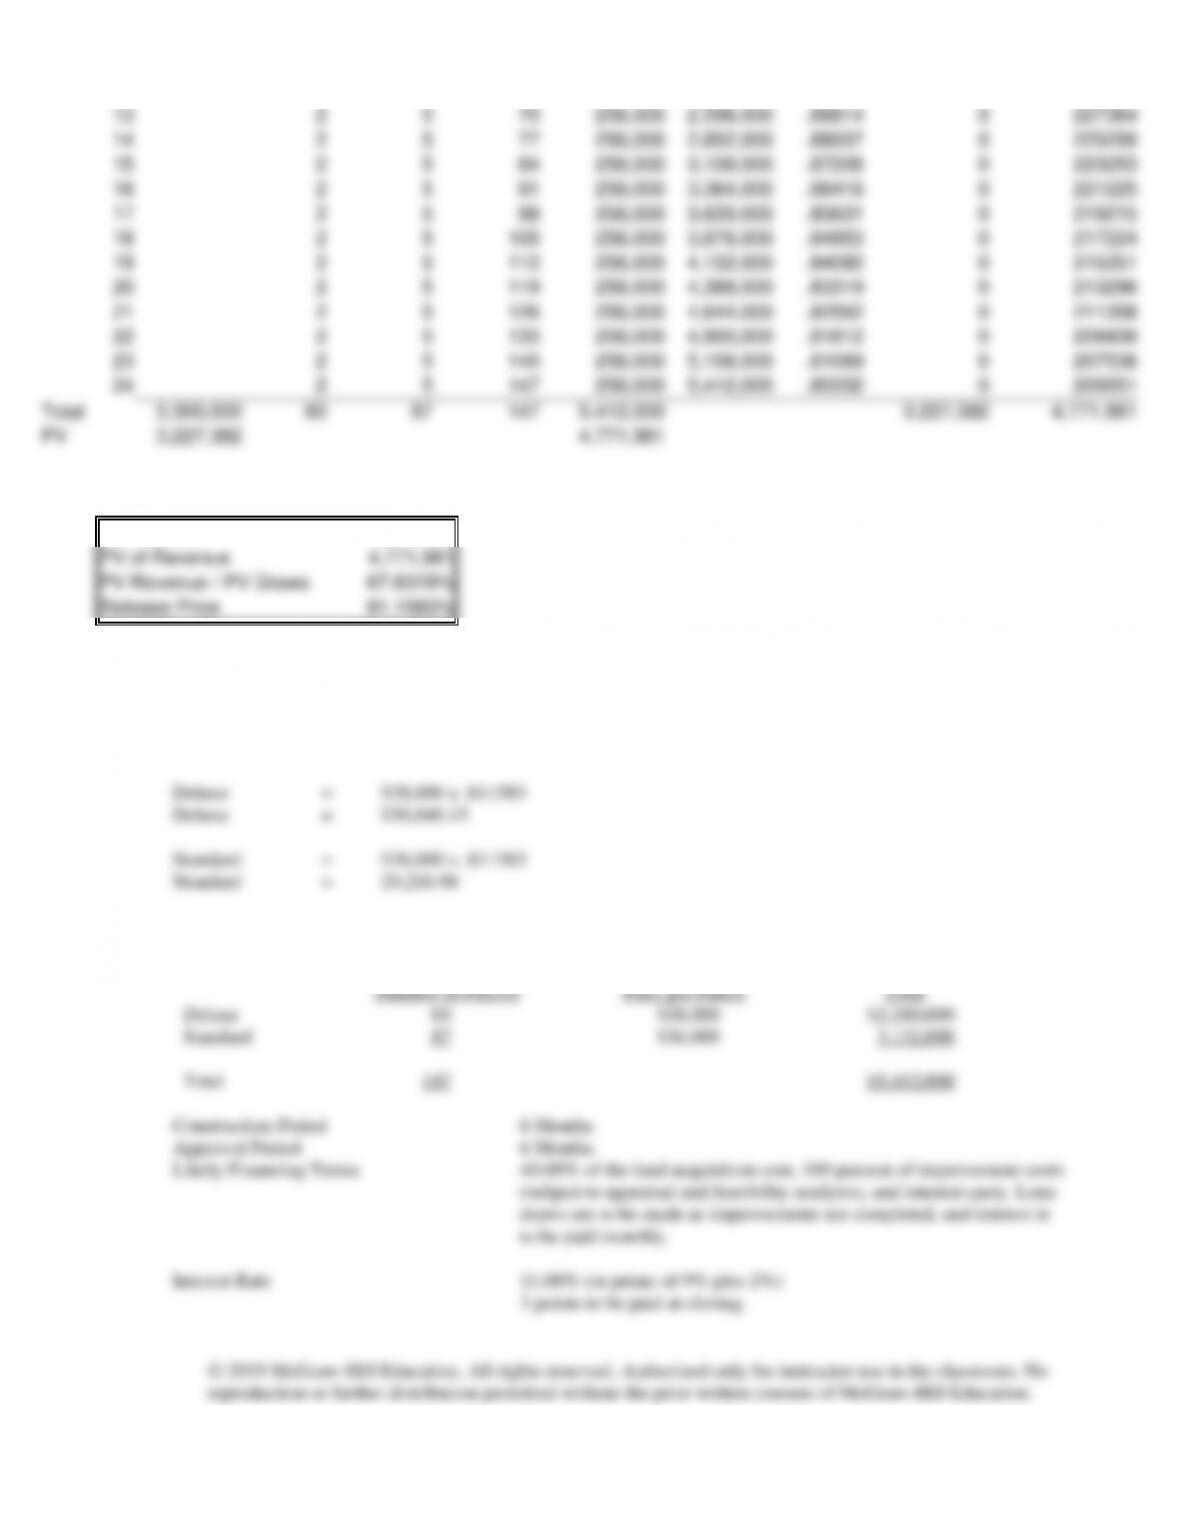
PV
3,227,382
4,771,981
PV of Draws
3,227,382
PV of Revenue
4,771,981
PV Revenue / PV Draws
67.6319%
Release Price
81.1583%
The ratio of the PV of Revenue to PV of Draws above (67.6319%) is what the release price would be if it was not
accelerated and the loan would be repaid exactly when the last lot is sold. Increasing this by 20% (67.6319% x 1.20) gives us
the accelerated release price as a percent of revenue (81.1583%)
For each lot type:
(b)
Price of each parcel:
Number of Parcels
Price per Parcel
Total
Deluxe
60
$38,000
$2,280,000
Standard
87
$36,000
3,132,000
Total
147
$5,412,000
Construction Period 6 Months
Approval Period 6 Months
Likely Financing Terms 40.00% of the land acquisition cost, 100 percent of improvement costs
(subject to appraisal and feasibility analysis), and interest carry. Loan
draws are to be made as improvements are completed, and interest is
to be paid monthly.
Interest Rate 11.00% (or prime of 9% plus 2%)
3 points to be paid at closing.
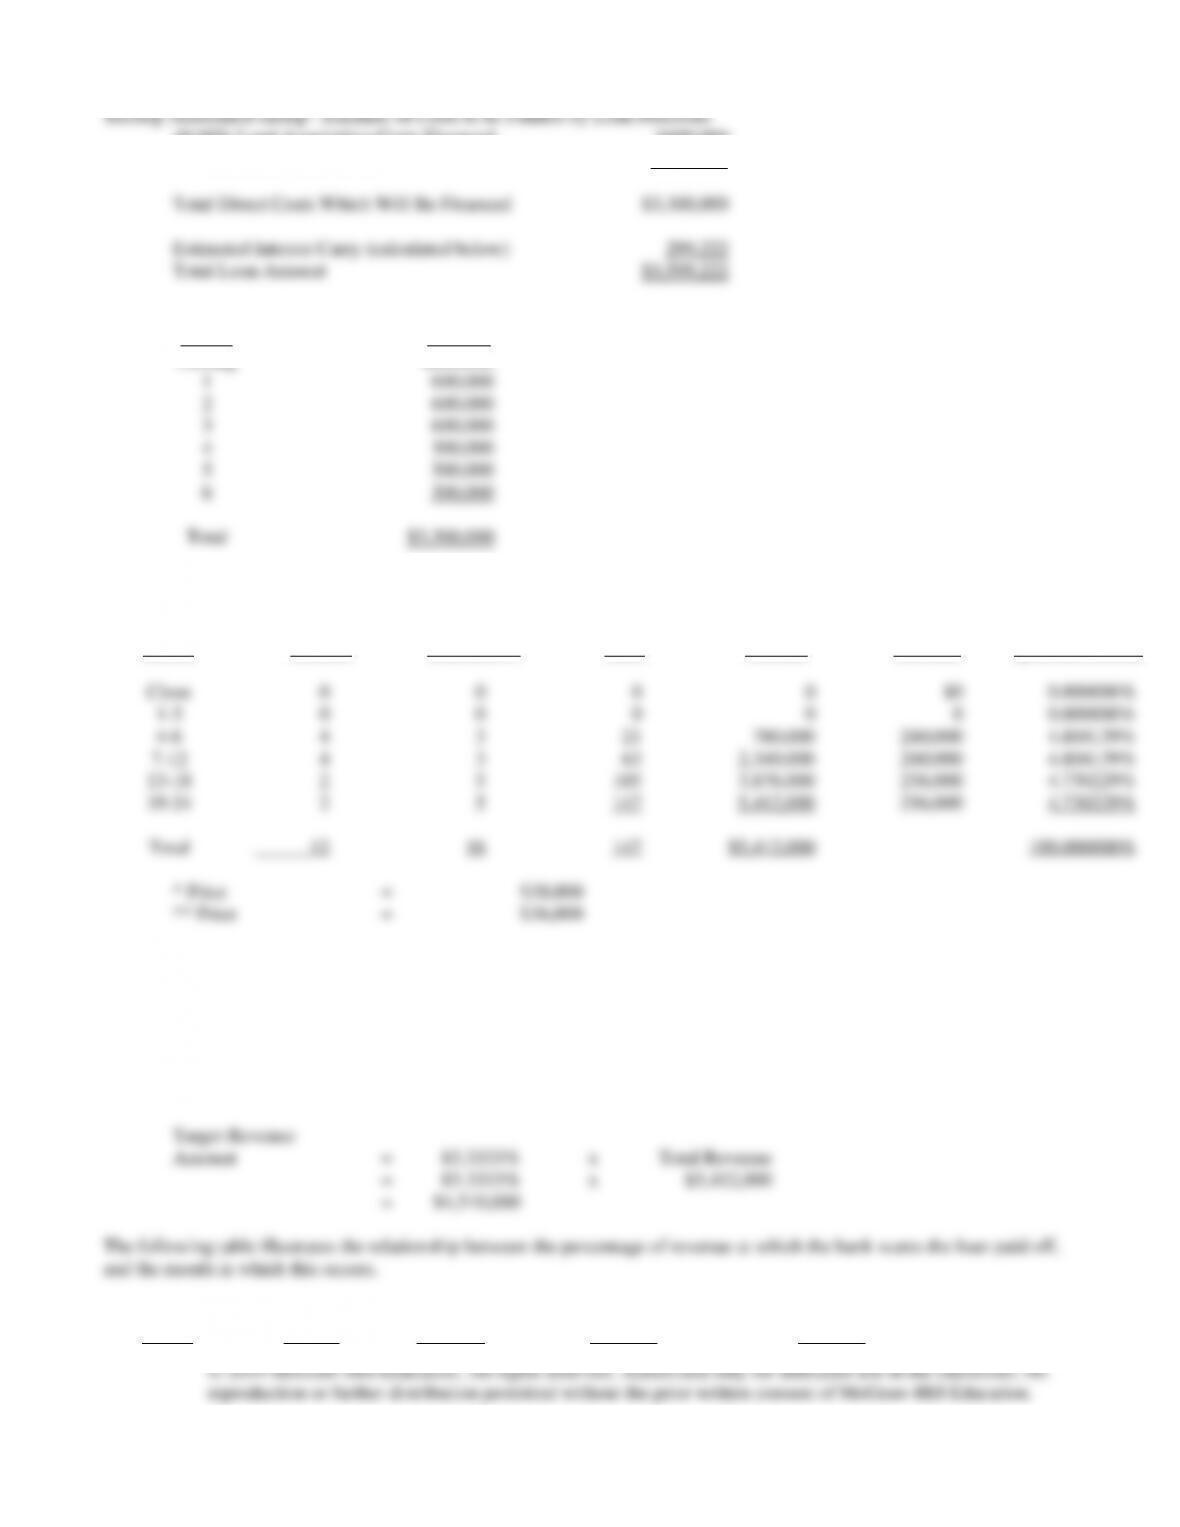
40.00% Land Acquisition Costs Financed $600,000
Direct Development Costs 2,700,000
Treetop Associated Group – Schedule of Estimated Monthly Cash Draws for Development Costs:
Month
Amount
Closing
$600,000
1
600,000
2
600,000
3
600,000
4
300,000
5
300,000
6
300,000
Total
$3,300,000
Treetop Associated Group – Estimated Monthly Absorption Rate After Loan Closing:
Cumulative
Cumulative
Monthly
Monthly
Unit
Sales
Sales
Revenue Rate
Month
Deluxe*
Standard **
Sales
Volume
Revenue
(percent of total)
Close
0
0
0
0
$0
0.000000%
1-3
0
0
0
0
0
0.000000%
4-6
4
3
21
780,000
260,000
4.804139%
7-12
4
3
63
2,340,000
260,000
4.804139%
13–18
2
5
105
3,876,000
256,000
4.730229%
19–24
2
5
147
5,412,000
256,000
4.730229%
Total
12
16
147
$5,412,000
100.000000%
* Price = $38,000
** Price = $36,000
Treetop Associated Group – Determining the Duration of the Construction Loan:
The month in which the loan repayment occurs must be determined to solve for the interest carry. Because the bank wants the
loan paid off 20% faster than the revenue is generated, the loan must be totally repaid when 83.33333% (100% / 120%) of the
revenue is collected.
Cumulative
Monthly Sales
Month
Cluster
Standard
Sales ($)
Revenue
4-6
12
9
$780,000
$260,000
7-12
24
18
2,340,000
260,000
13–18
12
30
3,876,000
256,000
19
2
5
4,132,000
256,000
20
2
5
4,388,000
256,000
21
2
5
4,644,000
256,000
— Repaid during
this month
Treetop Associated Group – Estimate of Interest Carry:
(c)
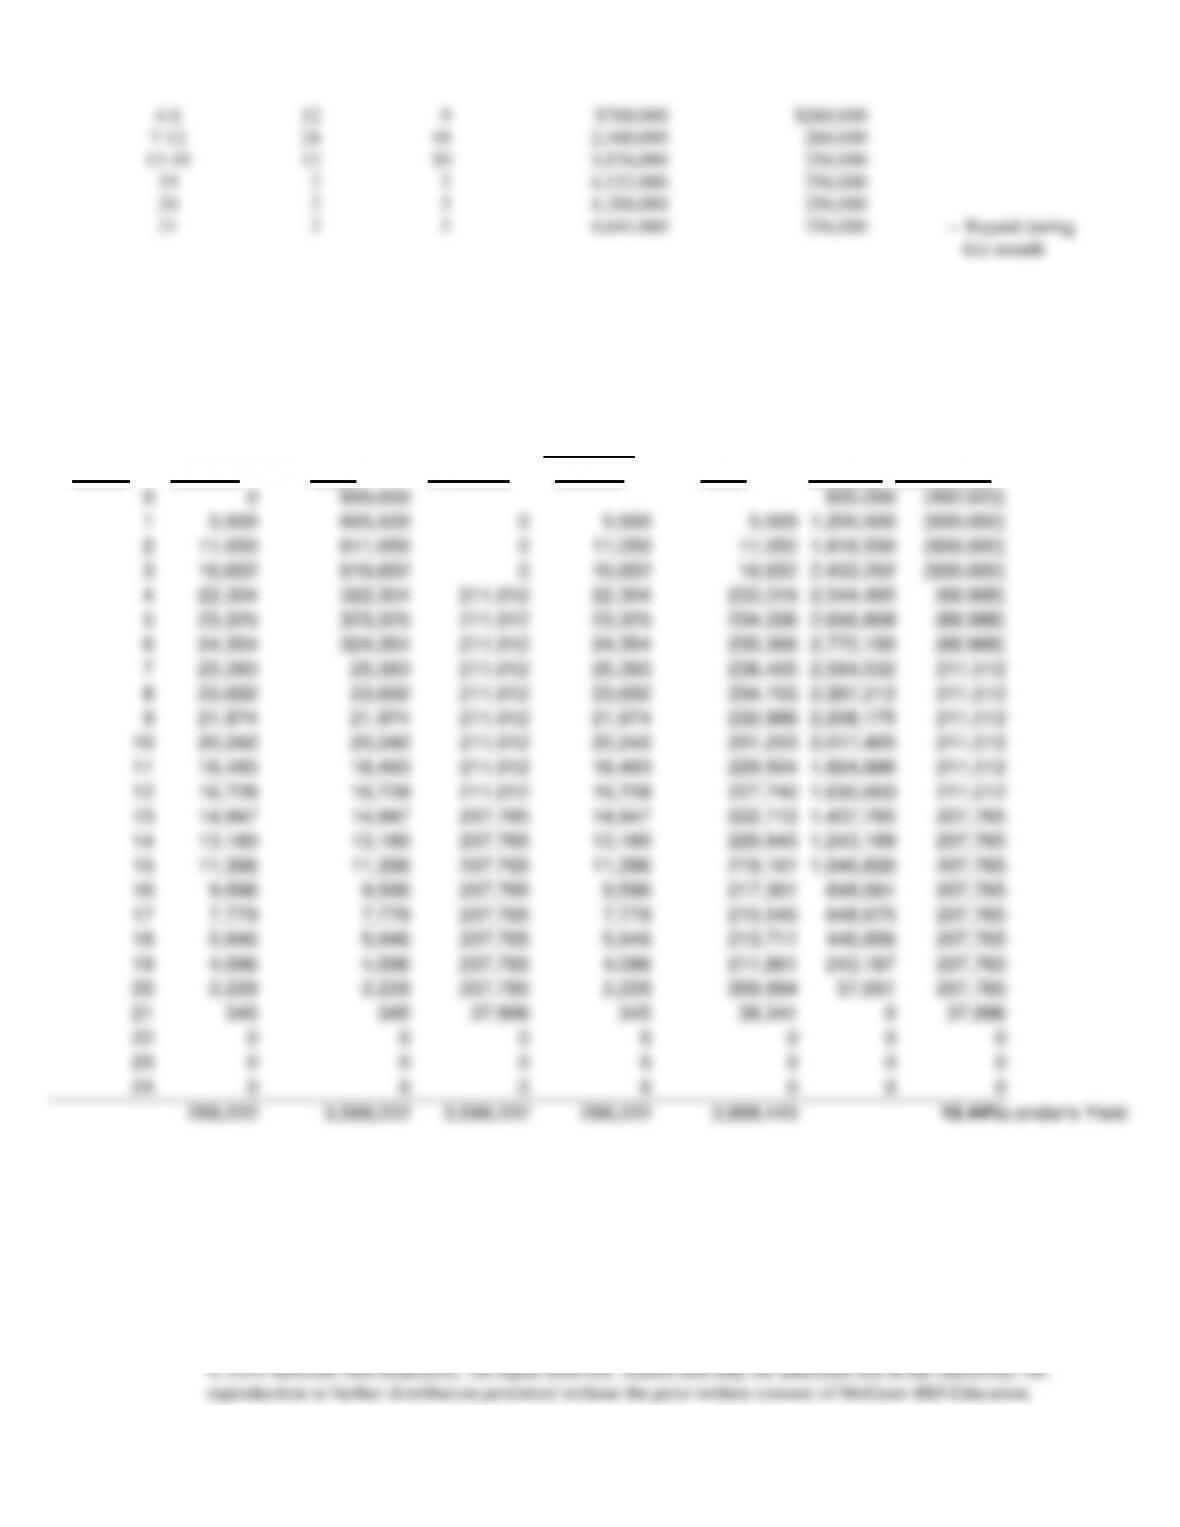
Treetop Associated Group – Loan Repayments Schedule:
Payments
Month
Interest
Total
Principal
Interest
Total
Balance
Cash Flow
0
0
600,000
600,000
(492,023)
1
5,500
605,500
0
5,500
5,500
1,205,500
(600,000)
2
11,050
611,050
0
11,050
11,050
1,816,550
(600,000)
3
16,652
616,652
0
16,652
16,652
2,433,202
(600,000)
4
22,304
322,304
211,012
22,304
233,316
2,544,495
(88,988)
5
23,325
323,325
211,012
23,325
234,336
2,656,808
(88,988)
6
24,354
324,354
211,012
24,354
235,366
2,770,150
(88,988)
7
25,393
25,393
211,012
25,393
236,405
2,584,532
211,012
8
23,692
23,692
211,012
23,692
234,703
2,397,212
211,012
9
21,974
21,974
211,012
21,974
232,986
2,208,175
211,012
10
20,242
20,242
211,012
20,242
231,253
2,017,405
211,012
11
18,493
18,493
211,012
18,493
229,504
1,824,886
211,012
12
16,728
16,728
211,012
16,728
227,740
1,630,603
211,012
13
14,947
14,947
207,765
14,947
222,712
1,437,785
207,765
14
13,180
13,180
207,765
13,180
220,945
1,243,199
207,765
15
11,396
11,396
207,765
11,396
219,161
1,046,830
207,765
16
9,596
9,596
207,765
9,596
217,361
848,661
207,765
17
7,779
7,779
207,765
7,779
215,545
648,675
207,765
18
5,946
5,946
207,765
5,946
213,711
446,856
207,765
19
4,096
4,096
207,765
4,096
211,861
243,187
207,765
20
2,229
2,229
207,765
2,229
209,994
37,651
207,765
21
345
345
37,996
345
38,341
0
37,996
22
0
0
0
0
0
0
0
23
0
0
0
0
0
0
0
24
0
0
0
0
0
0
0
299,222
3,599,222
3,599,222
299,222
3,898,443
15.44%
Lender’s Yield
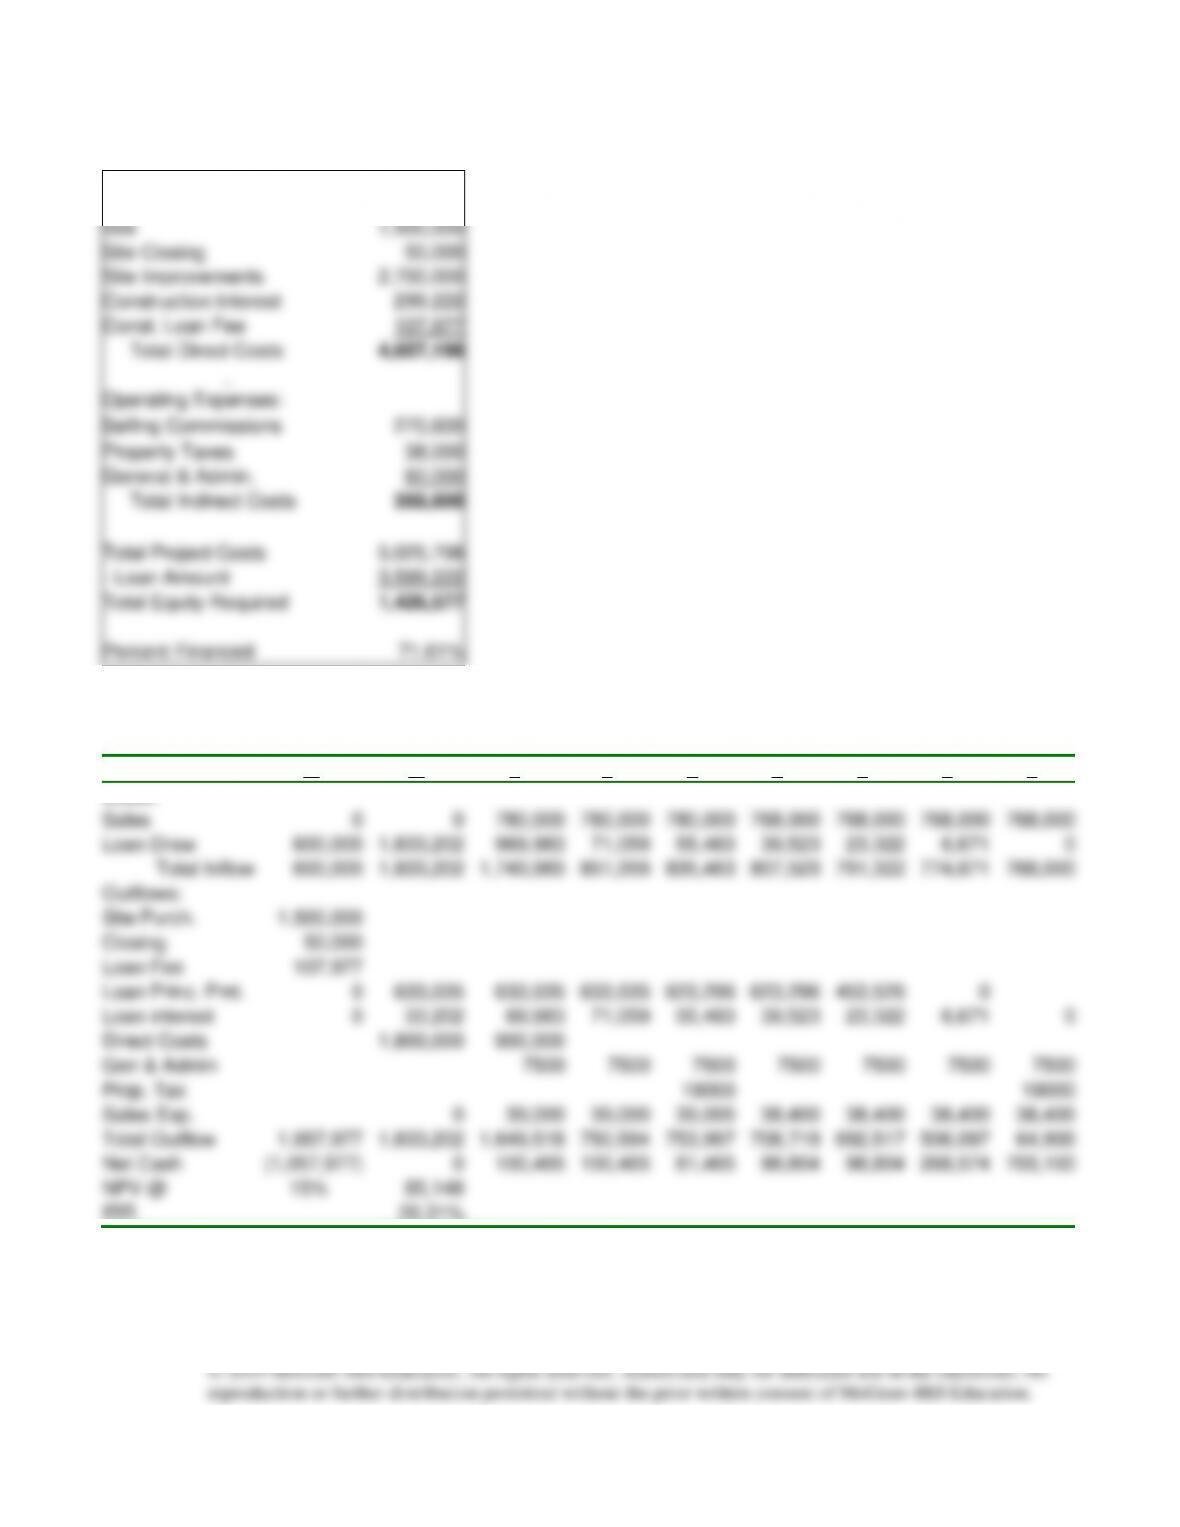
(d)
Treetop Associated Group – Estimated Project Costs and Equity Requirements
Land and Development
Costs:
Site
1,500,000
Site Closing
50,000
Site Improvements
2,700,000
Construction Interest
299,222
Const. Loan Fee
107,977
Total Direct Costs
4,657,198
Operating Expenses:
Selling Commissions
270,600
Property Taxes
38,000
General & Admin.
60,000
Total Indirect Costs
368,600
Total Project Costs
5,025,798
– Loan Amount
3,599,222
Total Equity Required
1,426,577
Percent Financed
71.61%
(e)
Treetop Associated Group – Schedule of Cash Flows
Quarter
0
1
2
3
4
5
6
7
8
Inflow:
Sales
0
0
780,000
780,000
780,000
768,000
768,000
768,000
768,000
Loan Draw
600,000
1,833,202
969,983
71,059
55,463
39,523
23,322
6,671
0
Total Inflow
600,000
1,833,202
1,749,983
851,059
835,463
807,523
791,322
774,671
768,000
Outflows:
Site Purch.
1,500,000
Closing
50,000
Loan Fee
107,977
Loan Princ. Pmt.
0
633,035
633,035
633,035
623,296
623,296
453,526
0
Loan interest
0
33,202
69,983
71,059
55,463
39,523
23,322
6,671
0
Direct Costs
1,800,000
900,000
Gen & Admin
7500
7500
7500
7500
7500
7500
7500
Prop. Tax
19000
19000
Sales Exp.
0
39,000
39,000
39,000
38,400
38,400
38,400
38,400
Total Outflow
1,657,977
1,833,202
1,649,518
750,594
753,997
708,719
692,517
506,097
64,900
Net Cash
(1,057,977)
0
100,465
100,465
81,465
98,804
98,804
268,574
703,100
NPV @
15%
85,148
IRR
20.31%
Problem 17-3
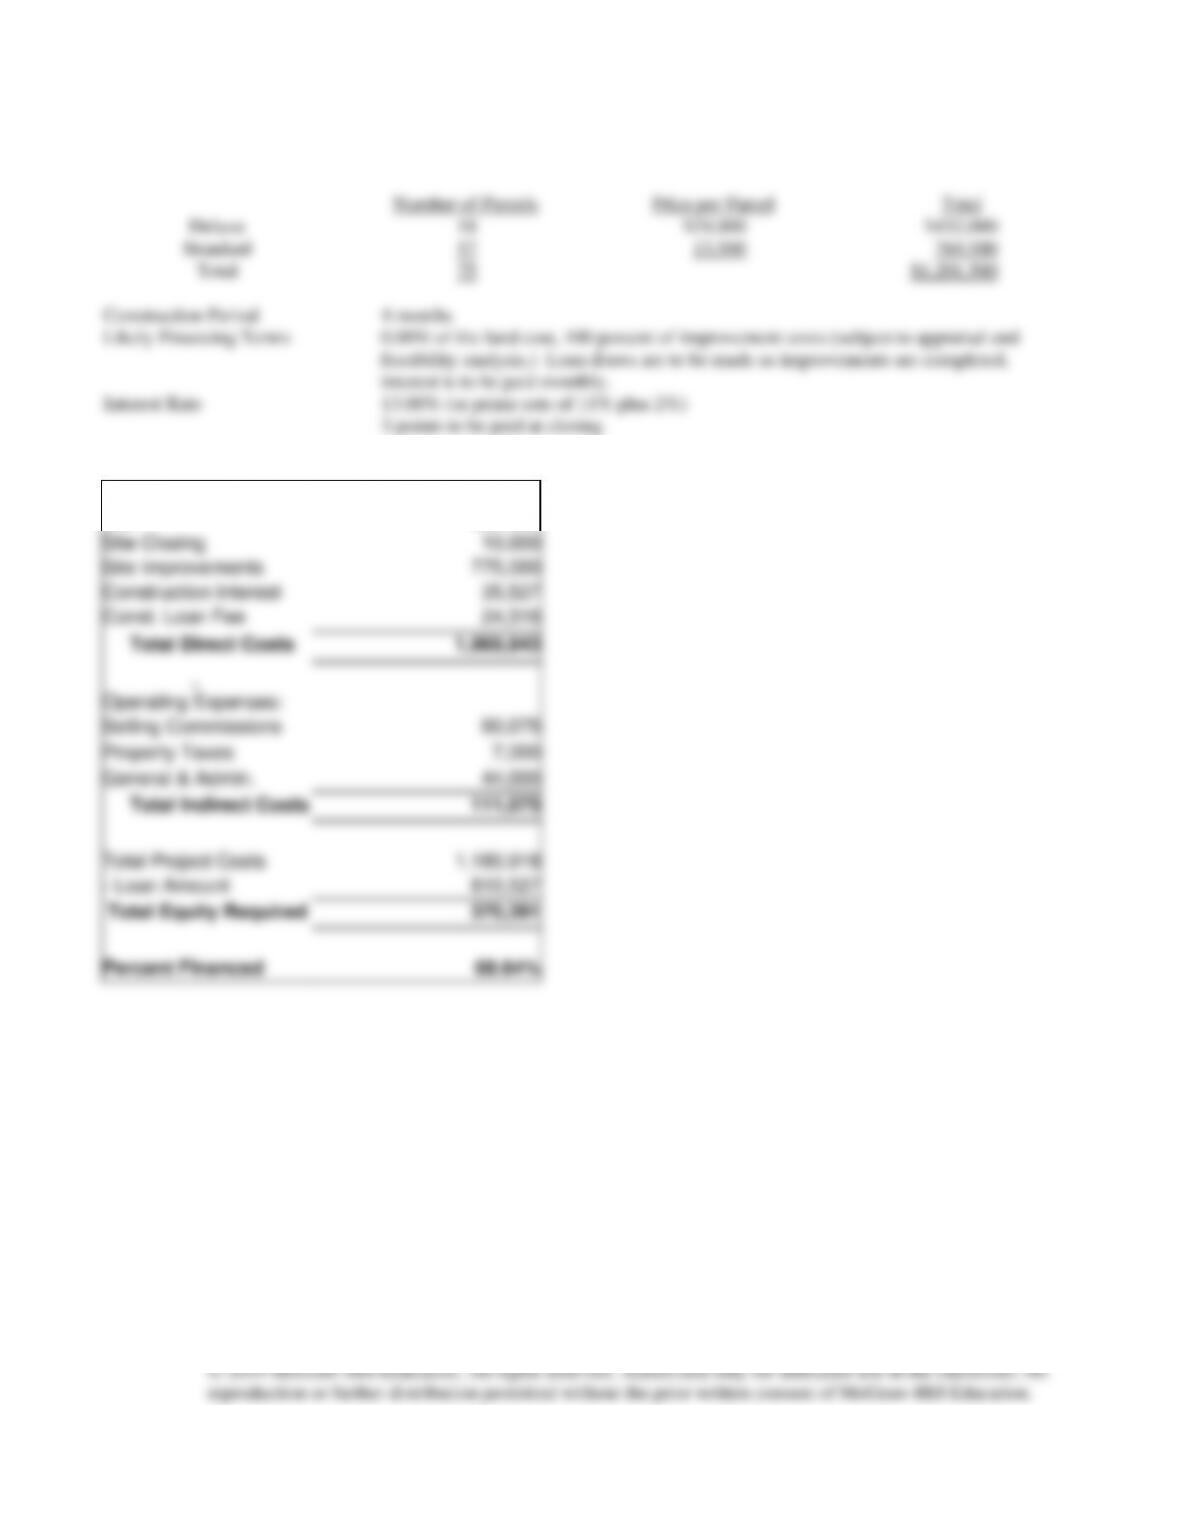
(a)
Price of each parcel
Land and Development Costs:
Site
225,000
Site Closing
10,000
Site Improvements
775,000
Construction Interest
35,527
Const. Loan Fee
24,316
Total Direct Costs
1,069,843
Operating Expenses:
Selling Commissions
60,075
Property Taxes
7,000
General & Admin.
44,000
Total Indirect Costs
111,075
Total Project Costs
1,180,918
– Loan Amount
810,527
Total Equity Required
370,391
Percent Financed
68.64%
PV Draws
754,457
PV Revenue
1,106,721
Acceleration
Release Price
PRESENT VALUES, ACCELERATION, & RESALE PRICE:
Cumulative Monthly Cumulative MPVIF @ PV
Month Draw Standard Delux Units Sales Sales 13% Draws Monthly Sales
0 0 0 0 0 0 0 1.00000 0 0
1193,750 0 0 0 0 0 .98928 191673.54 0
2193,750 0 0 0 0 0 .97868 189619.33 0
3193,750 0 0 0 0 0 .96819 187587.13 0
4193,750 5 4 9 163,500 163,500 .95782 185576.72 156603
5 0 5 4 18 163,500 327,000 .94755 0154924
6 0 5 4 27 163,500 490,500 .93740 0153264
7 7 1 35 118,500 609,000 .92735 0109891
8 7 1 43 118,500 727,500 .91741 0108713
9 7 1 51 118,500 846,000 .90758 0107548
10 7 1 59 118,500 964,500 .89785 0106395
11 7 1 67 118,500 1,083,000 .88823 0105255
12 7 1 75 118,500 1,201,500 .87871 0104127
13 0 0 75 01,201,500 .86929 0 0
14 0 0 75 01,201,500 .85998 0 0
15 0 0 75 01,201,500 .85076 0 0
16 0 0 75 01,201,500 .84164 0 0
17 0 0 75 01,201,500 .83262 0 0
18 0 0 75 01,201,500 .82370 0 0
19 0 0 75 01,201,500 .81487 0 0
20 0 0 75 01,201,500 .80614 0 0
21 0 0 75 01,201,500 .79750 0 0
22 0 0 75 01,201,500 .78895 0 0
23 0 0 75 01,201,500 .78050 0 0
24 0 0 75 01,201,500 .77213 0 0
Total 775,000 57 18 75 1,201,500 754,457 1,106,721
Present Value 754,457 1,106,721
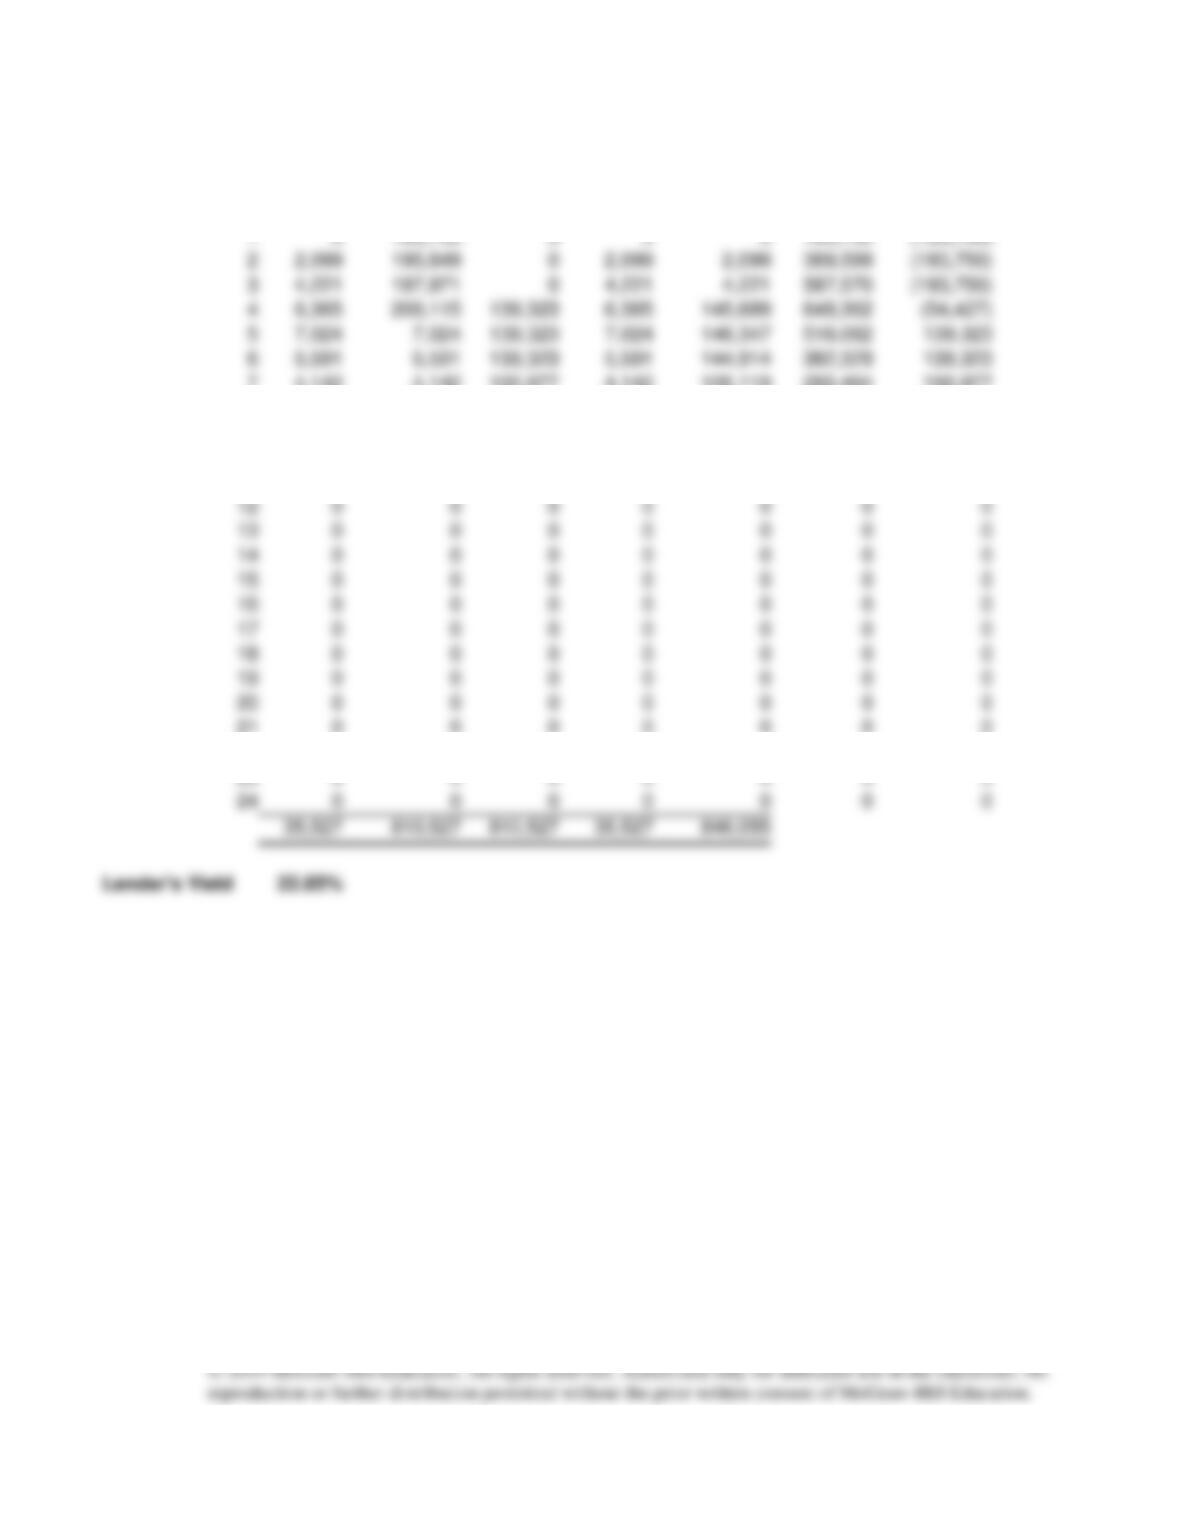
LOAN SCHEDULE AND LENDER’S IRR
Payments
Month
Interest
Total Draw
Principal
Interest
Total
Balance
Cash Flow
0
0
0
0
24,316
1
0
193,750
0
0
0
193,750
(193,750)
2
2,099
195,849
0
2,099
2,099
389,599
(193,750)
3
4,221
197,971
0
4,221
4,221
587,570
(193,750)
4
6,365
200,115
139,323
6,365
145,689
648,362
(54,427)
5
7,024
7,024
139,323
7,024
146,347
516,062
139,323
6
5,591
5,591
139,323
5,591
144,914
382,329
139,323
7
4,142
4,142
100,977
4,142
105,119
285,494
100,977
8
3,093
3,093
100,977
3,093
104,070
187,609
100,977
9
2,032
2,032
100,977
2,032
103,010
88,664
100,977
10
961
961
89,625
961
90,585
0
89,625
11
0
0
0
0
0
0
0
12
0
0
0
0
0
0
0
13
0
0
0
0
0
0
0
14
0
0
0
0
0
0
0
15
0
0
0
0
0
0
0
16
0
0
0
0
0
0
0
17
0
0
0
0
0
0
0
18
0
0
0
0
0
0
0
19
0
0
0
0
0
0
0
20
0
0
0
0
0
0
0
21
0
0
0
0
0
0
0
22
0
0
0
0
0
0
0
23
0
0
0
0
0
0
0
24
0
0
0
0
0
0
0
35,527
810,527
810,527
35,527
846,055
Lender’s Yield
22.85%
(b) The total interest is $35,527 as shown above.
(c) Total equity requirements will be $177,842 + $11,000 = $188,842 (see below).
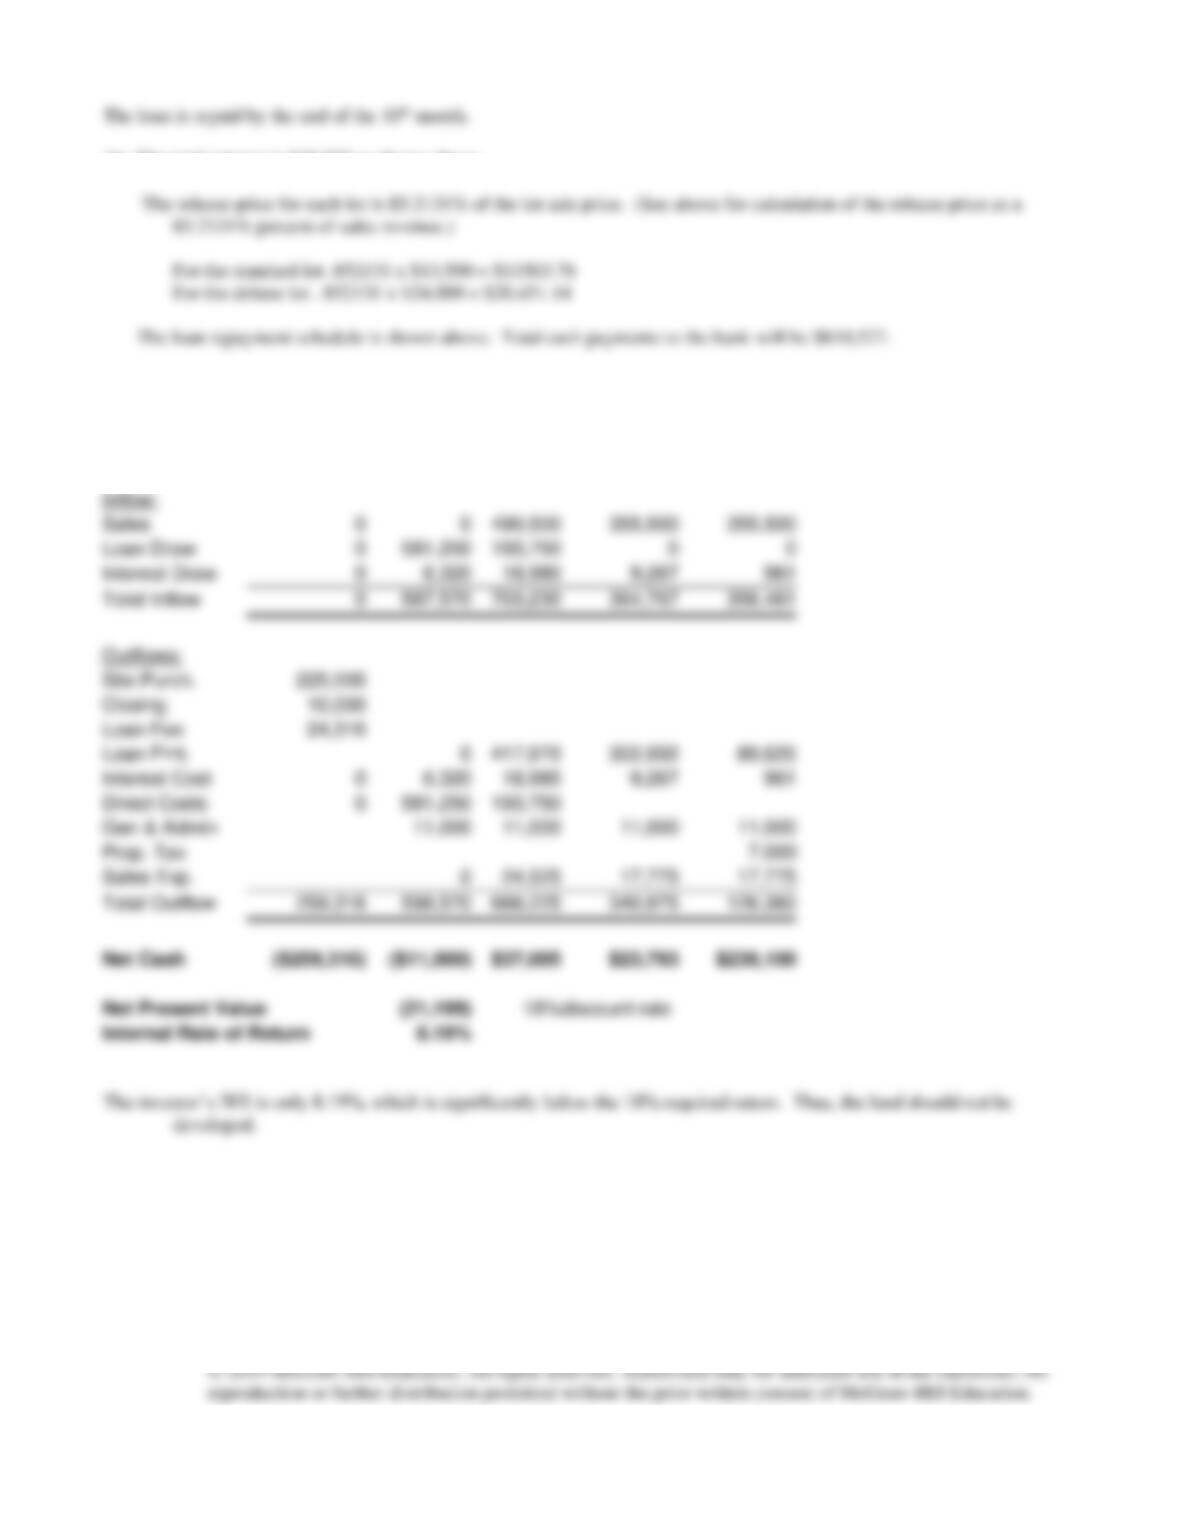
DEVELOPER’S CASH FLOW, NPV AND IRR
Quarter
0
1
2
3
4
Inflow:
Sales
0
0
490,500
355,500
355,500
Loan Draw
0
581,250
193,750
0
0
Interest Draw
0
6,320
18,980
9,267
961
Total Inflow
0
587,570
703,230
364,767
356,461
Outflows:
Site Purch.
225,000
Closing
10,000
Loan Fee
24,316
Loan Pmt.
0
417,970
302,932
89,625
Interest Cost
0
6,320
18,980
9,267
961
Direct Costs
0
581,250
193,750
Gen & Admin
11,000
11,000
11,000
11,000
Prop. Tax
7,000
Sales Exp.
0
24,525
17,775
17,775
Total Outflow
259,316
598,570
666,225
340,975
126,360
Net Cash
($259,316)
($11,000)
$37,005
$23,793
$230,100
Net Present Value
(21,199)
18%
discount rate
Internal Rate of Return
8.19%
Problem 17-4
(a)
No acceleration
PV Draws
754,457
PV Revenue
1,106,721
PV Rev / PV Draw
68.1705%
Acceleration
0.00%
Release Price
68.1705%
LOAN SCHEDULE AND LENDER’S IRR
Payments
Month
Interest
Total Draw
Principal
Interest
Total
Balance
Cash Flow
0
0
0
0
24,572
1
0
193,750
0
0
0
193,750
(193,750)
2
2,099
195,849
0
2,099
2,099
389,599
(193,750)
3
4,221
197,971
0
4,221
4,221
587,570
(193,750)
4
6,365
200,115
111,459
6,365
117,824
676,226
(82,291)
5
7,326
7,326
111,459
7,326
118,784
572,093
111,459
6
6,198
6,198
111,459
6,198
117,656
466,832
111,459
7
5,057
5,057
80,782
5,057
85,839
391,108
80,782
8
4,237
4,237
80,782
4,237
85,019
314,563
80,782
9
3,408
3,408
80,782
3,408
84,190
237,188
80,782
10
2,570
2,570
80,782
2,570
83,352
158,976
80,782
11
1,722
1,722
80,782
1,722
82,504
79,916
80,782
12
866
866
80,782
866
81,648
0
80,782
13
0
0
0
0
0
0
0
14
0
0
0
0
0
0
0
15
0
0
0
0
0
0
0
16
0
0
0
0
0
0
0
17
0
0
0
0
0
0
0
18
0
0
0
0
0
0
0
19
0
0
0
0
0
0
0
20
0
0
0
0
0
0
0
21
0
0
0
0
0
0
0
22
0
0
0
0
0
0
0
23
0
0
0
0
0
0
0
24
0
0
0
0
0
0
0
44,068
819,068
819,068
44,068
863,136
Lender’s Yield
21.06%

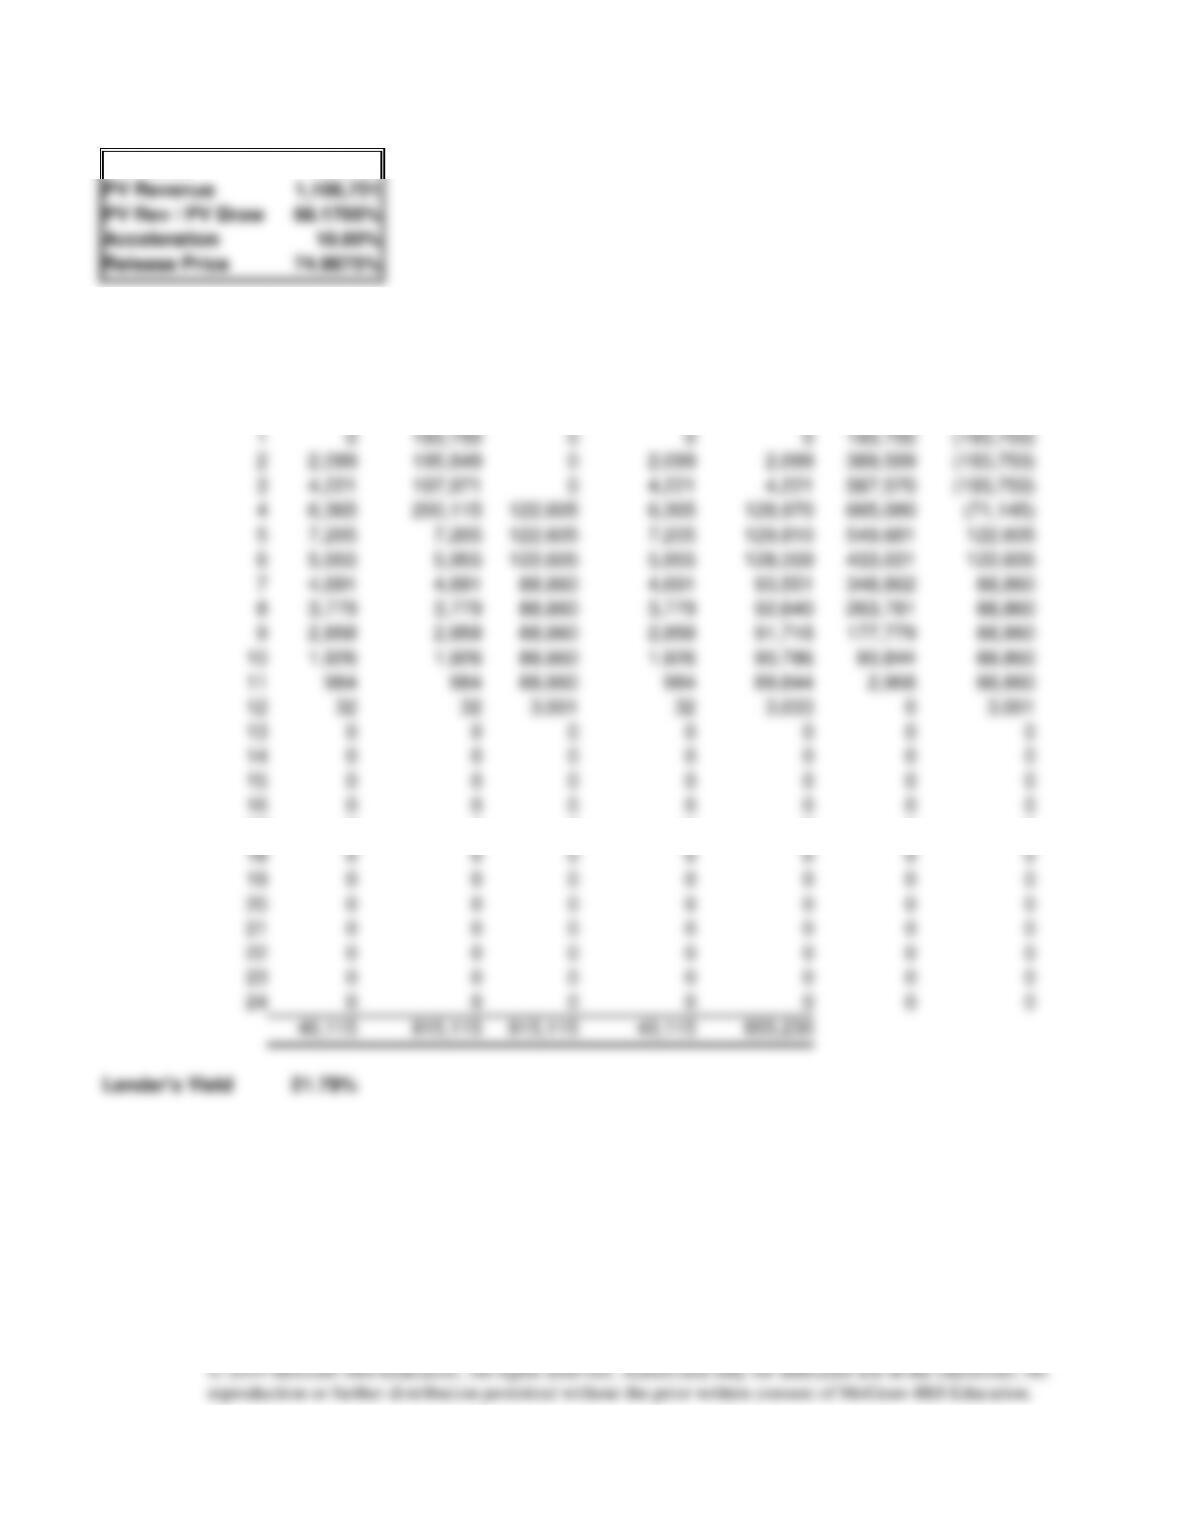
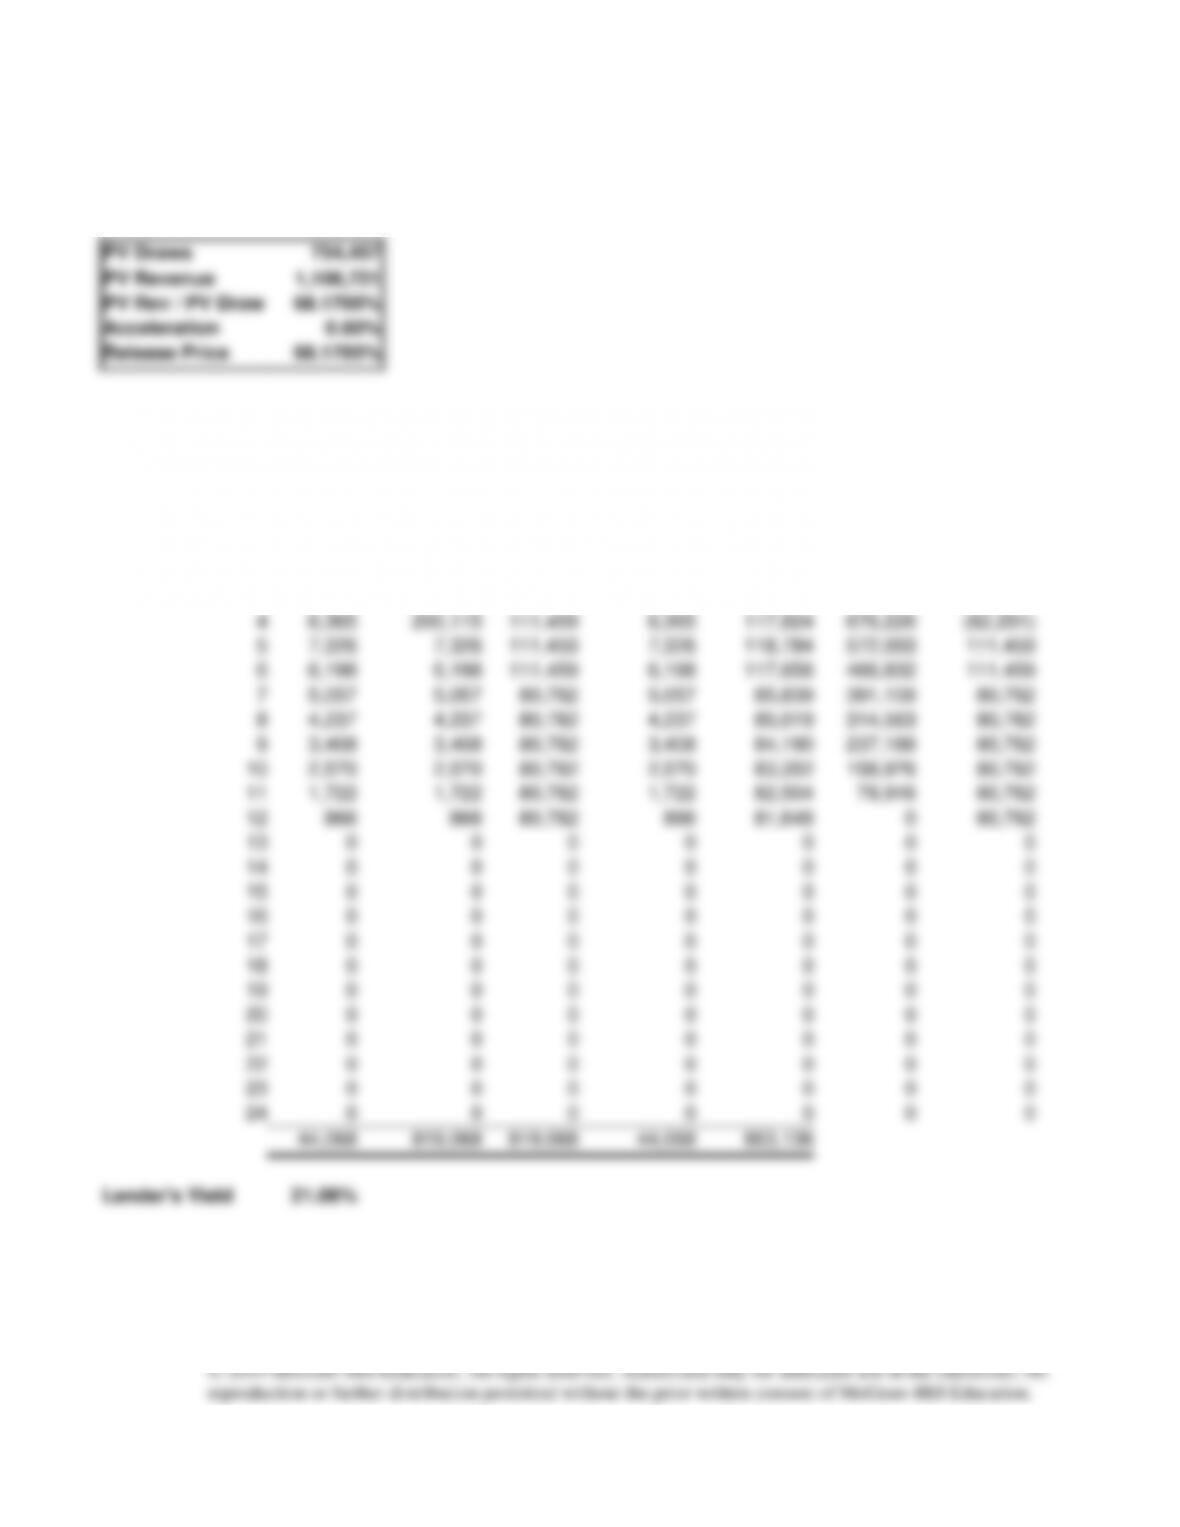
10% acceleration
PV Draws
754,457
PV Revenue
1,106,721
PV Rev / PV Draw
68.1705%
Acceleration
10.00%
Release Price
74.9875%
LOAN SCHEDULE AND LENDER’S IRR
Payments
Month
Interest
Total Draw
Principal
Interest
Total
Balance
Cash Flow
0
0
0
0
24,453
1
0
193,750
0
0
0
193,750
(193,750)
2
2,099
195,849
0
2,099
2,099
389,599
(193,750)
3
4,221
197,971
0
4,221
4,221
587,570
(193,750)
4
6,365
200,115
122,605
6,365
128,970
665,080
(71,145)
5
7,205
7,205
122,605
7,205
129,810
549,681
122,605
6
5,955
5,955
122,605
5,955
128,559
433,031
122,605
7
4,691
4,691
88,860
4,691
93,551
348,862
88,860
8
3,779
3,779
88,860
3,779
92,640
263,781
88,860
9
2,858
2,858
88,860
2,858
91,718
177,779
88,860
10
1,926
1,926
88,860
1,926
90,786
90,844
88,860
11
984
984
88,860
984
89,844
2,968
88,860
12
32
32
3,001
32
3,033
0
3,001
13
0
0
0
0
0
0
0
14
0
0
0
0
0
0
0
15
0
0
0
0
0
0
0
16
0
0
0
0
0
0
0
17
0
0
0
0
0
0
0
18
0
0
0
0
0
0
0
19
0
0
0
0
0
0
0
20
0
0
0
0
0
0
0
21
0
0
0
0
0
0
0
22
0
0
0
0
0
0
0
23
0
0
0
0
0
0
0
24
0
0
0
0
0
0
0
40,115
815,115
815,115
40,115
855,230
Lender’s Yield
21.79%
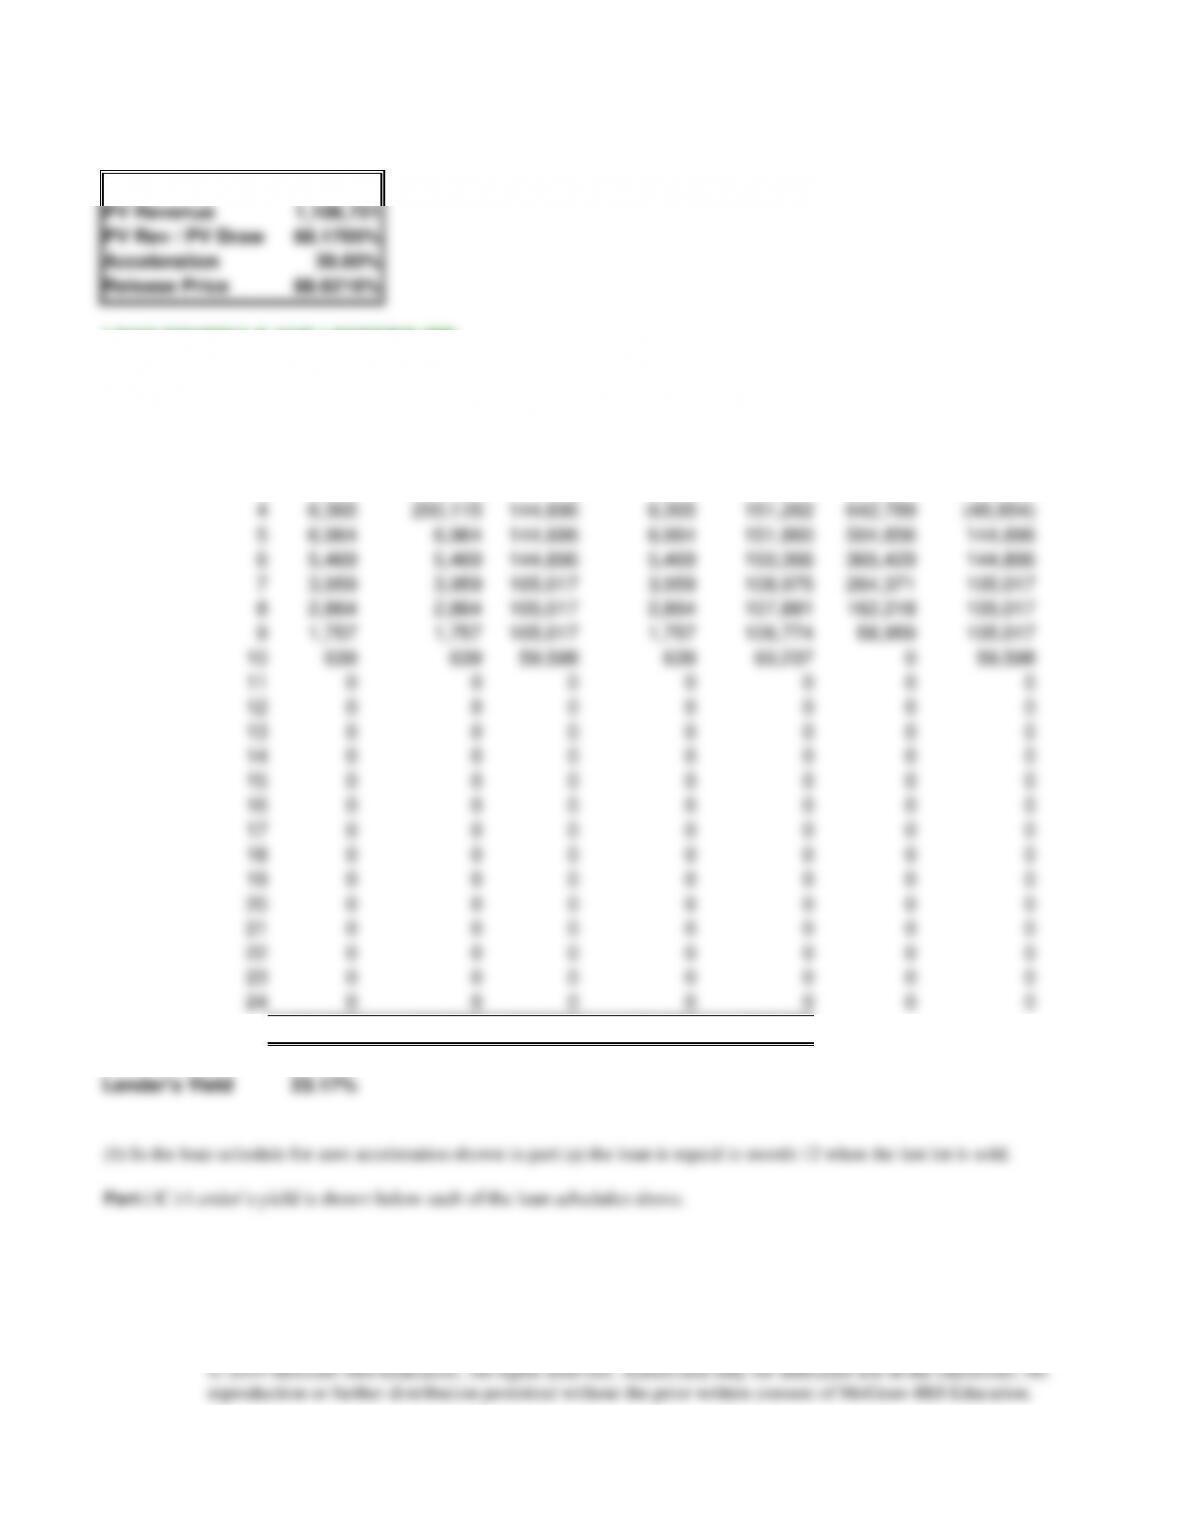
30% acceleration
PV Draws
754,457
PV Revenue
1,106,721
PV Rev / PV Draw
68.1705%
Acceleration
30.00%
Release Price
88.6216%
LOAN SCHEDULE AND LENDER’S IRR
Payments
Month
Interest
Total Draw
Principal
Interest
Total
Balance
Cash Flow
0
0
0
0
24,280
1
0
193,750
0
0
0
193,750
(193,750)
2
2,099
195,849
0
2,099
2,099
389,599
(193,750)
3
4,221
197,971
0
4,221
4,221
587,570
(193,750)
4
6,365
200,115
144,896
6,365
151,262
642,789
(48,854)
5
6,964
6,964
144,896
6,964
151,860
504,856
144,896
6
5,469
5,469
144,896
5,469
150,366
365,429
144,896
7
3,959
3,959
105,017
3,959
108,975
264,371
105,017
8
2,864
2,864
105,017
2,864
107,881
162,218
105,017
9
1,757
1,757
105,017
1,757
106,774
58,959
105,017
10
639
639
59,598
639
60,237
0
59,598
11
0
0
0
0
0
0
0
12
0
0
0
0
0
0
0
13
0
0
0
0
0
0
0
14
0
0
0
0
0
0
0
15
0
0
0
0
0
0
0
16
0
0
0
0
0
0
0
17
0
0
0
0
0
0
0
18
0
0
0
0
0
0
0
19
0
0
0
0
0
0
0
20
0
0
0
0
0
0
0
21
0
0
0
0
0
0
0
22
0
0
0
0
0
0
0
23
0
0
0
0
0
0
0
24
0
0
0
0
0
0
0
34,337
809,337
809,337
34,337
843,673
Lender’s Yield
23.17%