Solutions to Questions – Chapter 16
Financing Project Development
Question 16-1
What are the sources of risk associated with project development?
Question 16-2
What are two development strategies that many developers follow?
Question 16-3
What contingencies are commonly found in permanent or take-out loan commitments? Why are they used? What
happens if they are not met by the developer?
Question 16-4
What is a standby commitment? When and why is it used?
Question 16-5
A presale agreement is said to be equivalent to a take-out commitment. What will the construction lender be
concerned about if the developer plans to use such an agreement in lieu of a take-out?
Question 16-6
What is the major concern construction lenders express about the income approach to estimating value? Why do
they prefer to use the cost approach when possible? In the latter case, if the developer has owned the land for five
years prior to development would the cost approach be more effective? Why or why not?
Question 16-7
What do we mean by overage in a retail lease agreement? How might it be calculated?
Question 16-8
What are “gross ups” in determining tenant reimbursements for operating expenses? Why are they used?
Question 16-9
What is sensitivity analysis? How might it be used in real estate development?
Question 16-10
It is sometimes said that land represents “residual” value. This statement reflects the fact that improvement costs
do not vary materially from one location to another whereas rents vary considerably. Hence, land values reflect
changes in rents (both up and down) from location to location. Do you agree or disagree?
Question 16-11
What are holdbacks in construction lending? Why is the practice of “holdbacks” used?
Solutions to Problems – Chapter 16
Financing Project Development
Problem 16-1
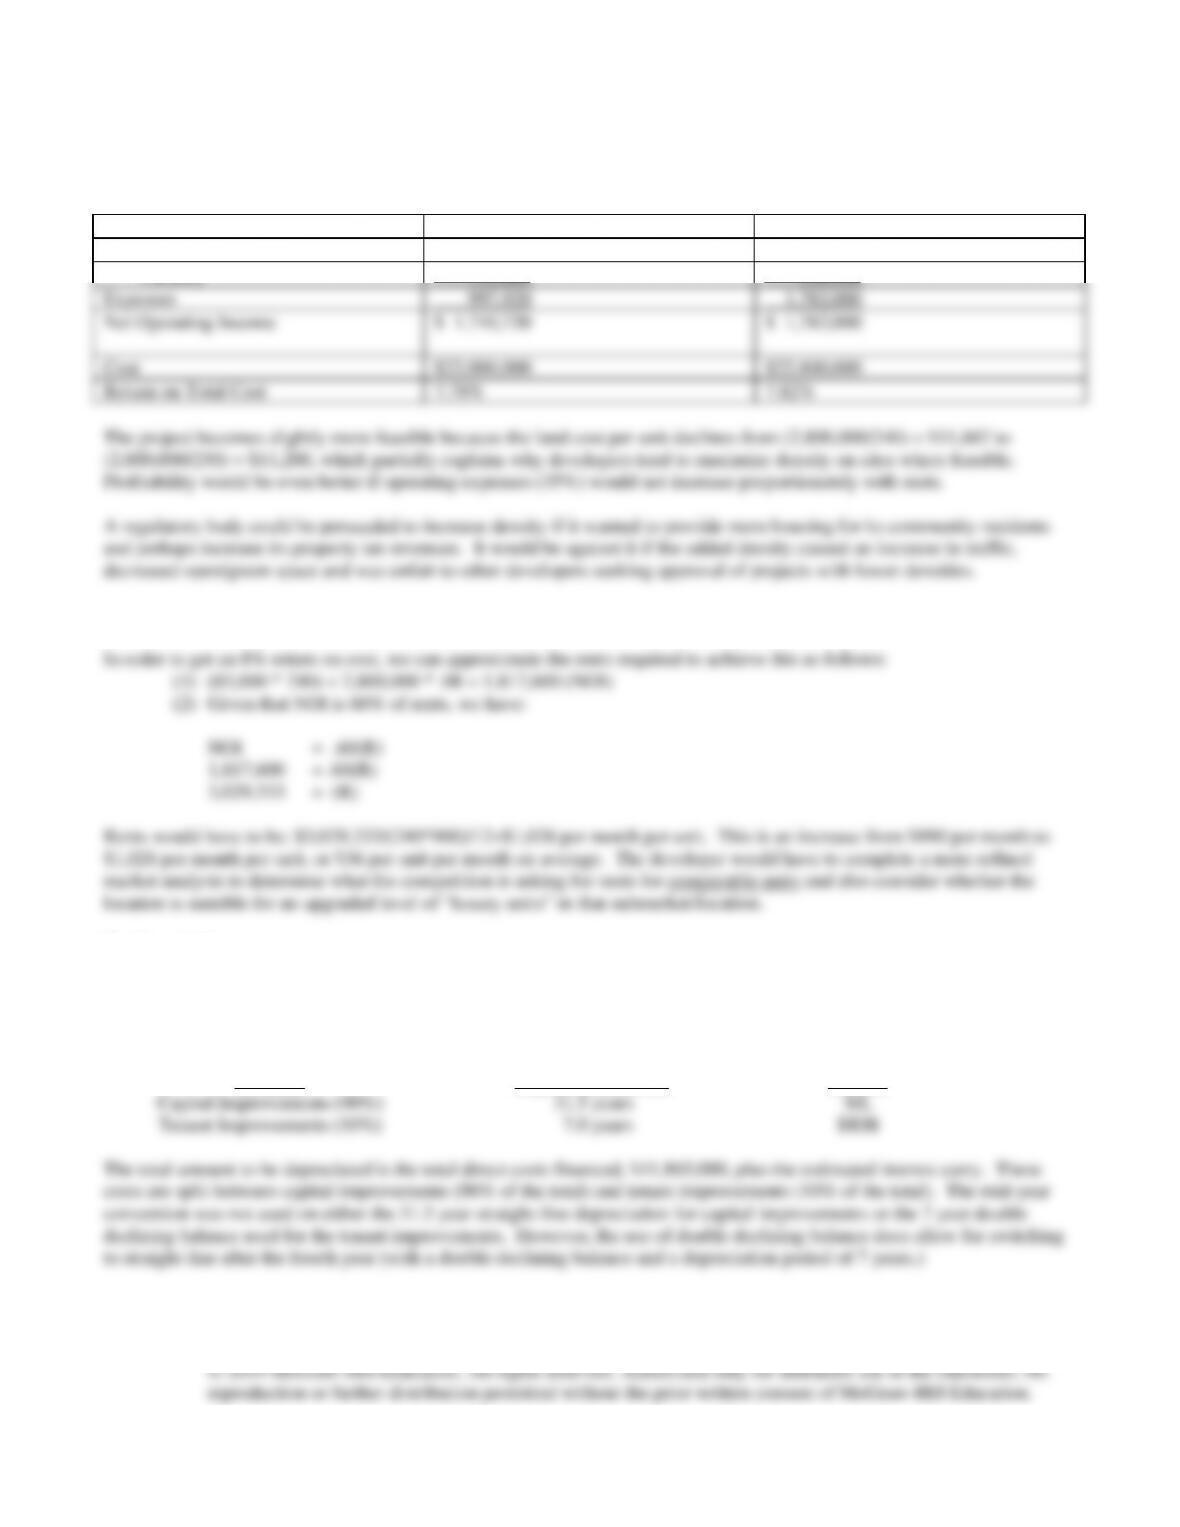
(a)
240 Unit Proposal
250 Unit Revised Proposal
Gross Revenue
$ 2,851,200
$ 2,970,000
Vacancy
142,000
148,500
Expenses
997,920
1,782,000
Net Operating Income
$ 1,710,720
$ 1,782,000
Cost
$22,000,000
$22,800,000
Return on Total Cost
7.78%
7.82%
(b) Assume a 240 percent luxury project at 83,000 per unit.
Problem 16-2
Parker Road Plaza
The following conventions were used:
Depreciation Schedule:
Category
Depreciation Period
Method
Capital Improvements (90%)
31.5 years
S/L
Tenant Improvements (10%)
7.0 years
DDB
The total amount to be depreciated is the total direct costs financed, $11,865,000, plus the estimated interest carry. These
costs are split between capital improvements (90% of the total) and tenant improvements (10% of the total). The mid-year
convention was not used on either the 31.5 year straight-line depreciation for capital improvements or the 7 year double
declining balance used for the tenant improvements. However, the use of double declining balance does allow for switching
to straight-line after the fourth year (with a double declining balance and a depreciation period of 7 years.)
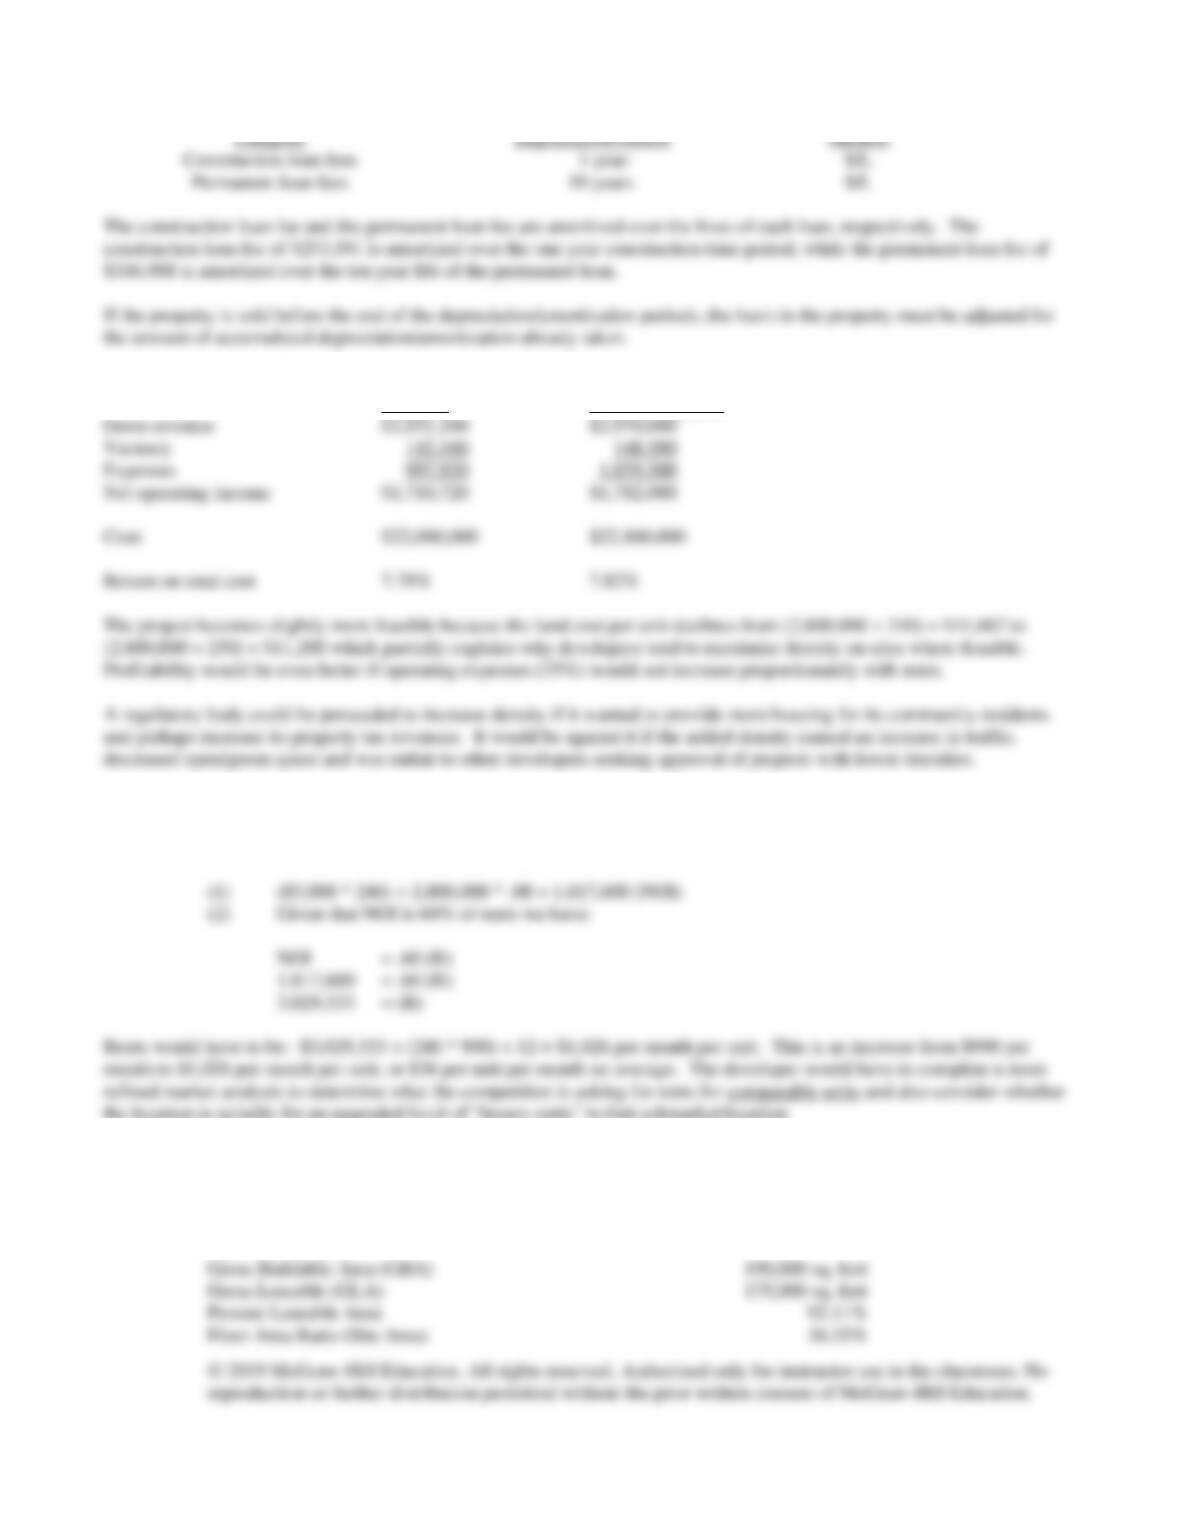
Amortization Schedule:
Category
Depreciation Period
Method
Construction loan fees
1 year-
S/L
Permanent loan fees
10 years
S/L
The construction loan fee and the permanent loan fee are amortized over the lives of each loan, respectively. The
construction loan fee of $253,591 is amortized over the one year construction time period, while the permanent loan fee of
$316,988 is amortized over the ten year life of the permanent loan.
If the property is sold before the end of the depreciation/amortization periods, the basis in the property must be adjusted for
the amount of accumulated depreciation/amortization already taken.
(a) 240 Unit 250 Unit
Proposal Revised Proposal
(b) Assume a 240 percent luxury project at 83,000 per unit.
In order to get an 8% return on cost, we can approximate the rents required to achieve this as follows:
the location is suitable for an upgraded level of “luxury units” in that submarket/location.
PART I (a)
General Project Description
A. Site and Proposed Improvements
Site Area (in acres) 12
C. Loan Information
Construction Loan:
Summary of Cost Information for Parker Road Plaza
A. Land and Site Improvement Costs % of Total Costs Cost/(GBA) ft.
Site Acquisition and Closing Costs $2,250,000 14.5% $11.84
PART I (b)
Summary of Construction Loan Terms
Site Improvements $750,000
Total Hard Construction Costs $10,260,000
Interest Carry for Parker Road Plaza
Construction Loan Repayment Schedule and Yield Calculation for Construction Lender
(a)
(b)
(c)
(d)
(e)
(f)
(g)
Monthly
Draws Direct
Costs
Interest
Total Monthly
Draws
(a) + (b)
Payments
Principal
Interest (g) x
(13%/12)
Total Payments
(d) + (e)
Ending Bal. (g)
Prev Bal + (c) – (d)
0
$0
$0
$0
$0
1
1,865,500
0
1,186,500
$0
$0
1,186,500
2
1,865,500
12,854
1,199,354
12,854
12,854
2,385,854
3
1,865,500
25,847
1,212,347
25,847
25,847
3,598,200
4
1,865,500
38,981
1,225,481
38,981
38,981
4,823,681
5
1,865,500
52,257
1,238,757
52,257
52,257
6,062,438
6
1,865,500
65,676
1,252,176
65,676
65,676
7,314,614
7
791,000
79,242,
870,242
79,242
79,242
8,184,856
8
791,000
88,669
879,669
88,669
88,669
9,064,525
9
791,000
98,199
889,199
98,199
98,199
9,953,724
10
791,000
107,832
898,832
107,832
107,832
10,852,556
11
791,000
117,569
908,569
117,569
117,569
11,761,125
12
791,000
127,412
918,412
$12,679,537
127,412
12,806,950
0
Total
$11,865,000
$814,537
$12,679,537
$12,679,537
814,537
$13,494,075
$0
Yield to Lender: The yield to the lender is calculated as the interest rate needed to equate the present value of the
construction loan fee to the present value of the cash flow stream of the lender which is calculated from the Construction
Loan Repayment Schedule as column (d) minus column (a).
Month
Cash Flows
0
253,591
1
(1,186,500)
2
(1,186,500)
3
(1,186,500)
4
(1,186,500)
5
(1,186,500)
6
(1,186,500)
7
(791,000)
8
(791,000)
9
(791,000)
10
(791,000)
11
(791,000)
12
11,888,537
PART I (c)
Summary of Permanent Loan Terms
Total Loan $12,679,537
Pro Forma Statement of Cash Flows – Construction Period
Draws Per Year (0)
Draws Per Year (1)
Total
Cost Breakdown
$2,250,00
Site Acquisition & Closing Costs
$750,000
$2,250,000
Site Improvements
10,260,000
750,000
Hard Costs
855,000
10,260,000
Soft Costs
855,000
Permanent Loan Fee
316,988
316,988
Construction Loan Fee
253,591
253,591
Construction Interest
814,537
814,537
Total
$2,820,579
$12,679,537
$15,500,117
Total Construction Cash Outflow
$2,820,579
12,679,537
$15,500,117
Less: Total Draws
0
12,679,537
12,679,537
Total Equity Needed
$2,820,579
$0
$2,820,579
PART II (d)
Pro Forma Operating Statement – Parker Road Plaza
CASHFLOWS (EOP)
2
3
4
5
6
INCOME: Rent Increase @
5.00%
Minimum Rent
$18.50
$3,237,500
$3,339,375
$3,569,344
$3,747,811
$3,935,201
Average (% of gross sales)
3.00%
52,500
118,650
118,769
263,095
341,881
Tenant Reimbursement (per GLA)
$8.00
1,400,000
1,470,000
1,543,500
1,620,675
,701,709
GROSS POTENTIAL INCOME
$4,690,000
$4,998,025
$5,301,613
$5,631,581
$5,978,791
Vacancy Allowance
1,407,000
249,401
265,081
281,579
98,940
EXPECTED GROSS INCOME
$3,283,000
$4,738,624
$5,036,532
$5,350,002
$5,679,852
EXPENSES
Operating Expenses (per GLA)
$14.00
$2,450,000
2,572,500
2,701,125
2,836,181
,997,990
Management Fee (% of EGI)
5.00%
164,150
236,931
251,827
267,500
83,993
Total Expenses
$2,614,150
$2,809,431
$2,952,952
$3,103,681
$3,261,983
NET OPERATING INCOME
$668,850
1,929,193
2,083,581
2,246,321
,417,869
Less: Debt Service
1,675,352
1,675,352
1,675,352
1,675,352
,675,352
BEFORE TAX CASH FLOW
$(1,006,502)
$253,841
$408,229
$570,969
$742,517
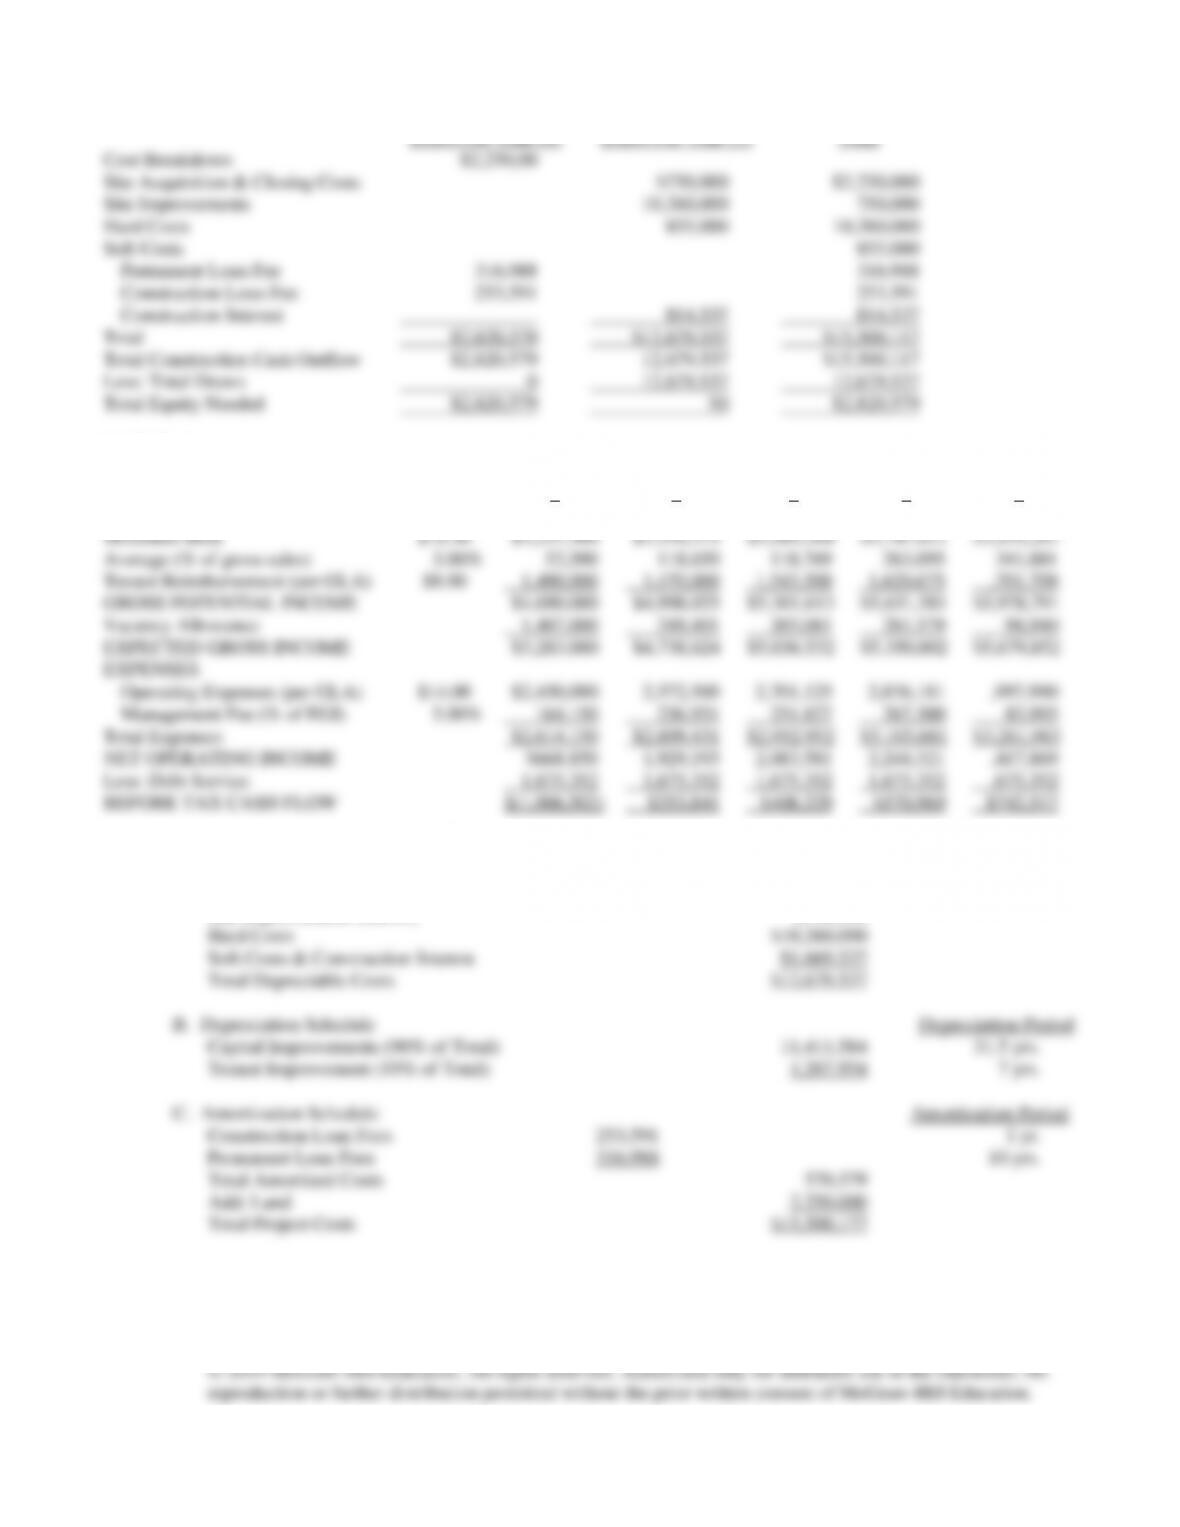
Depreciation and Amortization Schedule – Parker Road Plaza
A. Depreciable Costs
Site Improvements (on/off) $750,000
Adjusted Basis at the End of Year 6
Item
Total Cost
Less: Accum Deprec/Amort.
Adjusted Basis
Land
$2,250,000
$0
$2,250,000
Capital Improvements
11,411,584
1,811,362
9,600,221
Tenant Improvements
1,267,954
1,047,915
220,039
Permanent Loan Fees
316,988
158,494
158,494
Construction Loan Fees
253,591
253,591
0
Total
$15,500,117
$3,271,362
$12,228,755
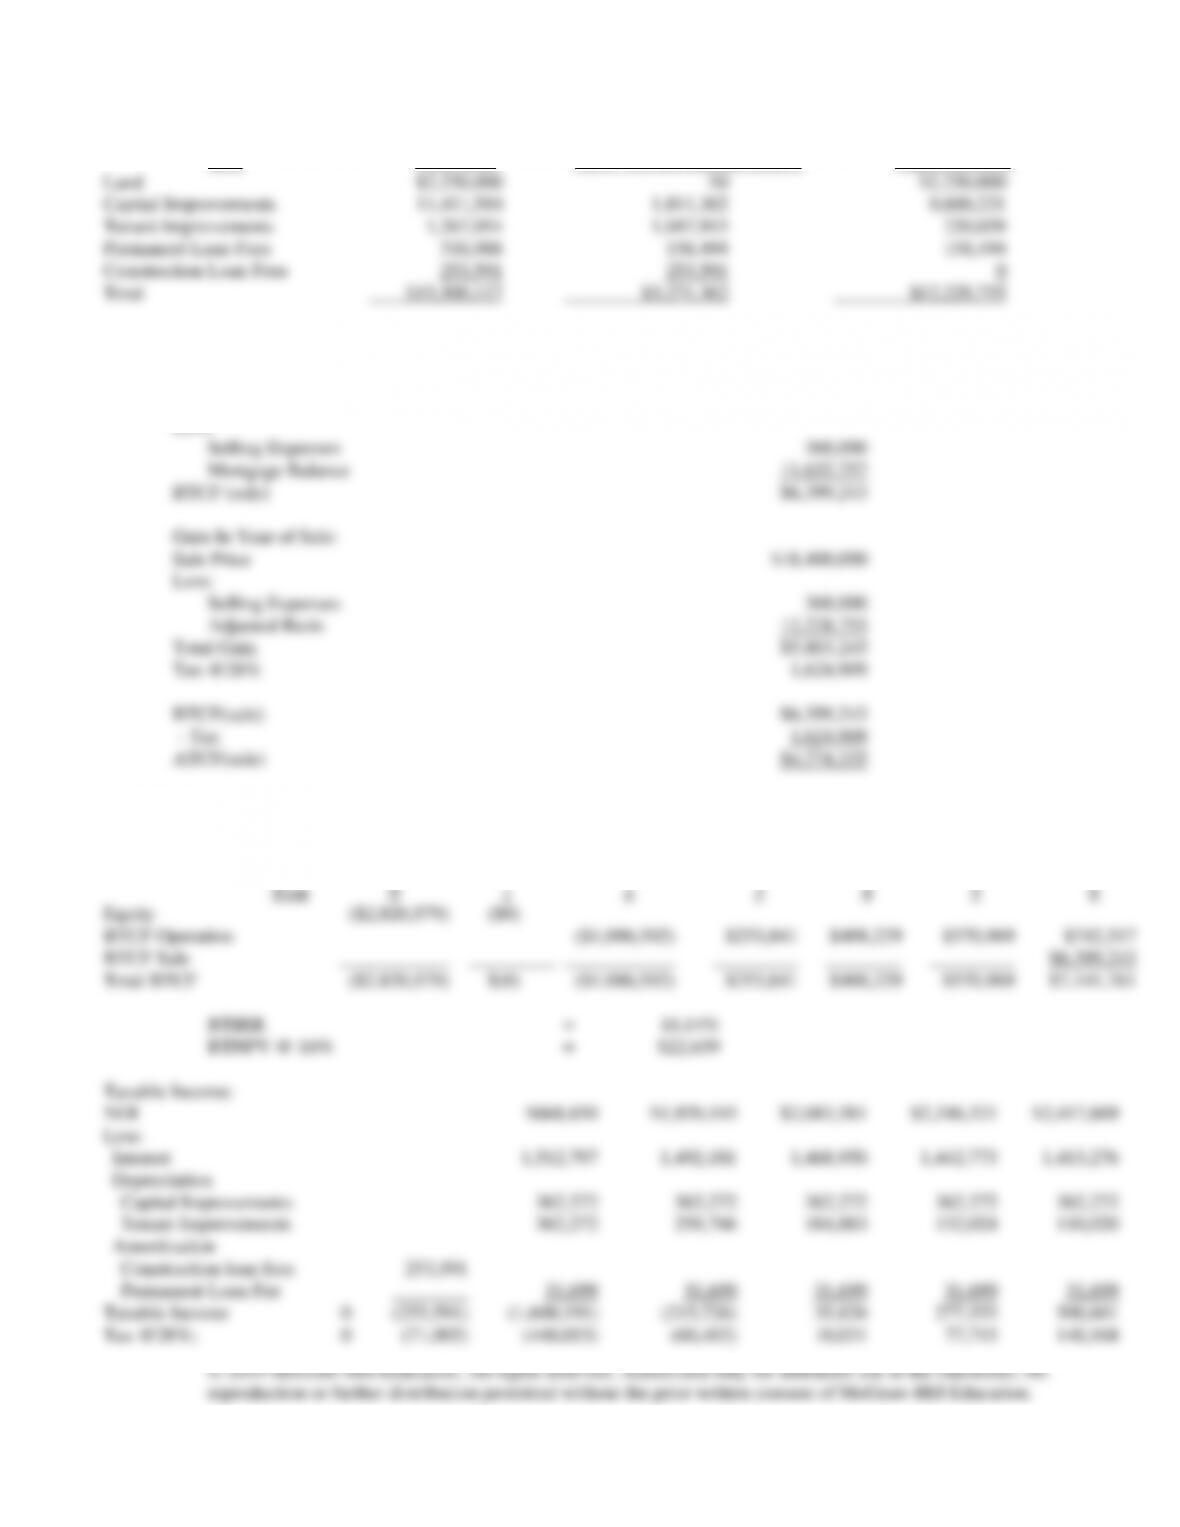
Sale of Parker Road Plaza
Sale Price $18,400,000
Less:
PART II (d) and (e)
Profitability Analysis – Parker Road Plaza
Before Tax Cash Flows:
Year
0
1
2
3
4
5
6
Equity
($2,820,579)
($0)
BTCF Operation
($1,006,502)
$253,841
$408,229
$570,969
$742,517
BTCF Sale
$6,399,243
Total BTCF
($2,820,579)
$(0)
($1,006,502)
$253,841
$408,229
$570,969
$7,141,761
BTIRR = 16.14%
BTNPV @ 16% = $22,639
Taxable Income:
NOI
$668,850
$1,929,193
$2,083,581
$2,246,321
$2,417,869
Less:
Interest
1,512,797
1,492,181
1,468,950
1,442,773
1,413,276
Depreciation
Capital Improvements
362,272
362,272
362,272
362,272
362,272
Tenant Improvements
362,272
258,766
184,883
132,024
110,020
Amortization
Construction loan fees
253,591
Permanent Loan Fee
31,699
31,699
31,699
31,699
31,699
Taxable Income
0
(253,591)
(1,600,191)
(215,726)
35,826
277,553
500,601
Tax @28%;
0
(71,005)
(448,053)
(60,403)
10,031
77,715
140,168

© 2019 McGraw-Hill Education. All rights reserved. Authorized only for instructor use in the classroom. No
After Tax Cash Flows:
Total BTCF
($2,820,579)
($0)
($1,006,502)
$253,841
$408,229
$570,969
$7,141,761
Less: Taxes*
0
(71,005)
(448,053)
(60,403)
10,031
77,715
1,765,077
ATCF
($2,820,579)
$71,005
($558,448)
$314,244
$398,198
$493,254
$5,376,683
Problem 16-3
Timbercreek Office Building
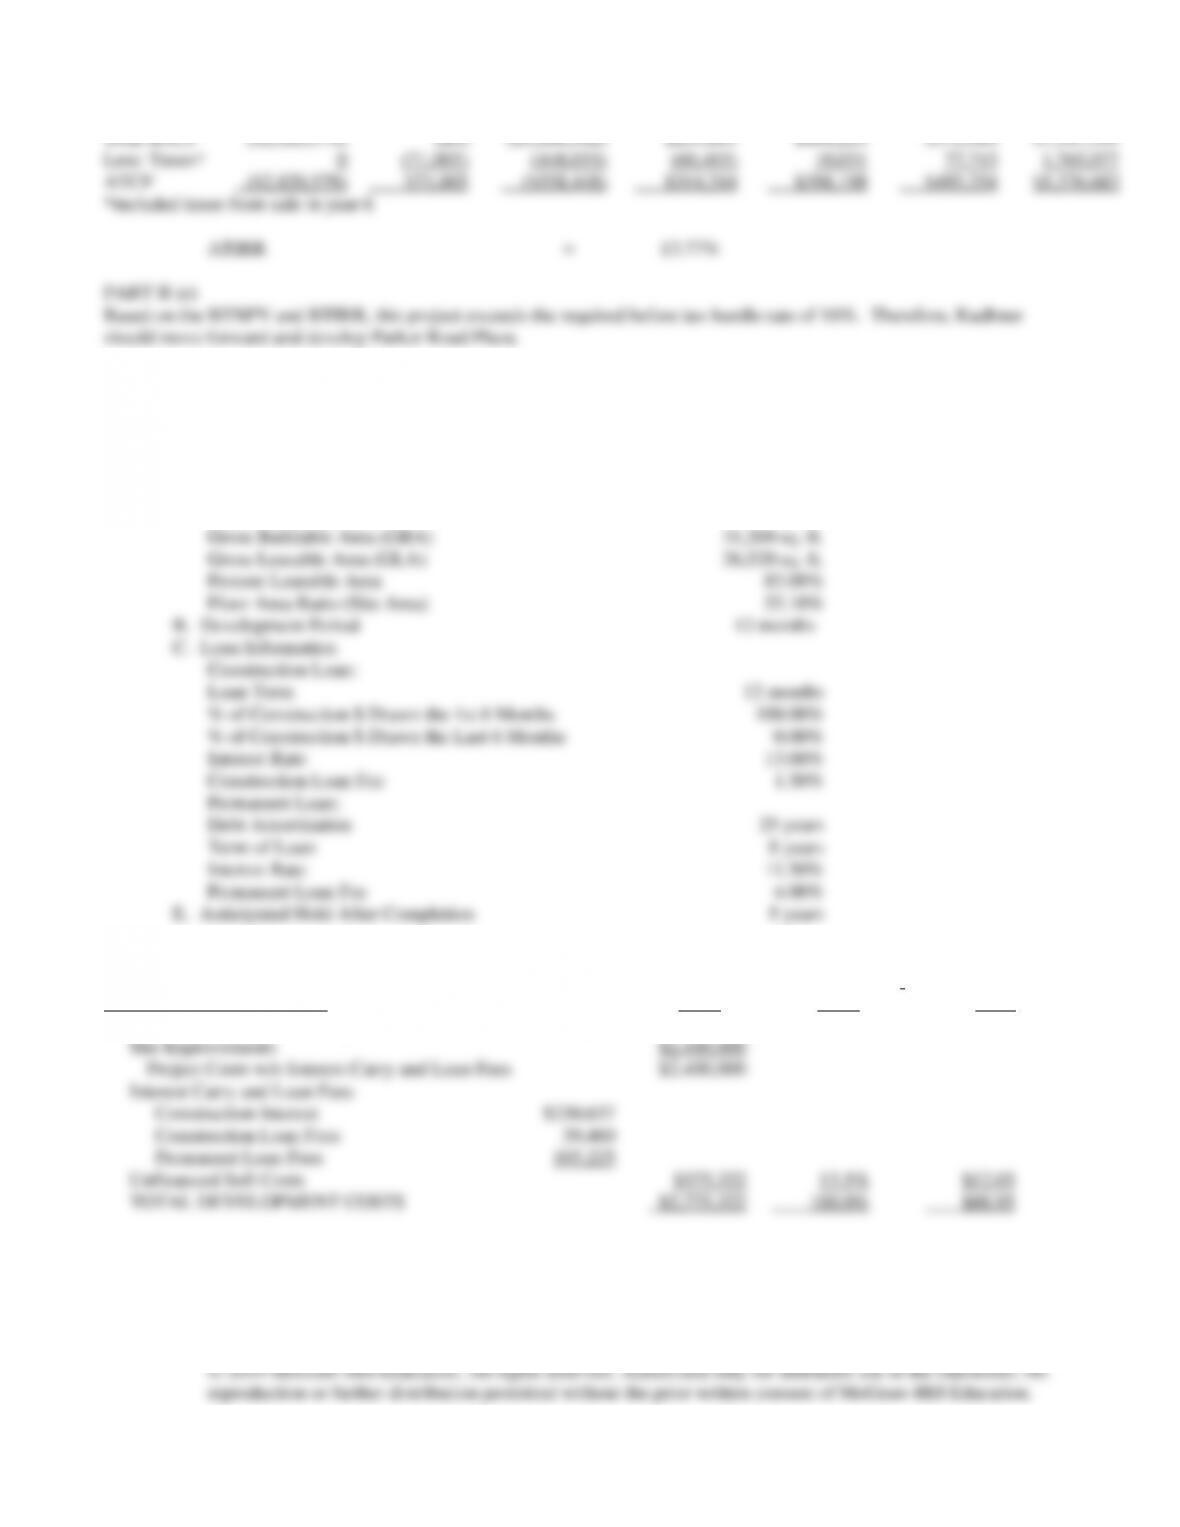
(a)
General Project Description
A. Site and Proposed Improvements
Site Area (in Acres)
1.3
Gross Buildable Area (GBA)
31,200 sq. ft.
Gross Leasable Area (GLA)
26,520 sq. ft.
Percent Leasable Area
85.00%
Floor Area Ratio (Site Area)
55.10%
B. Development Period
12 months
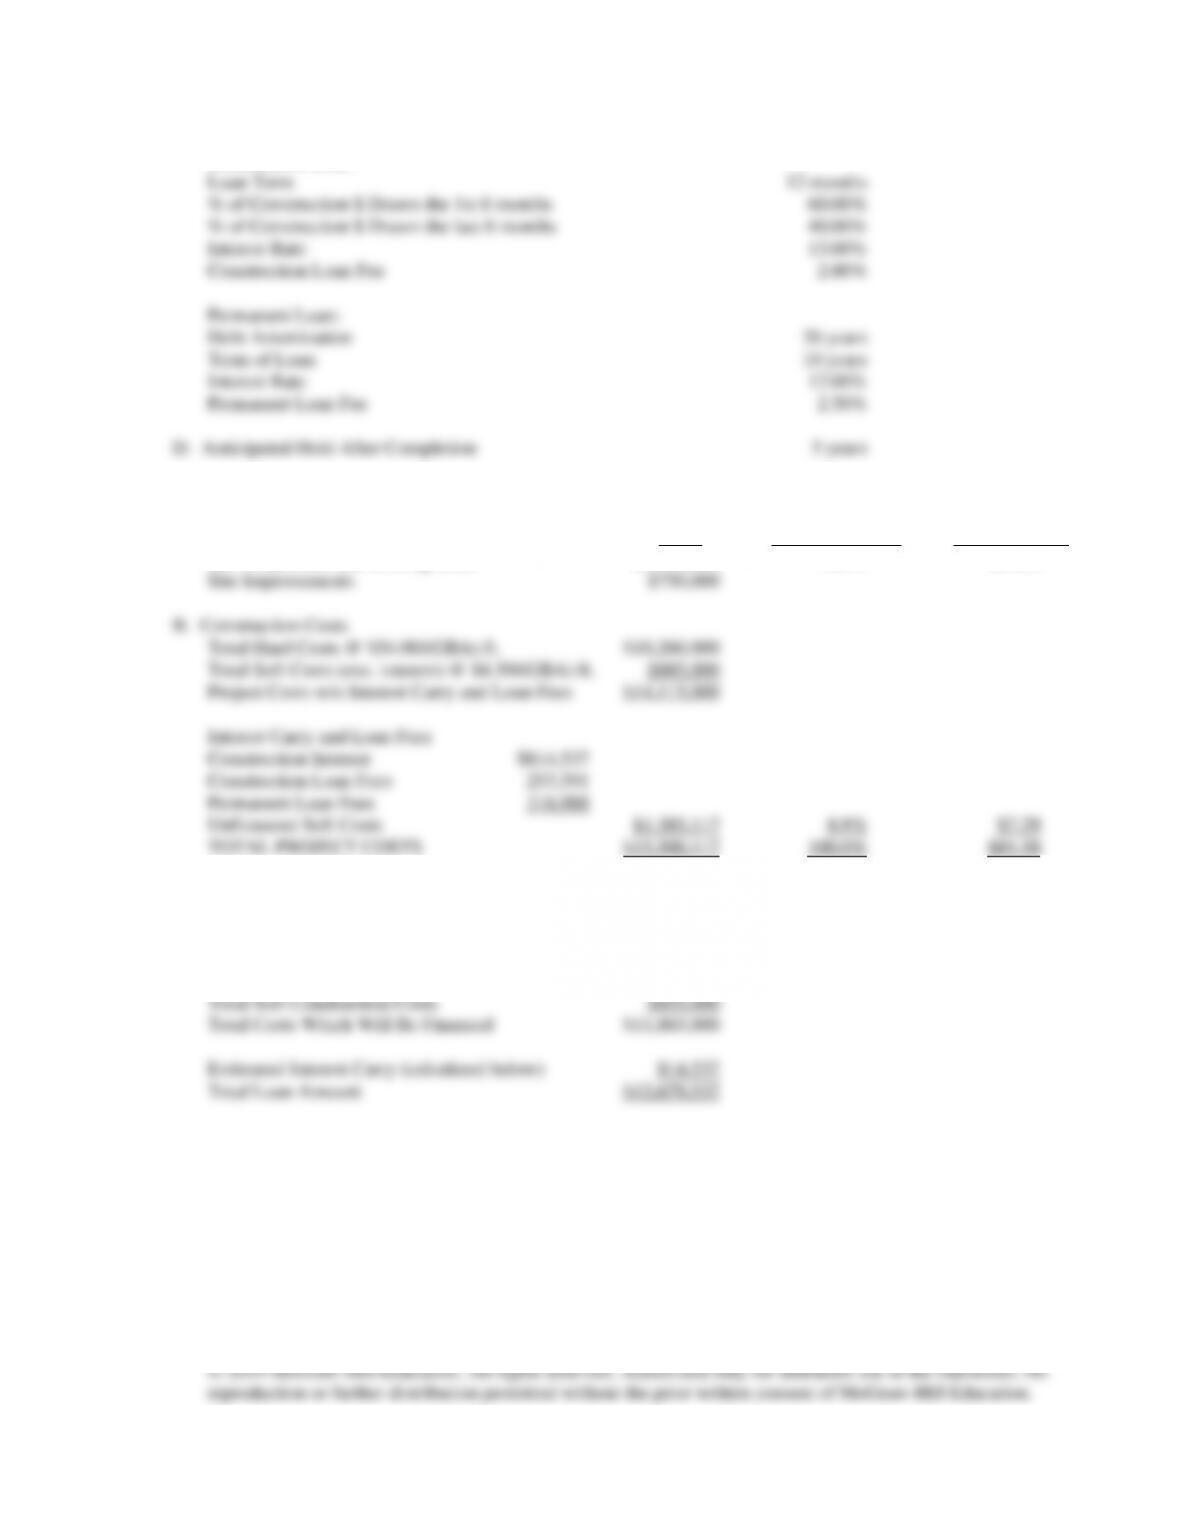
C. Loan Information
Construction Loan:
Loan Term
12 months
% of Construction $ Drawn the 1st 6 Months
100.00%
% of Construction $ Drawn the Last 6 Months
0.00%
Interest Rate
13.00%
Construction Loan Fee
1.50%
Permanent Loan:
Debt Amortization
25 years
Term of Loan
8 years
Interest Rate
11.50%
Permanent Loan Fee
4.00%
E. Anticipated Hold After Completion
5 years
Summary of Cost Information for Proposed Office Building
Land and Site Improvements
Costs
Percent of Total
Costs
Cost per Sq. Ft.
GBA
Site Acquisition and Closing Costs
TBD
0.0%
$0.00
Site Improvements
$2,400,000
Project Costs w/o Interest Carry and Loan Fees
$2,400,000
Interest Carry and Loan Fees
Construction Interest
$230,637
Construction Loan Fees
39,460
Permanent Loan Fees
105,225
Unfinanced Soft Costs
$375,322
13.5%
$12.03
TOTAL DEVELOPMENT COSTS
$2,775,322
100.0%
$88.95
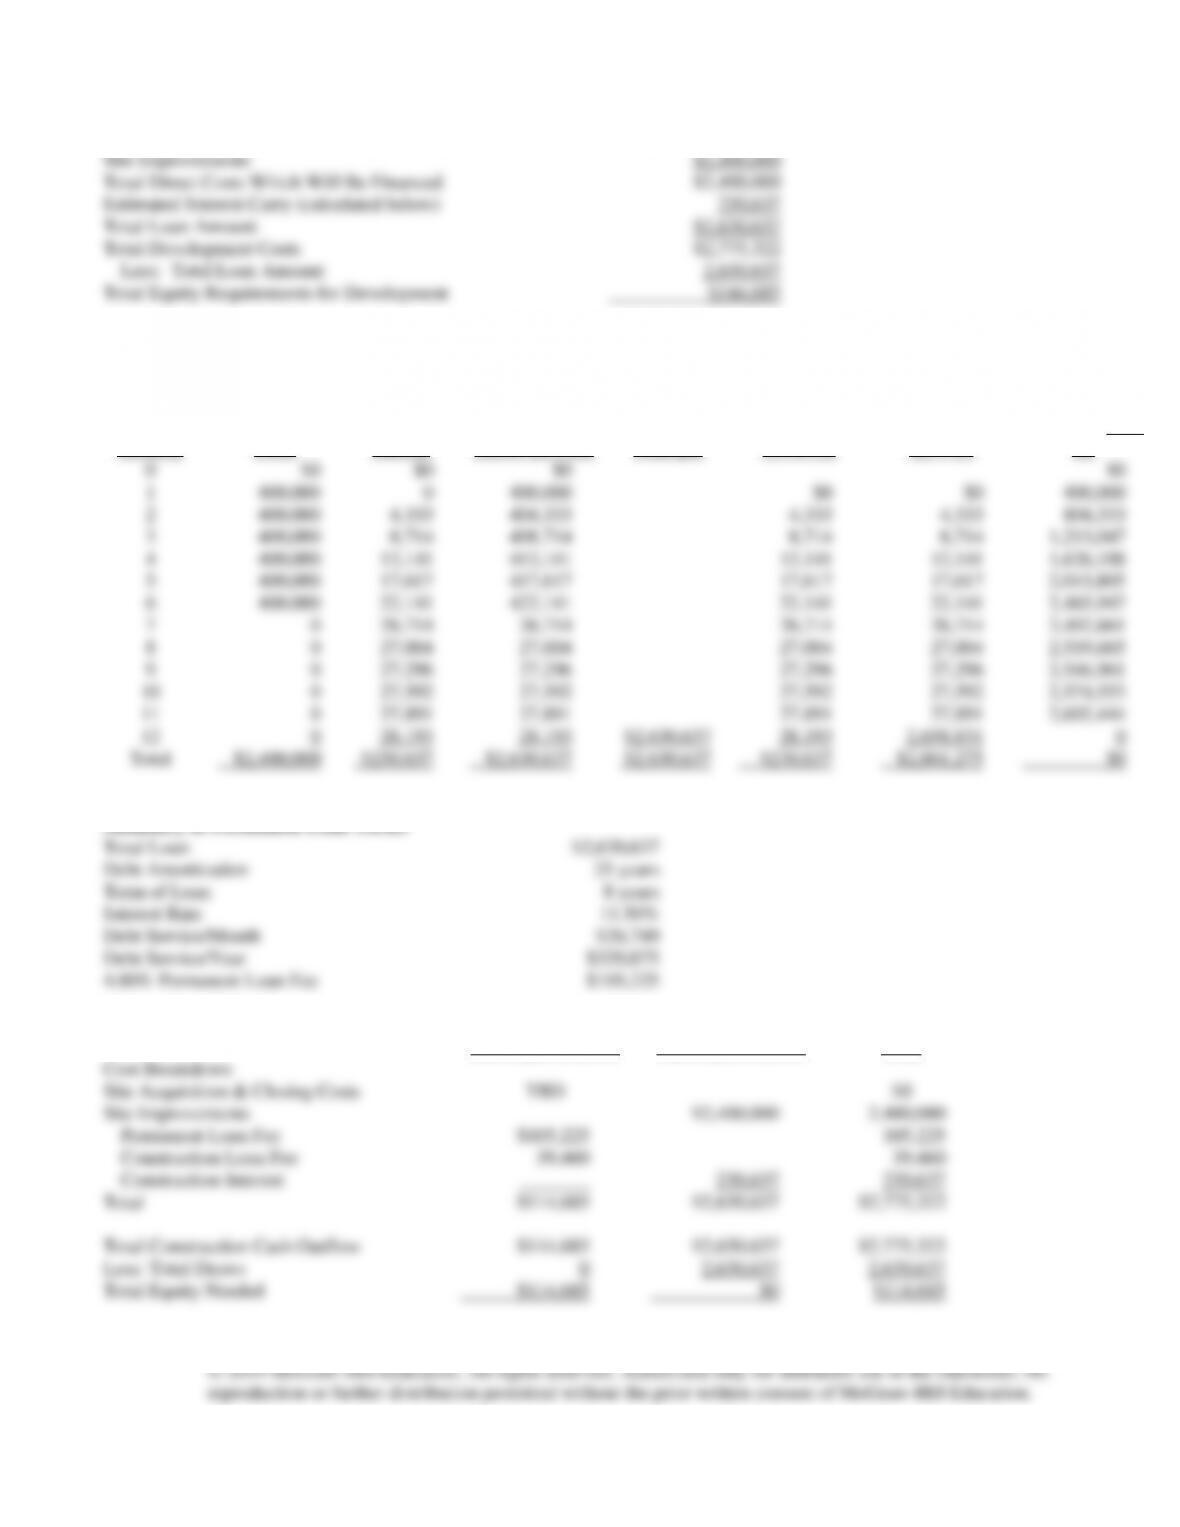
Estimation of Loan Costs and Equity Requirements for the Development
Site Improvements
$2,400,000
Total Direct Costs Which Will Be Financed
$2,400,000
Estimated Interest Carry (calculated below)
230,637
Total Loan Amount
$2,630,637
Total Development Costs
$2,775,322
Less: Total Loan Amount
2,630,637
Total Equity Requirements for Development
$144,685
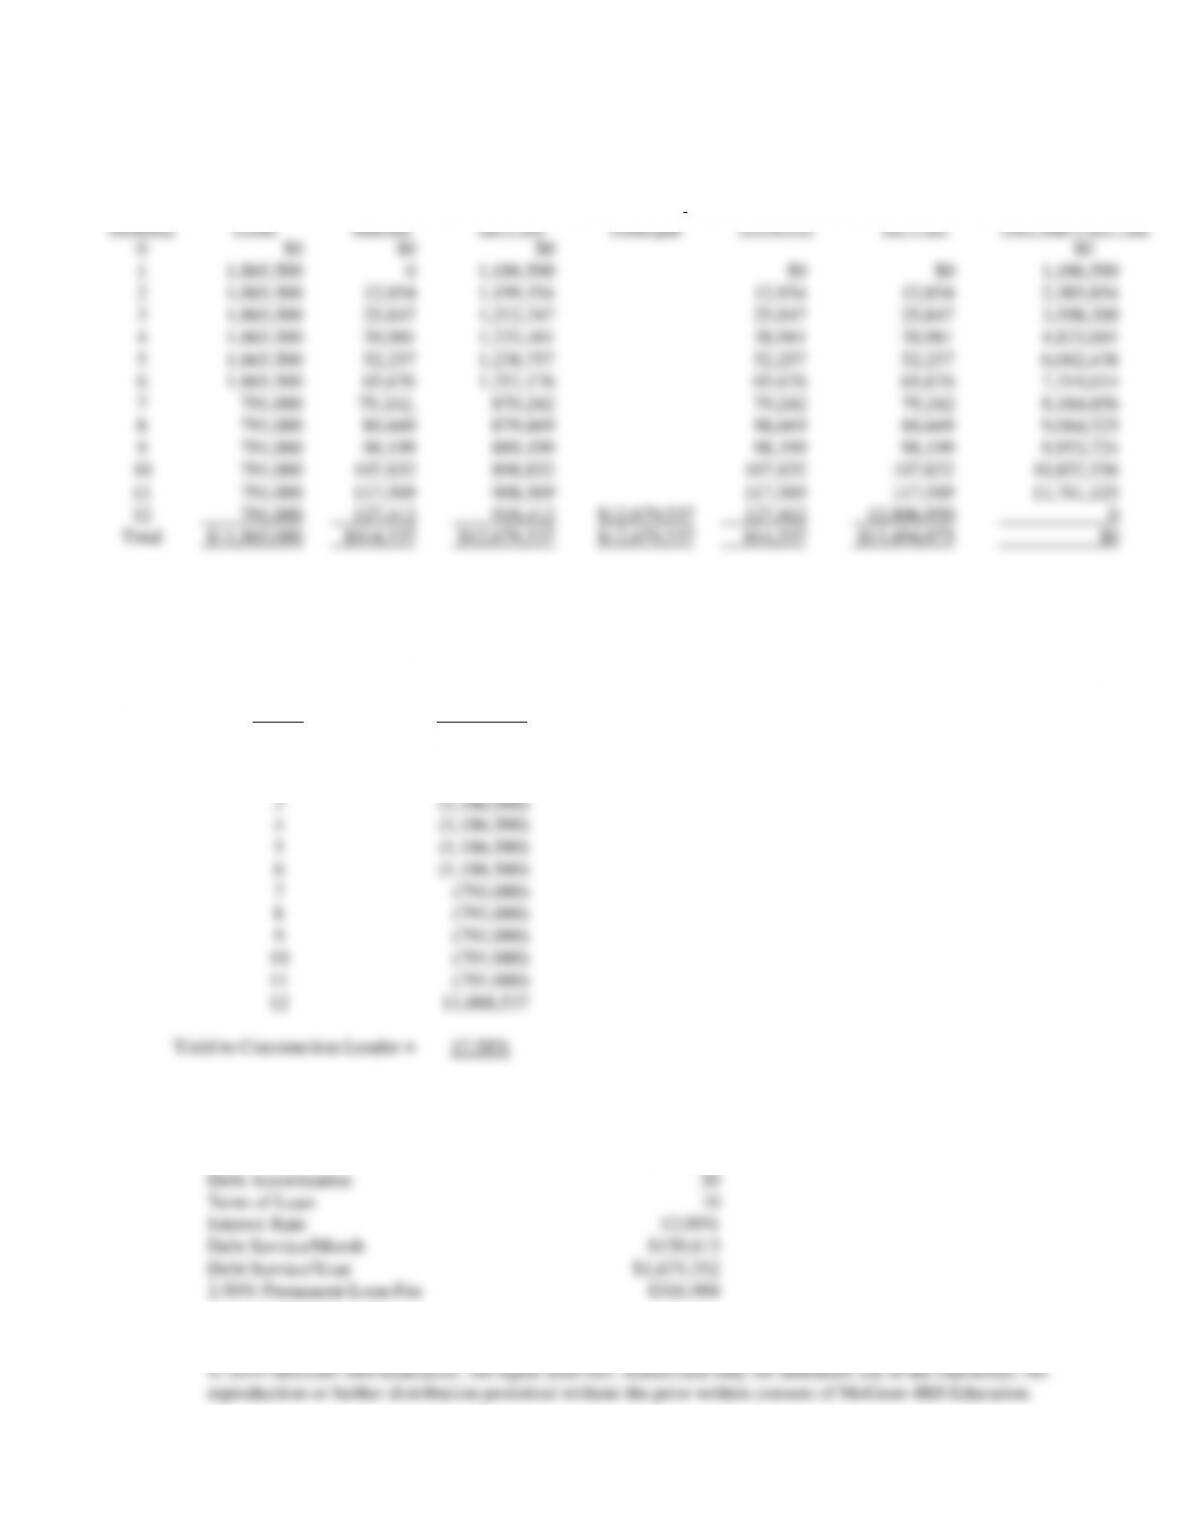
Estimated Interest Carry for Proposed Office Building
Construction Loan Repayment Schedule
(a)
(b)
(c)
(d)
(e)
(f)
(g)
Monthly
Draws Direct
Costs
Interest
Total Monthly
Draws (a) + (b)
Payments
Principal
Interest (g) x
(13%/12)
Total Payments
(d) + (e)
Ending Bal. (g)
Prev Bal + (c) –
(d)
0
$0
$0
$0
$0
1
400,000
0
400,000
$0
$0
400,000
2
400,000
4,333
404,333
4,333
4,333
804,333
3
400,000
8,714
408,714
8,714
8,714
1,213,047
4
400,000
13,141
413,141
13,141
13,141
1,626,188
5
400,000
17,617
417,617
17,617
17,617
2,043,805
6
400,000
22,141
422,141
22,141
22,141
2,465,947
7
0
26,714
26,714
26,714
26,714
2,492,661
8
0
27,004
27,004
27,004
27,004
2,519,665
9
0
27,296
27,296
27,296
27,296
2,546,961
10
0
27,592
27,592
27,592
27,592
2,574,553
11
0
27,891
27,891
27,891
27,891
2,602,444
12
0
28,193
28,193
$2,630,637
28,193
2,658,831
0
Total
$2,400,000
$230,637
$2,630,637
$2,630,637
$230,637
$2,861,275
$0
(b)
Summary of Permanent Loan Terms
Total Loan
$2,630,637
Debt Amortization
25 years
Term of Loan
8 years
Interest Rate
11.50%
Debt Service/Month
$26,740
Debt Service/Year
$320,875
4.00% Permanent Loan Fee
$105,225
Pro Forma Statement of Cash Flows – Construction Period
Draws per Year (0)
Draws per Year (1)
Total
Cost Breakdown
Site Acquisition & Closing Costs
TBD
$0
Site Improvements
$2,400,000
2,400,000
Permanent Loan Fee
$105,225
105,225
Construction Loan Fee
39,460
39,460
Construction Interest
230,637
230,637
Total
$114,685
$2,630,637
$2,775,322
Total Construction Cash Outflow
$114,685
$2,630,637
$2,775,322
Less: Total Draws
0
2,630,637
2,630,637
Total Equity Needed
$114,685
$0
$114,685
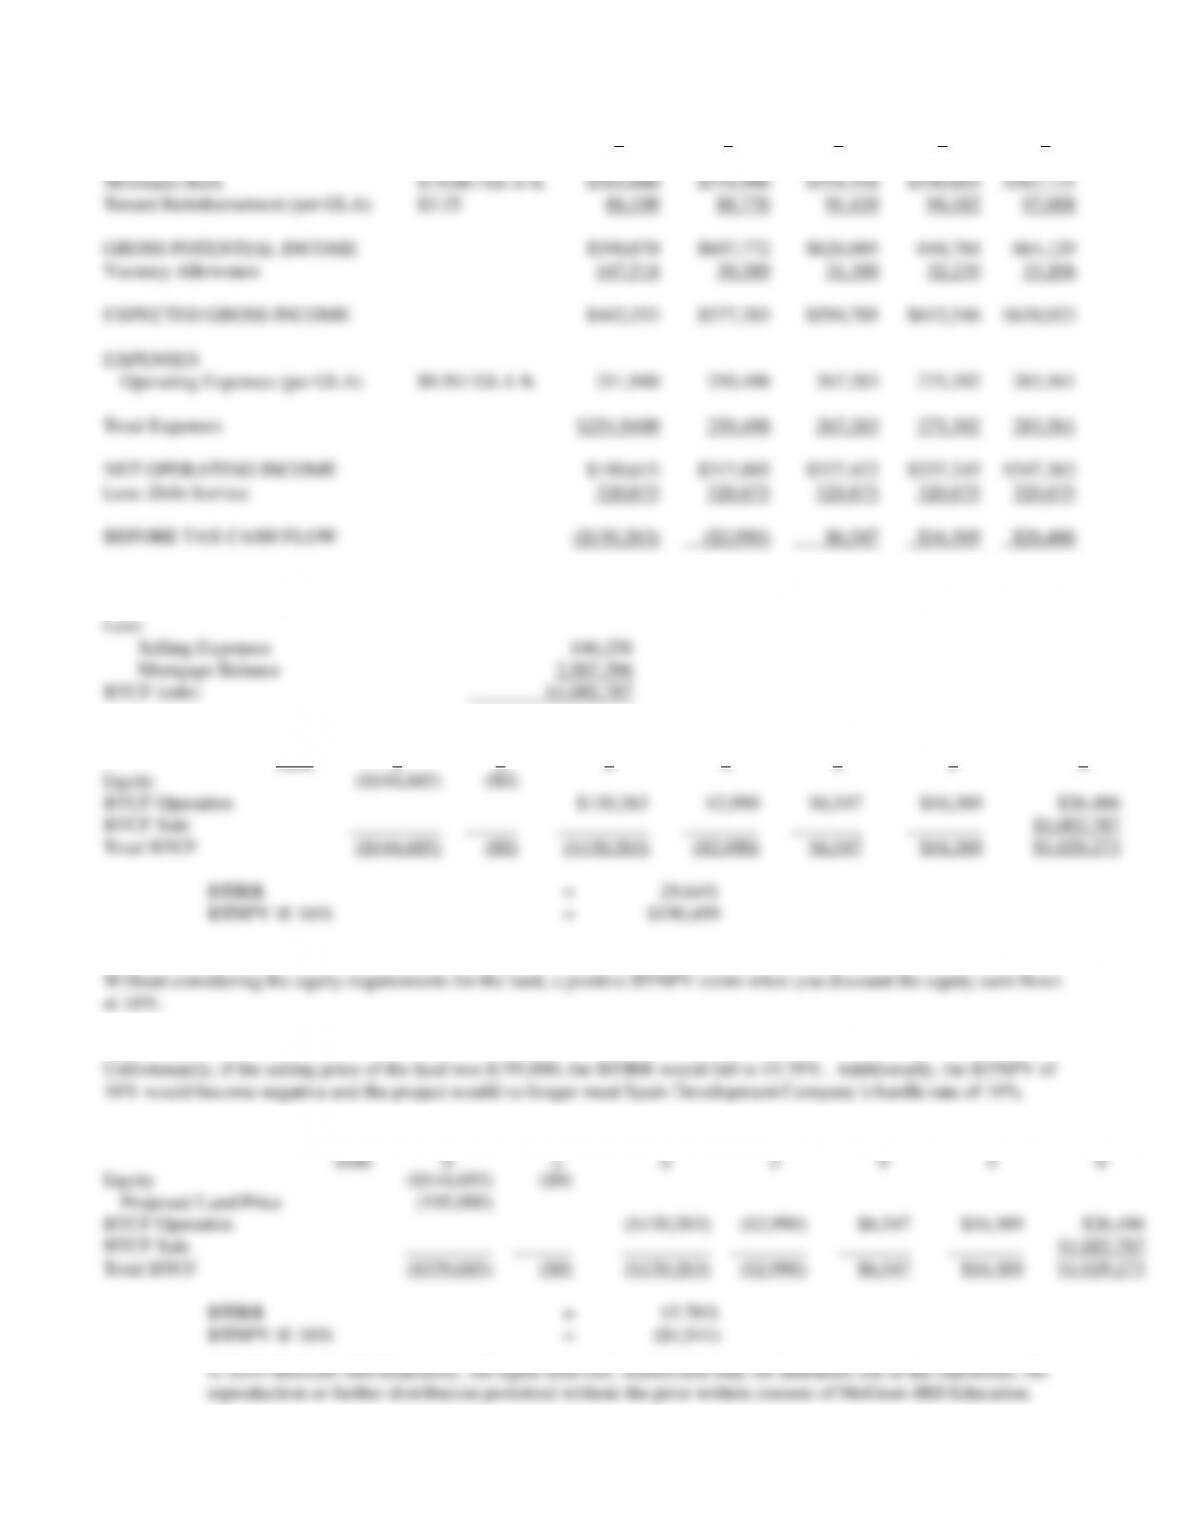
Pro Forma Operating Statement – Parker Road Plaza
CASHFLOWS (EOP)
2
3
4
5
6
INCOME: Rent Increase @
3.00% yr.
Minimum Rent
$19.00 / GLA ft.
$503,880
$518,996
$534,556
$550,603
$567,121
Tenant Reimbursement (per GLA)
$3.25
86,190
88,776
91,439
94,182
97,008
GROSS POTENTIAL INCOME
$590,070
$607,772
$626,005
644,784
664,129
Vacancy Allowance
147,518
30,389
31,300
32,239
33,206
EXPECTED GROSS INCOME
$442,553
$577,383
$594,705
$612,546
$630,923
EXPENSES
Operating Expenses (per GLA)
$9.50 / GLA ft.
251,940
259,498
267,283
275,302
283,561
Total Expenses
$251,9400
259,498
267,283
275,302
283,561
NET OPERATING INCOME
$190,613
$317,885
$327,422
$337,245
$347,362
Less: Debt Service
320,875
320,875
320,875
320,875
320,875
BEFORE TAX CASH FLOW
($130,263)
($2,990)
$6,547
$16,369
$26,486
Sale of Proposed Office Building
Sale Price
$3,656,400*
Less:
Selling Expenses
146,258
Mortgage Balance
2,507,396
BTCF (sale)
$1,002,787
Profitability Analysis for Proposed Office Building
Year
0
1
2
3
4
5
6
Equity
($144,685)
($0)
BTCF Operation
$130,263
$2,990
$6,547
$16,369
$26,486
BTCF Sale
$1,002,787
Total BTCF
($144,685)
($0)
($130,263)
($2,990)
$6,547
$16,369
$1,029,273
(c)
(d)
Before Tax Cash Flows
Year
0
1
2
3
4
5
6
Equity
($144,685)
($0)
Proposed Land Price
(195,000)
BTCF Operation
($130,263)
($2,990)
$6,547
$16,369
$26,486
BTCF Sale
$1,002,787
Total BTCF
($339,685)
($0)
($130,263)
($2,990)
$6,547
$16,369
$1,029,273

Problem 16-4