Solutions to Questions – Chapter 13
Risk Analysis
Question 13-1
What is meant by partitioning the internal rate of return? Why is this procedure meaningful?
Question 13-2
What is a risk premium? Why does such a premium exist between interest rates on mortgages and rates of return
earned on equity invested in real estate?
A risk premium is a higher expected rate of return paid to an investor as compensation for incurring additional risk
Question 13-3
What are some of the types of risk that should be considered when analyzing real estate and other categories of
investment?
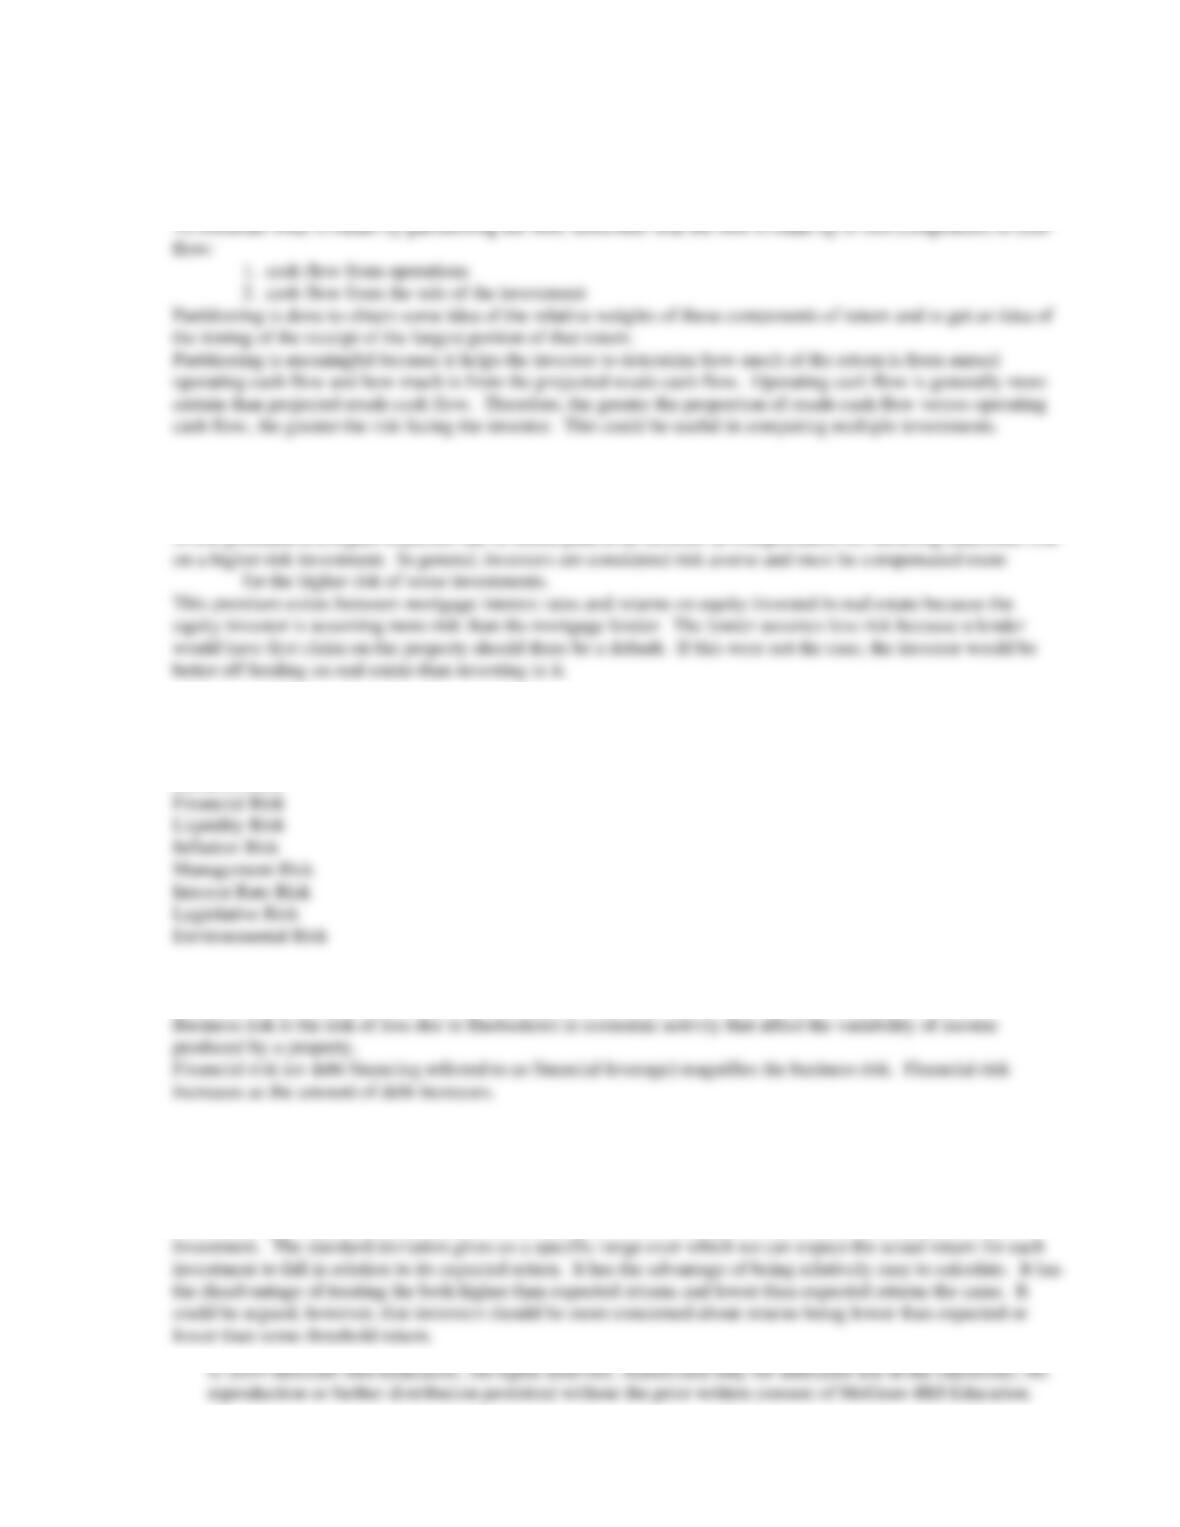
Business Risk
Question 13-4
What is the difference between business risk and financial risk?
Question 13-5
Why is the variance (or standard deviation) used as a measure of risk? What are the advantages and
disadvantages of this risk measure?
Lower variability in returns is considered by many analysts to be associated with lower risk and vice versa.
Therefore, by using a statistical measure of variance, one has an indication of the extent risk is present in an

Question 13-6
What is meant by a ‘ real option’ ?
Question 13-7
What is meant by the term ‘overage’ for retail space ?
Question 13-8
How does the use of scenarios differ from sensitivity analysis ?
Question 13-9
How does the use of Monte Carlo Simulation differ from using scenarios?
Solutions to Problems – Chapter 13
Risk Analysis
INTRODUCTION
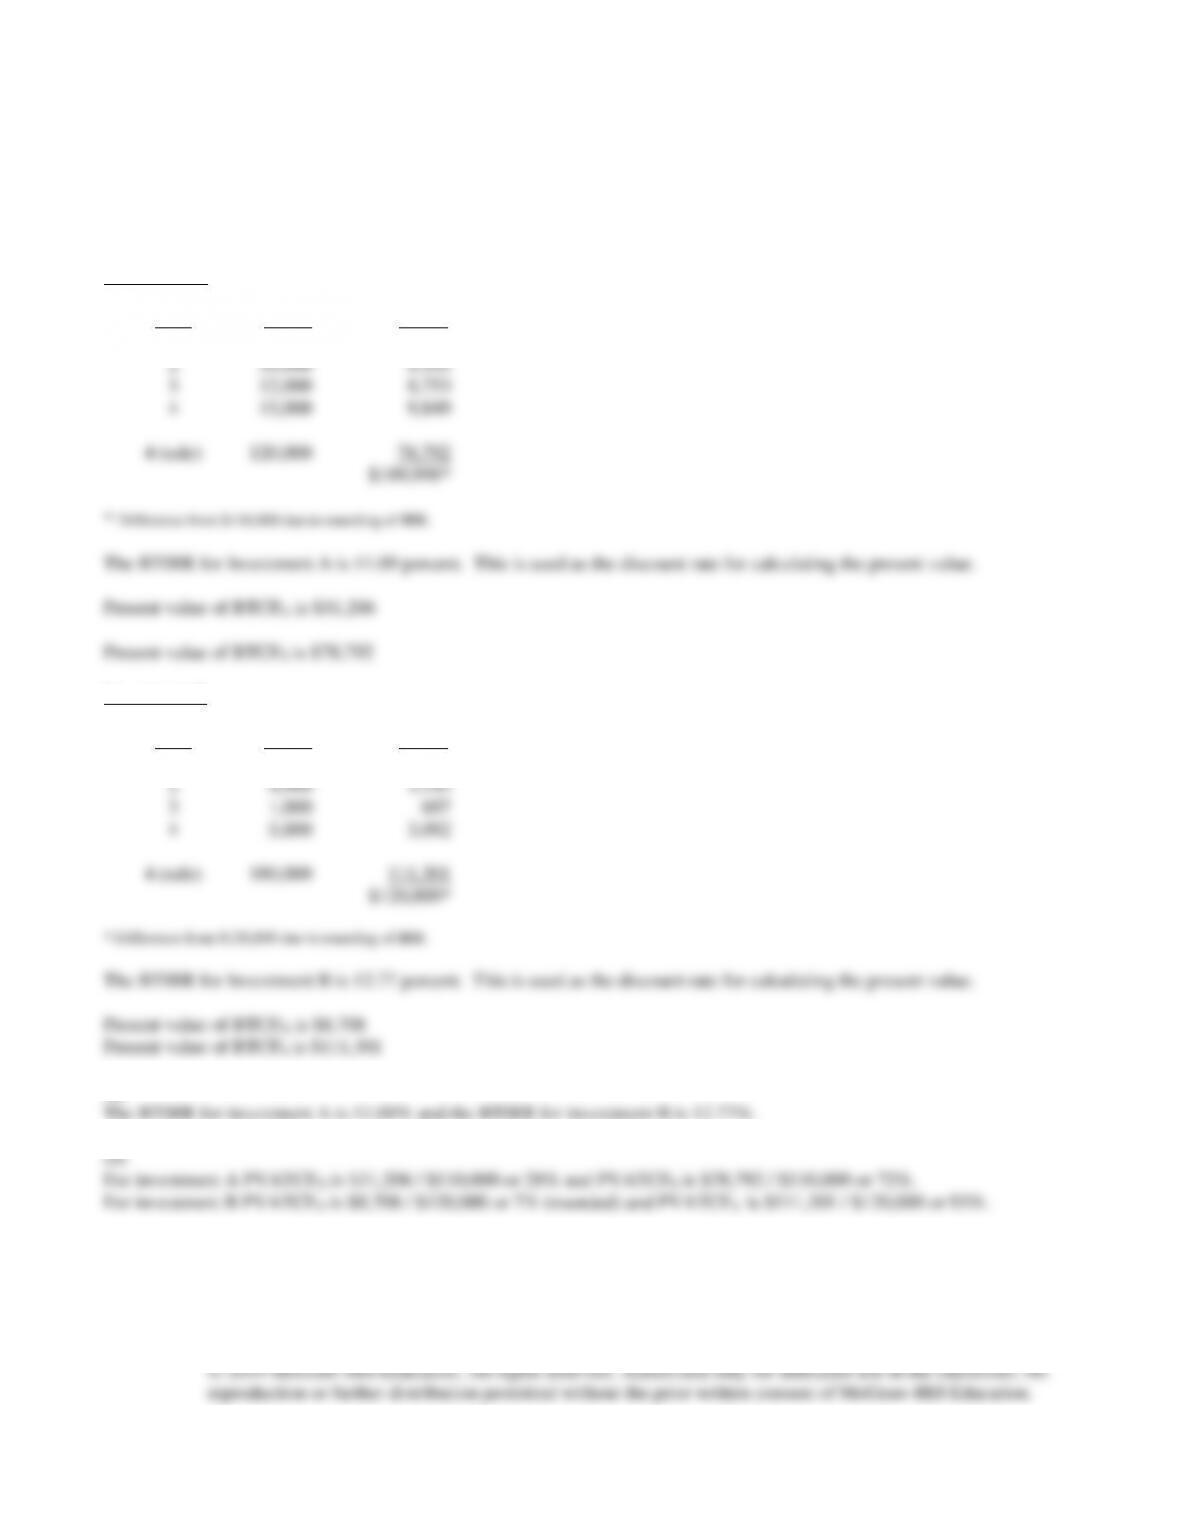
Problem 13-1
Investment A
Year BTCF PV
1 $5,000 $4,501
Investment B
Year BTCF PV
1 $2,000 $1,774
(a)
(c)

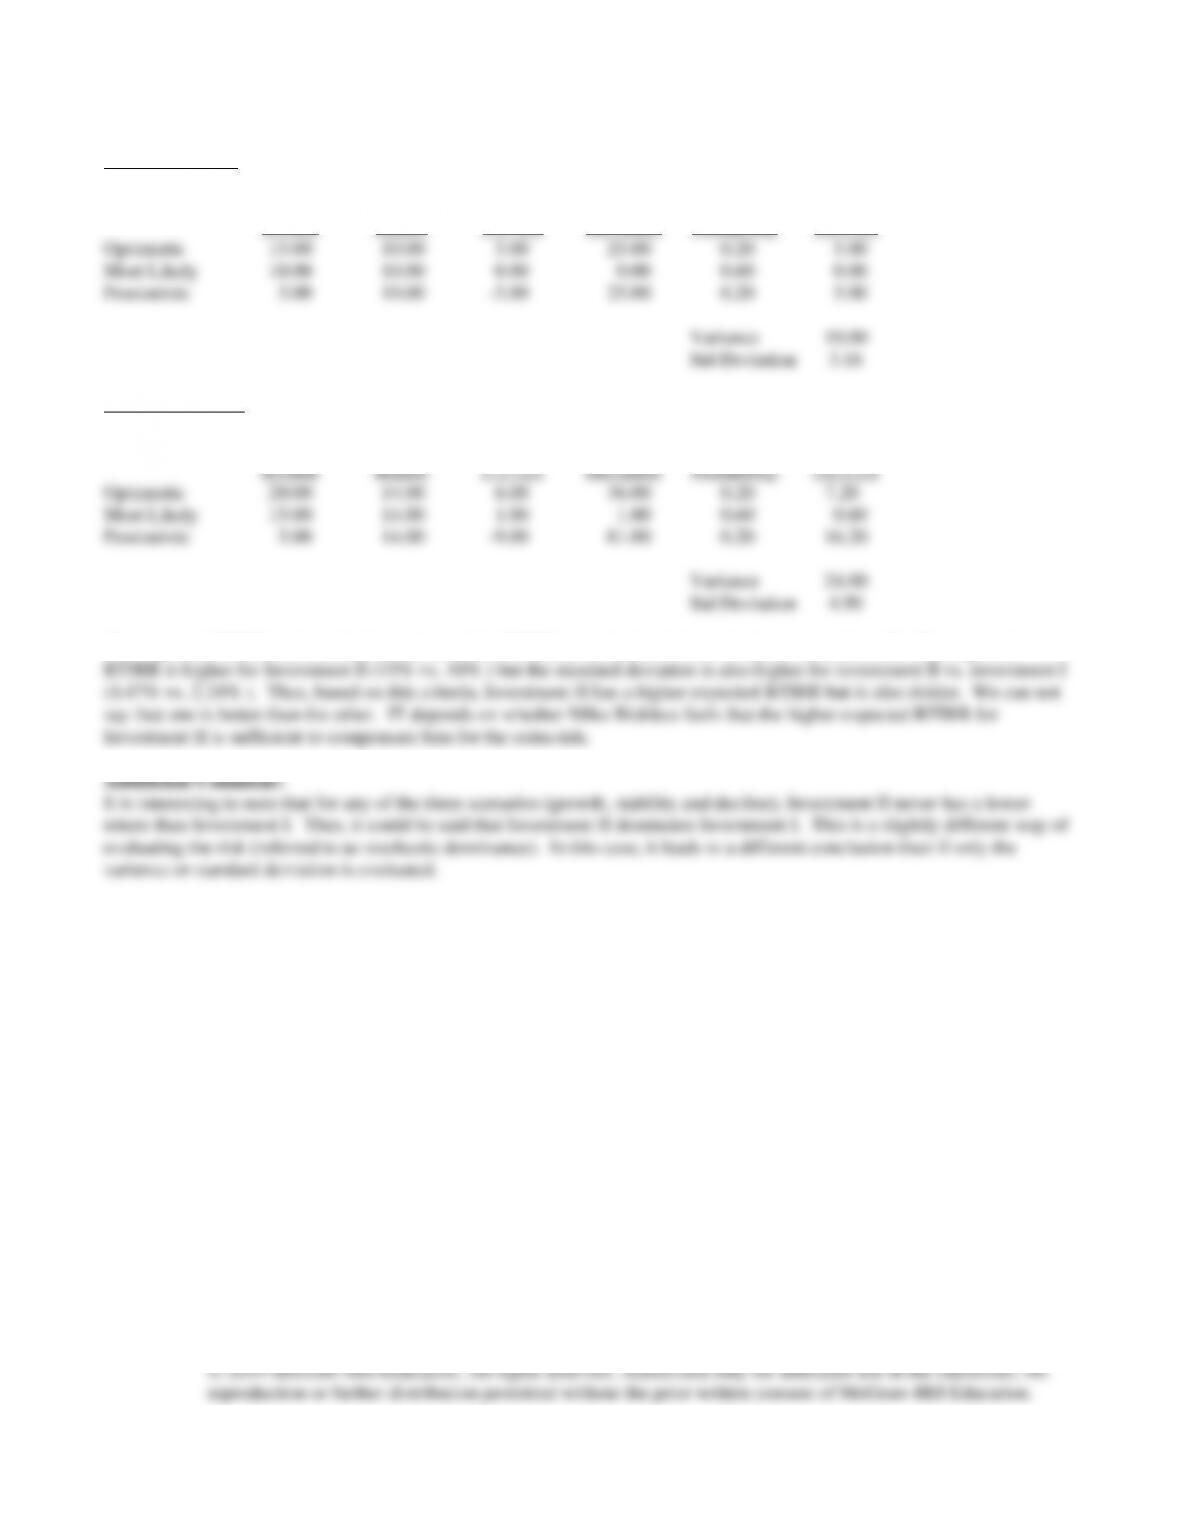
Problem 13-2
INVESTMENT I
(1)
(2)
(3)
(4)
(5)
(6)
Estimated
Expected
Deviation
Squared
Product
BTIRR
Return
(1) – (2)
Deviation
Probability
(4) x (5)
Optimistic
15.00
10.00
5.00
25.00
0.20
5.00
Most Likely
10.00
10.00
0.00
0.00
0.60
0.00
Pessimistic
5.00
10.00
-5.00
25.00
0.20
5.00
Variance
10.00
Std Deviation
3.16
INVESTMENT II
(1)
(2)
(3)
(4)
(5)
(6)
Estimated
Expected
Deviation
Squared
Product
BTIRR
Return
(1) – (2)
Deviation
Probability
(4) x (5)
Optimistic
20.00
14.00
6.00
36.00
0.20
7.20
Most Likely
15.00
14.00
1.00
1.00
0.60
0.60
Pessimistic
5.00
14.00
-9.00
81.00
0.20
16.20
Variance
24.00
Std Deviation
4.90
The expected BTIRR and standard deviation of the BTIRR are calculated above for Investment I and II. The expected
Problem 13-3
(REFER TO TEMPLATE 13_3.XLS)
ASSUMPTIONS:
Pessimistic
Most-Likely
Optimistic
Scenario Probability
30%
40%
30%
NOI
$200,000
$200,000
$200,000
Change in NOI
-2.00%
0.00%
3.00%
Sale Price
$1,800,000
$2,000,000
$2,200,000
Asking Price
$2,000,000
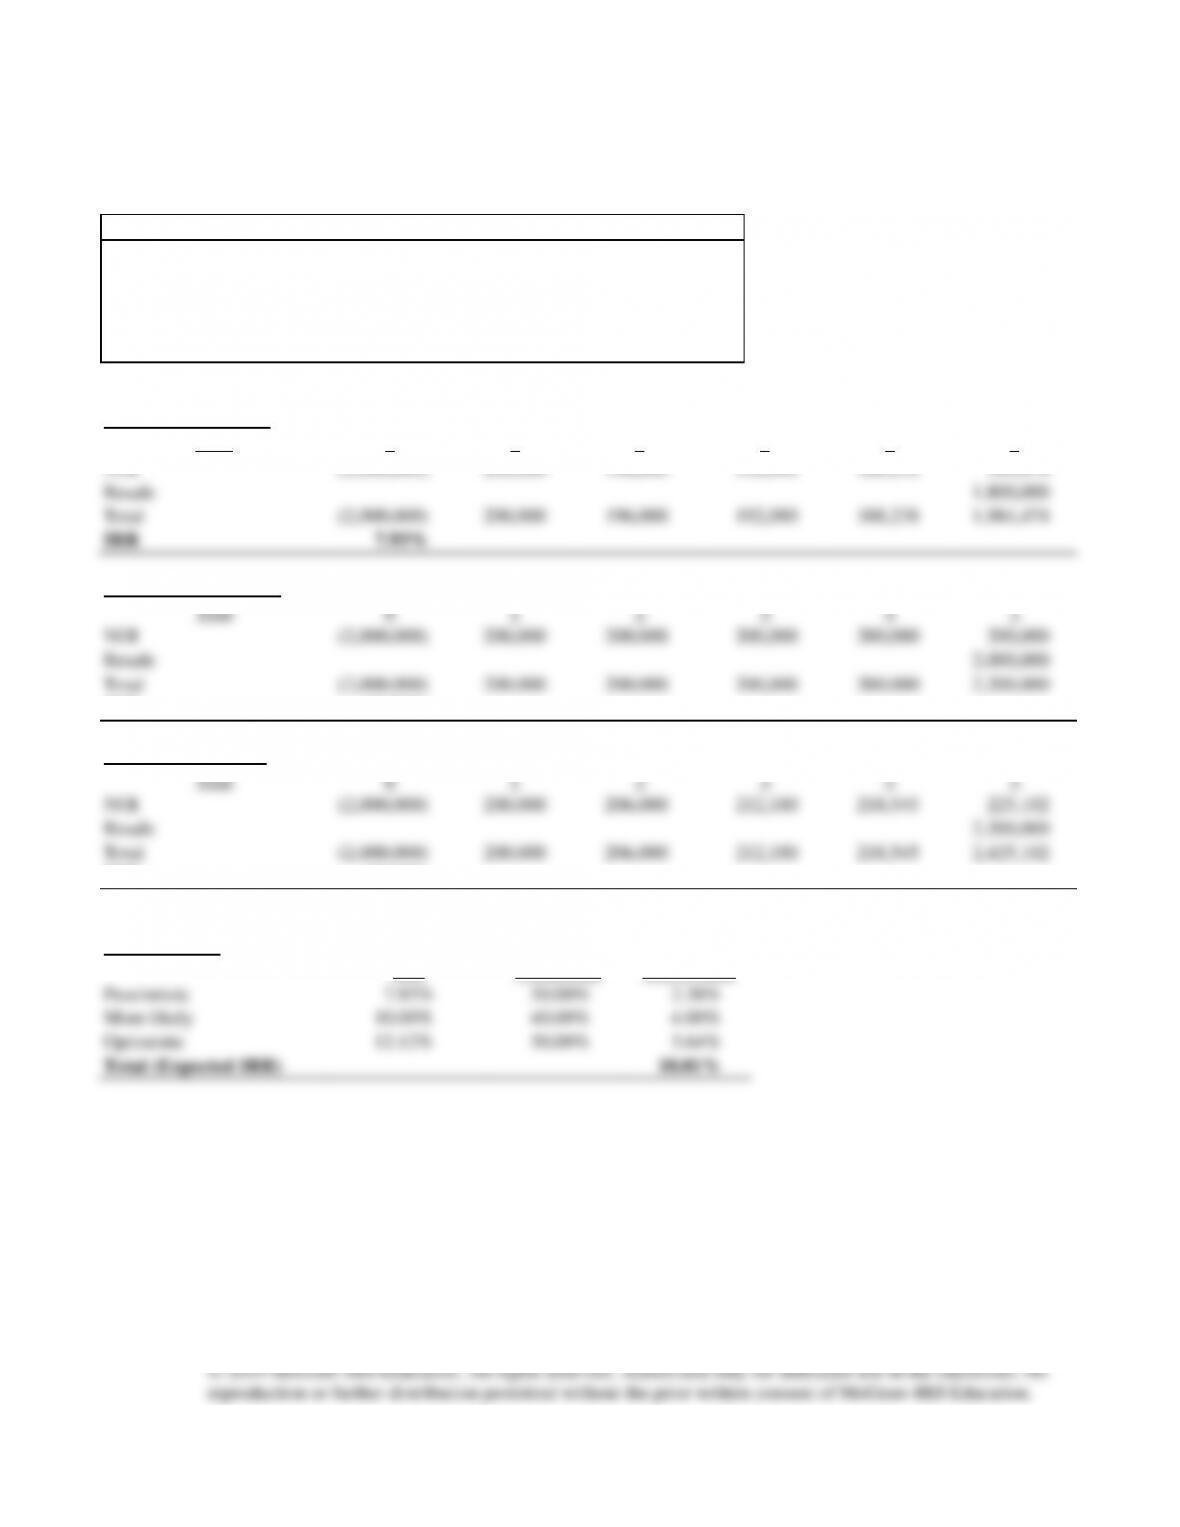
(a)
Pessimistic Scenario
Year
0
1
2
3
4
5
NOI
(2,000,000)
200,000
196,000
192,080
188,238
184,474
Resale
1,800,000
Total
(2,000,000)
200,000
196,000
192,080
188,238
1,984,474
IRR
7.93%
Most-Likely Scenario
Year
0
1
2
3
4
5
NOI
(2,000,000)
200,000
200,000
200,000
200,000
200,000
Resale
2,000,000
Total
(2,000,000)
200,000
200,000
200,000
200,000
2,200,000
IRR
10.00%
Optimistic Scenario
Year
0
1
2
3
4
5
NOI
(2,000,000)
200,000
206,000
212,180
218,545
225,102
Resale
2,200,000
Total
(2,000,000)
200,000
206,000
212,180
218,545
2,425,102
IRR
12.12%
(b)
Expected IRR
IRR
Probability
IRR x Prob.
Pessimistic
7.93%
30.00%
2.38%
Most-likely
10.00%
40.00%
4.00%
Optimistic
12.12%
30.00%
3.64%
Total (Expected IRR)
10.01%
(c)
Variance & Standard Deviation
Square of IRR
-Expected IRR
Probability
IRR x Prob.
Pessimistic
0.04%
30.00%
0.01%
Most-likely
0.00%
40.00%
0.00%
Optimistic
0.04%
30.00%
0.01%
Variance
0.0263%
Std. Dev.
1.62%
(d)
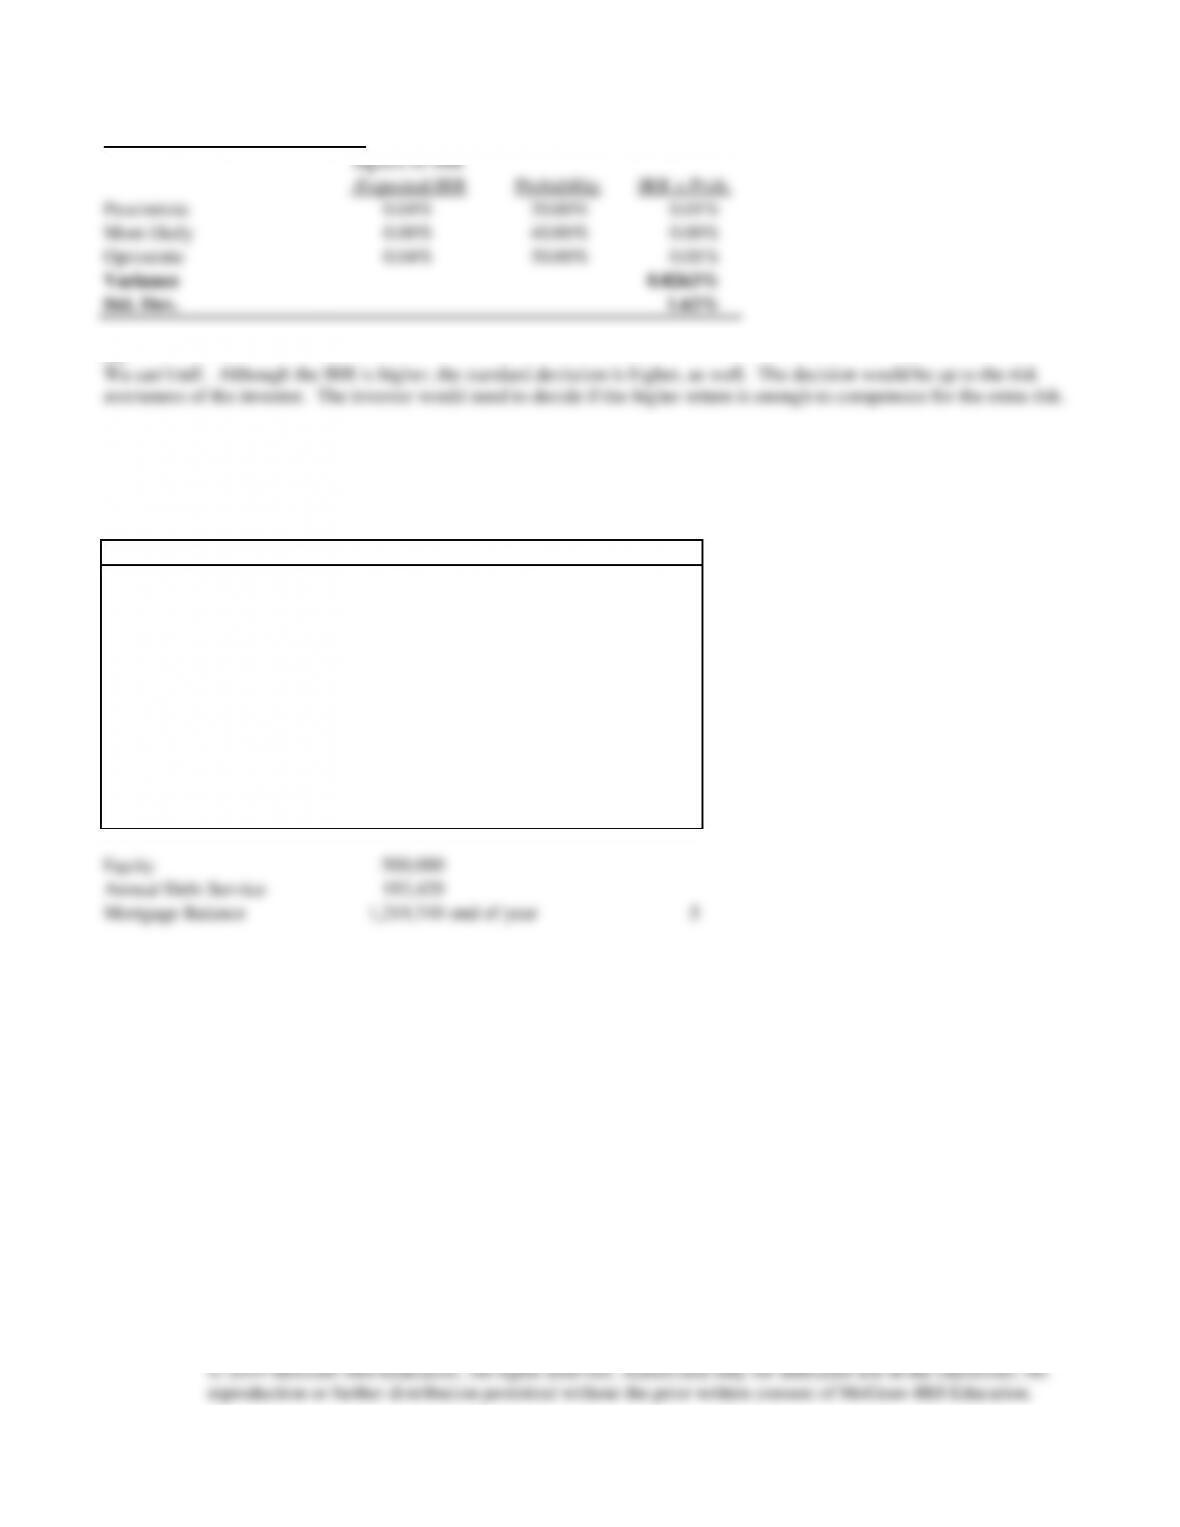
Problem 13-4
(REFER TO TEMPLATE 13_4.XLS)
ASSUMPTIONS:
Pessimistic
Most-Likely
Optimistic
Scenario Probability
30%
40%
30%
NOI
200,000
200,000
200,000
Change in NOI
-2.00%
0.00%
3.00%
Sale Price
1,800,000
2,000,000
2,200,000
Holding Period
5
Asking Price
2,000,000
Loan Amount
1,500,000
Loan Term
15
years
Loan Interest Rate
10.00%
Payments per Year
12
Equity
500,000
Annual Debt Service
193,429
Mortgage Balance
1,219,749
end of year
5
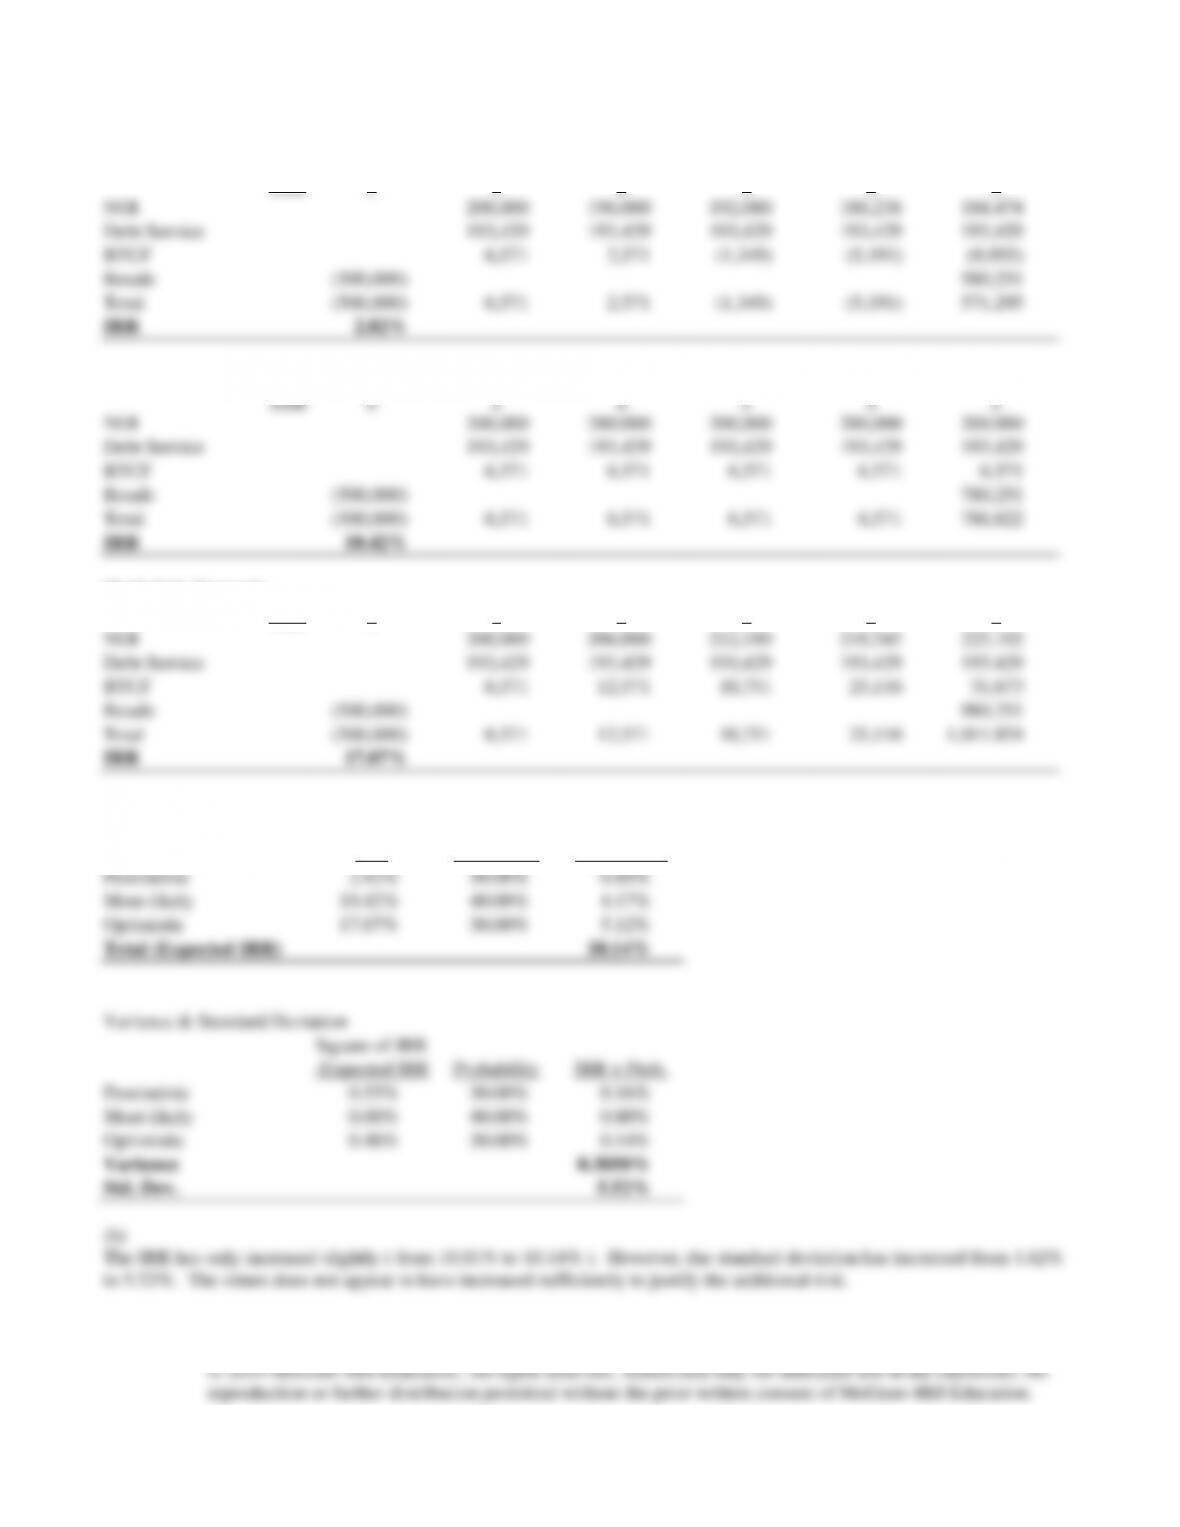
(a) IRR AND STANDARD DEVIATION OF RETURN ON EQUITY:
Pessimistic Scenario
Year
0
1
2
3
4
5
NOI
200,000
196,000
192,080
188,238
184,474
Debt Service
193,429
193,429
193,429
193,429
193,429
BTCF
6,571
2,571
(1,349)
(5,191)
(8,955)
Resale
(500,000)
580,251
Total
(500,000)
6,571
2,571
(1,349)
(5,191)
571,295
IRR
2.82%
Most-Likely Scenario
Year
0
1
2
3
4
5
NOI
200,000
200,000
200,000
200,000
200,000
Debt Service
193,429
193,429
193,429
193,429
193,429
BTCF
6,571
6,571
6,571
6,571
6,571
Resale
(500,000)
780,251
Total
(500,000)
6,571
6,571
6,571
6,571
786,822
IRR
10.42%
Optimistic Scenario
Year
0
1
2
3
4
5
NOI
200,000
206,000
212,180
218,545
225,102
Debt Service
193,429
193,429
193,429
193,429
193,429
BTCF
6,571
12,571
18,751
25,116
31,673
Resale
(500,000)
980,251
Total
(500,000)
6,571
12,571
18,751
25,116
1,011,924
IRR
17.07%
Expected IRR
IRR
Probability
IRR x Prob.
Pessimistic
2.82%
30.00%
0.85%
Most-likely
10.42%
40.00%
4.17%
Optimistic
17.07%
30.00%
5.12%
Total (Expected IRR)
10.14%
Variance & Standard Deviation
Square of IRR
-Expected IRR
Probability
IRR x Prob.
Pessimistic
0.53%
30.00%
0.16%
Most-likely
0.00%
40.00%
0.00%
Optimistic
0.48%
30.00%
0.14%
Variance
0.3050%
Std. Dev.
5.52%
(b)
The IRR has only increased slightly ( from 10.01% to 10.14% ). However, the standard deviation has increased from 1.62%
to 5.52%. The return does not appear to have increased sufficiently to justify the additional risk.

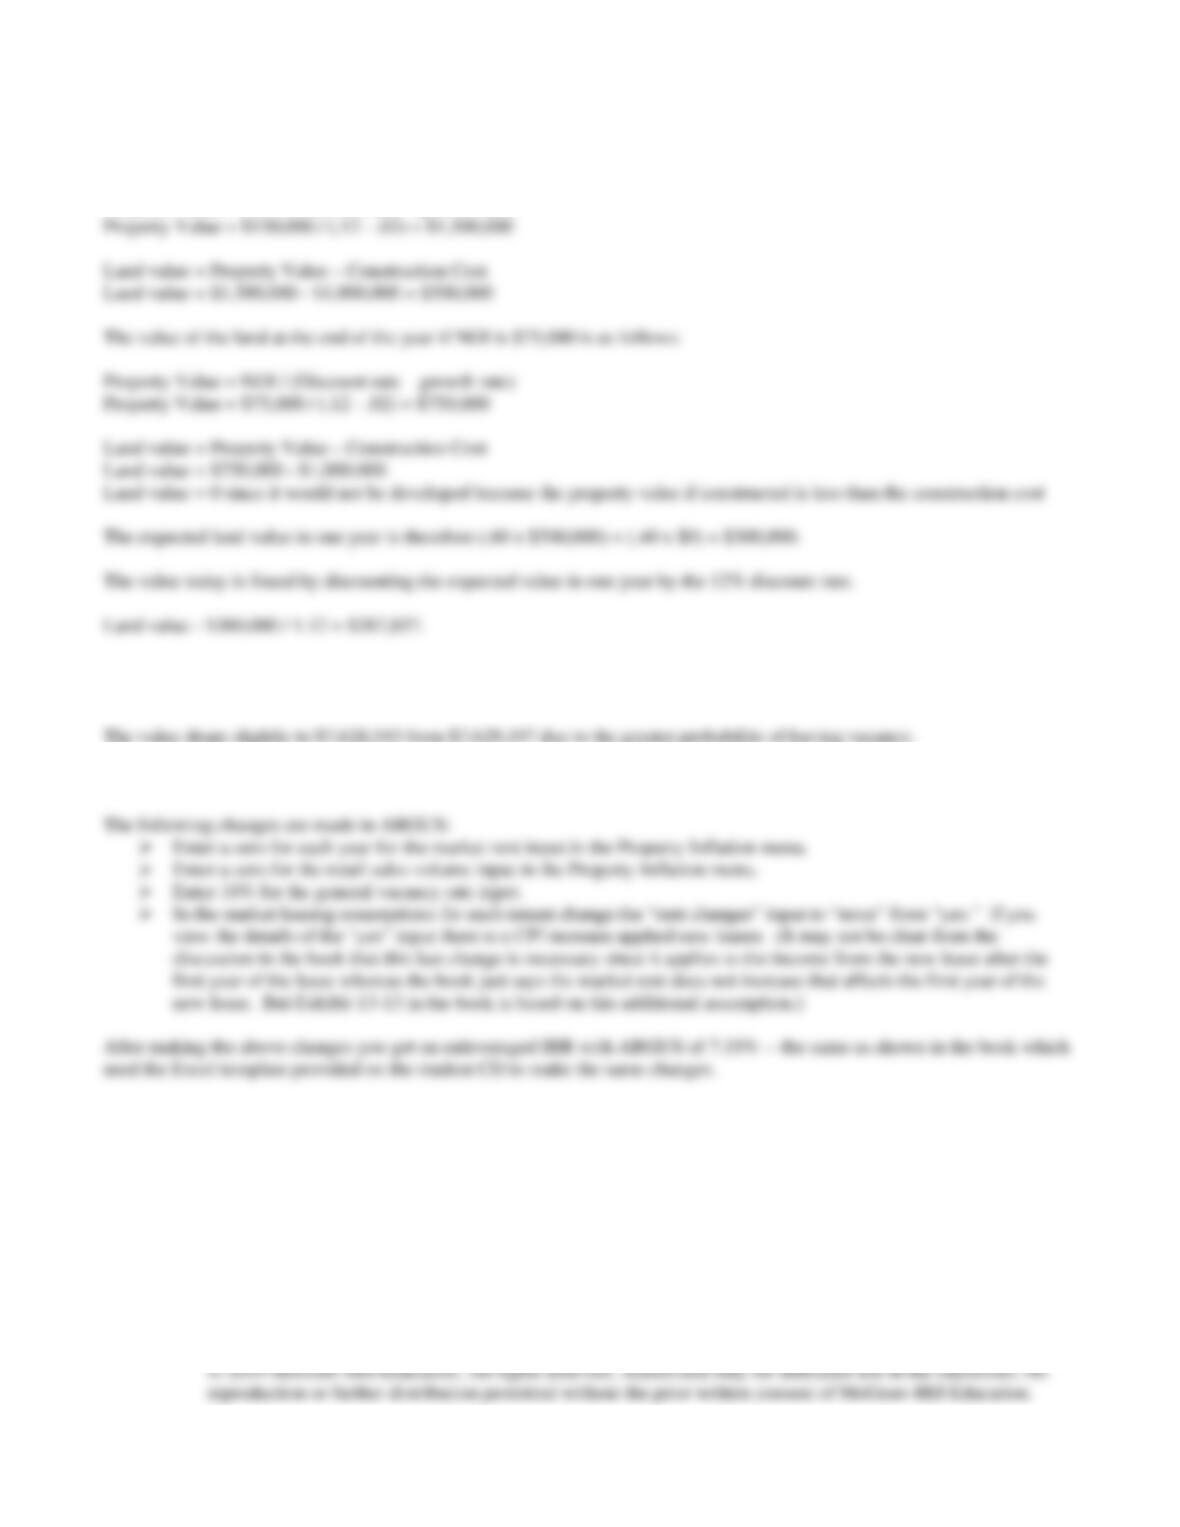
Problem 13-5
The value of the land at the end of the year if the NOI is $150,000 is as follows:
Property Value = NOI / (Discount rate – growth rate)
Problem 13-6
Problem 13-7