Solutions to Questions – Chapter 11
Investment Analysis and Taxation of Income Properties
Question 11-1
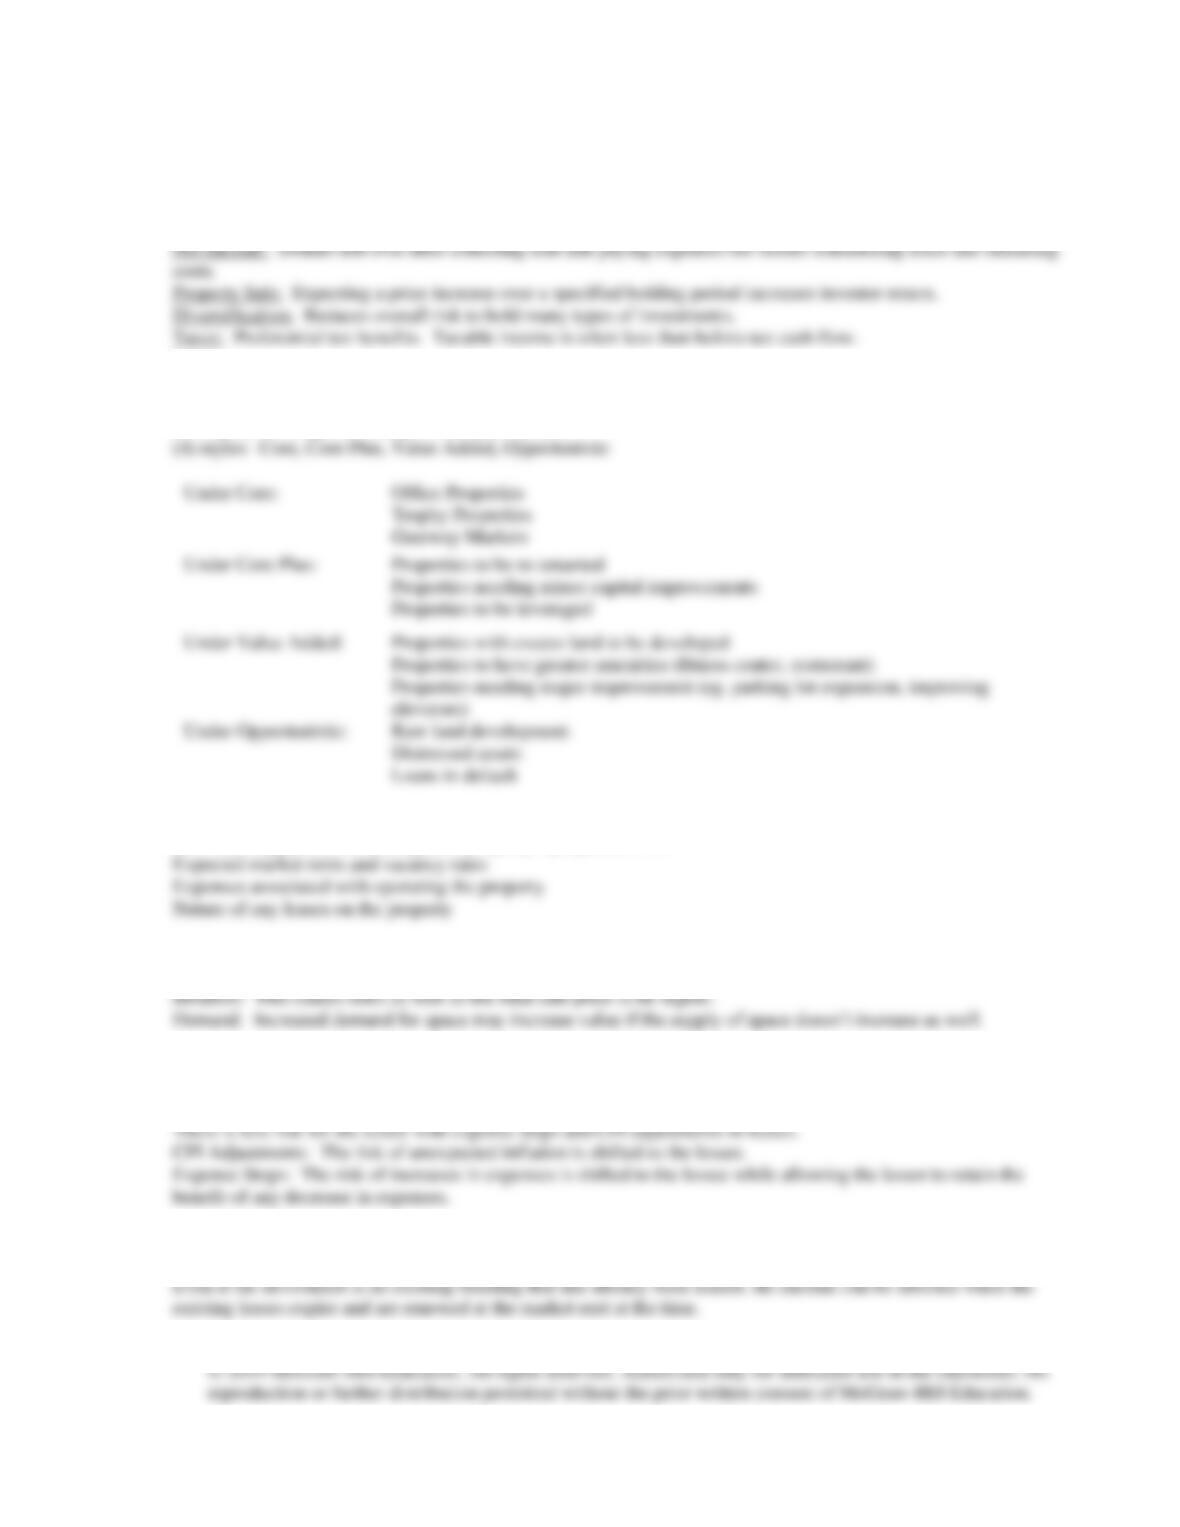
What are the motivations for investing in real estate income property?
Question 11-2
Name the four general real estate investment styles and describe each. Identify three investment strategies within
these general categories and give examples of each.
Question 11-7
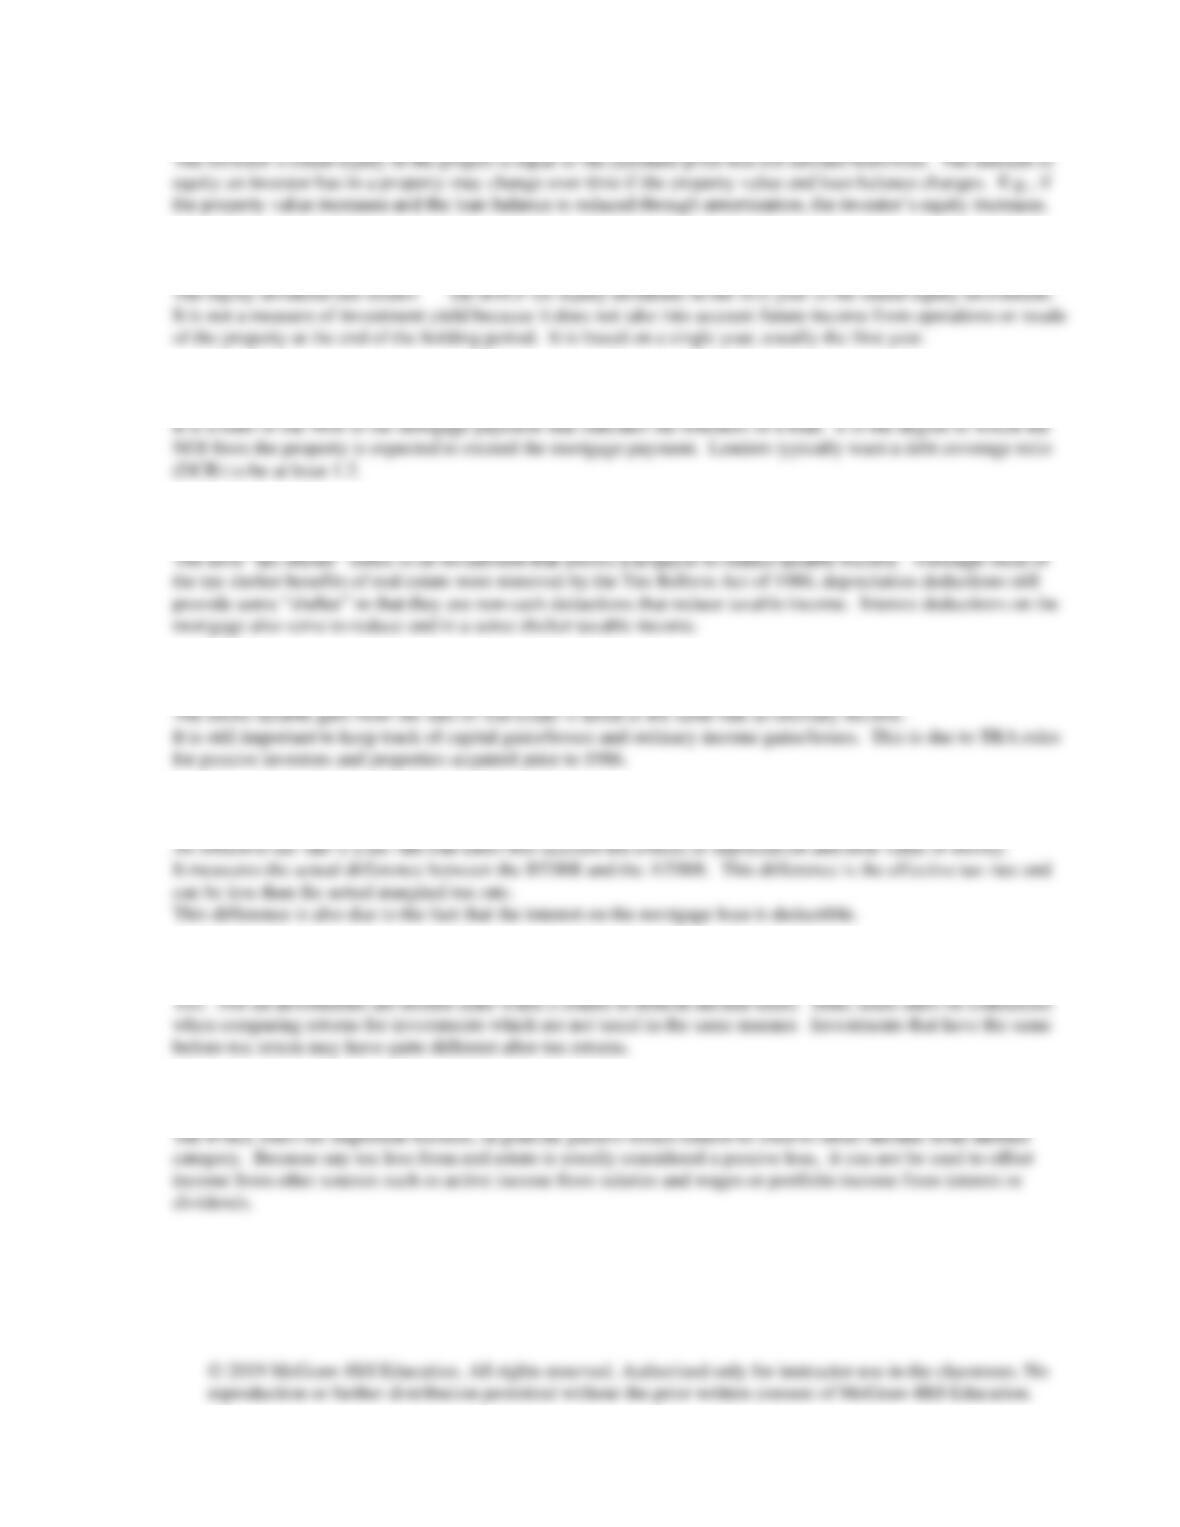
What is meant by equity?
Question 11-8
What is the equity dividend rate?
Question 11-9
What is the significance of a debt coverage ratio?
Question 11-10
What is meant by tax shelter?
Question 11-11
How is the gain from the sale of real estate taxed?
Question 11-12
What is meant by an effective tax rate? What does it measure?
Question 11-13
Do you think taxes affect the value of real estate versus other investments?
Question 11-14
What is the significance of the passive activity loss limitation (PALL) rules for real estate investors?
Solutions to Problems – Chapter 11
Investment Analysis and Taxation of Income Properties
Problem 11-1
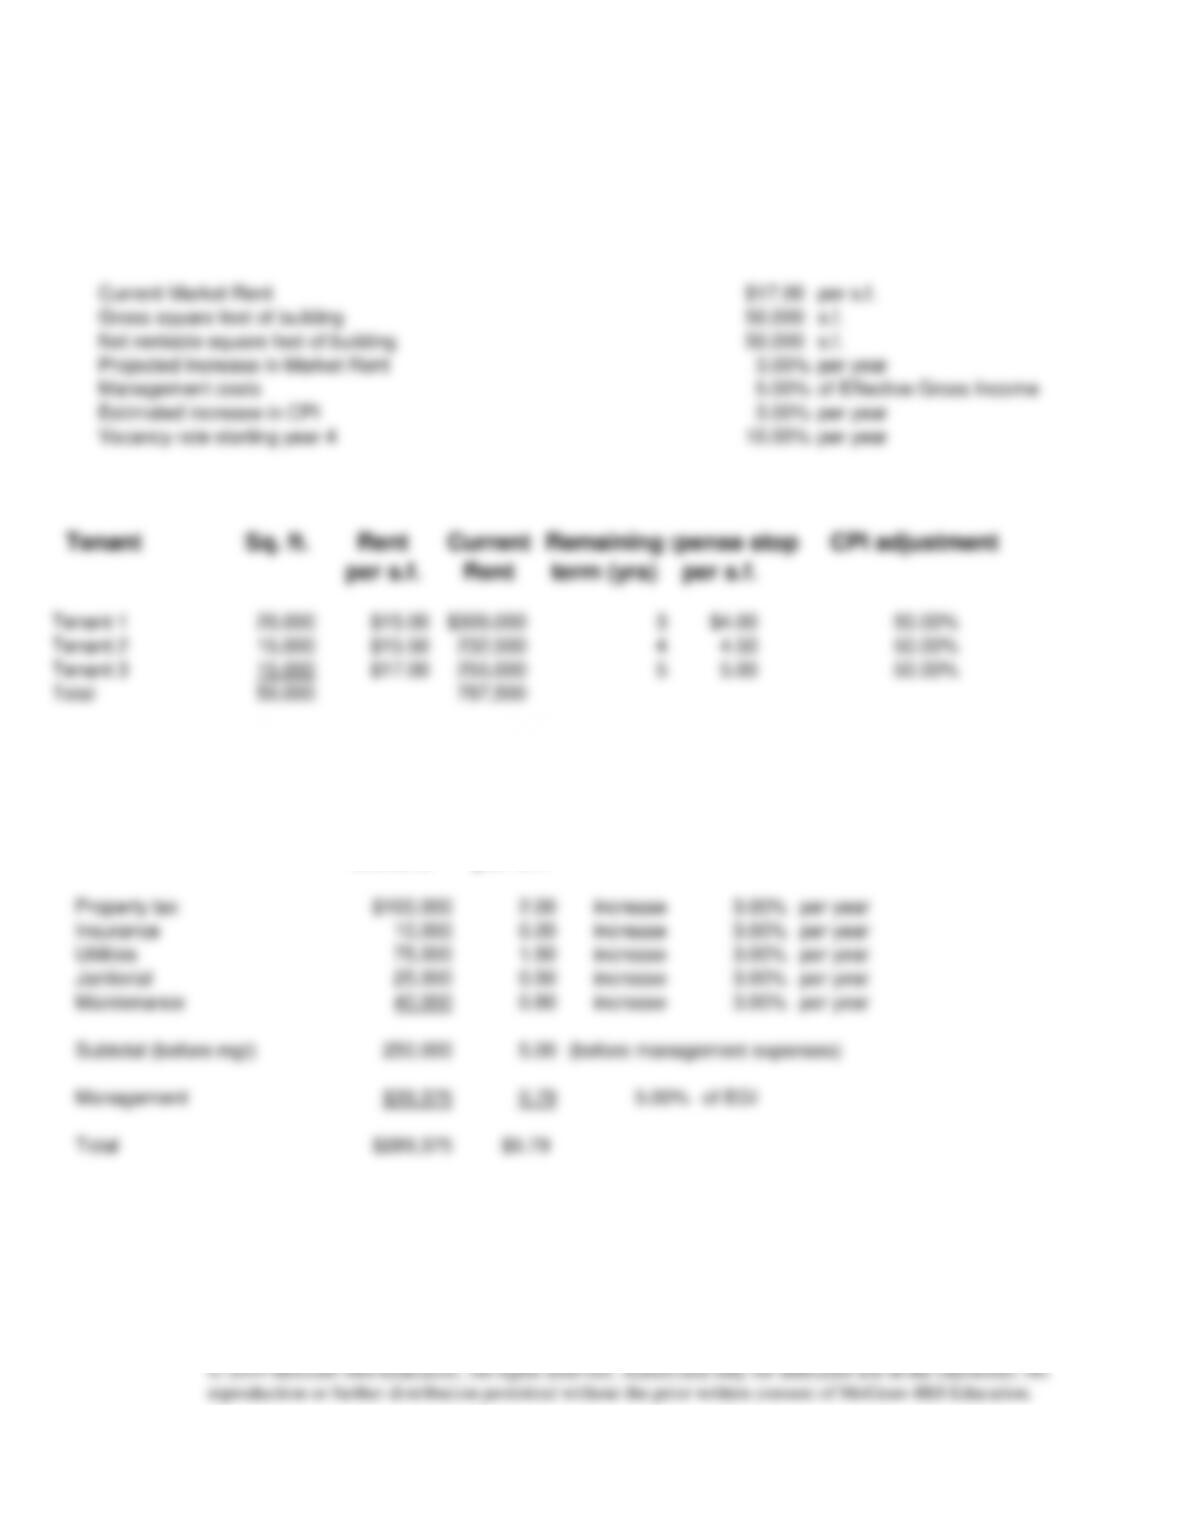
ASSUMPTIONS:
Tenant Sq. ft. Rent Current Remaining
Expense stop
CPI adjustment
per s.f. Rent term (yrs) per s.f.
Tenant 1 20,000 $15.00 $300,000 3 $4.00 50.00%
Tenant 2 15,000 $15.50 232,500 4 4.50 50.00%
Tenant 3 15,000 $17.00 255,000 5 5.00 50.00%
Total 50,000 787,500
Summary of Expense Information
Dollars per s.f.
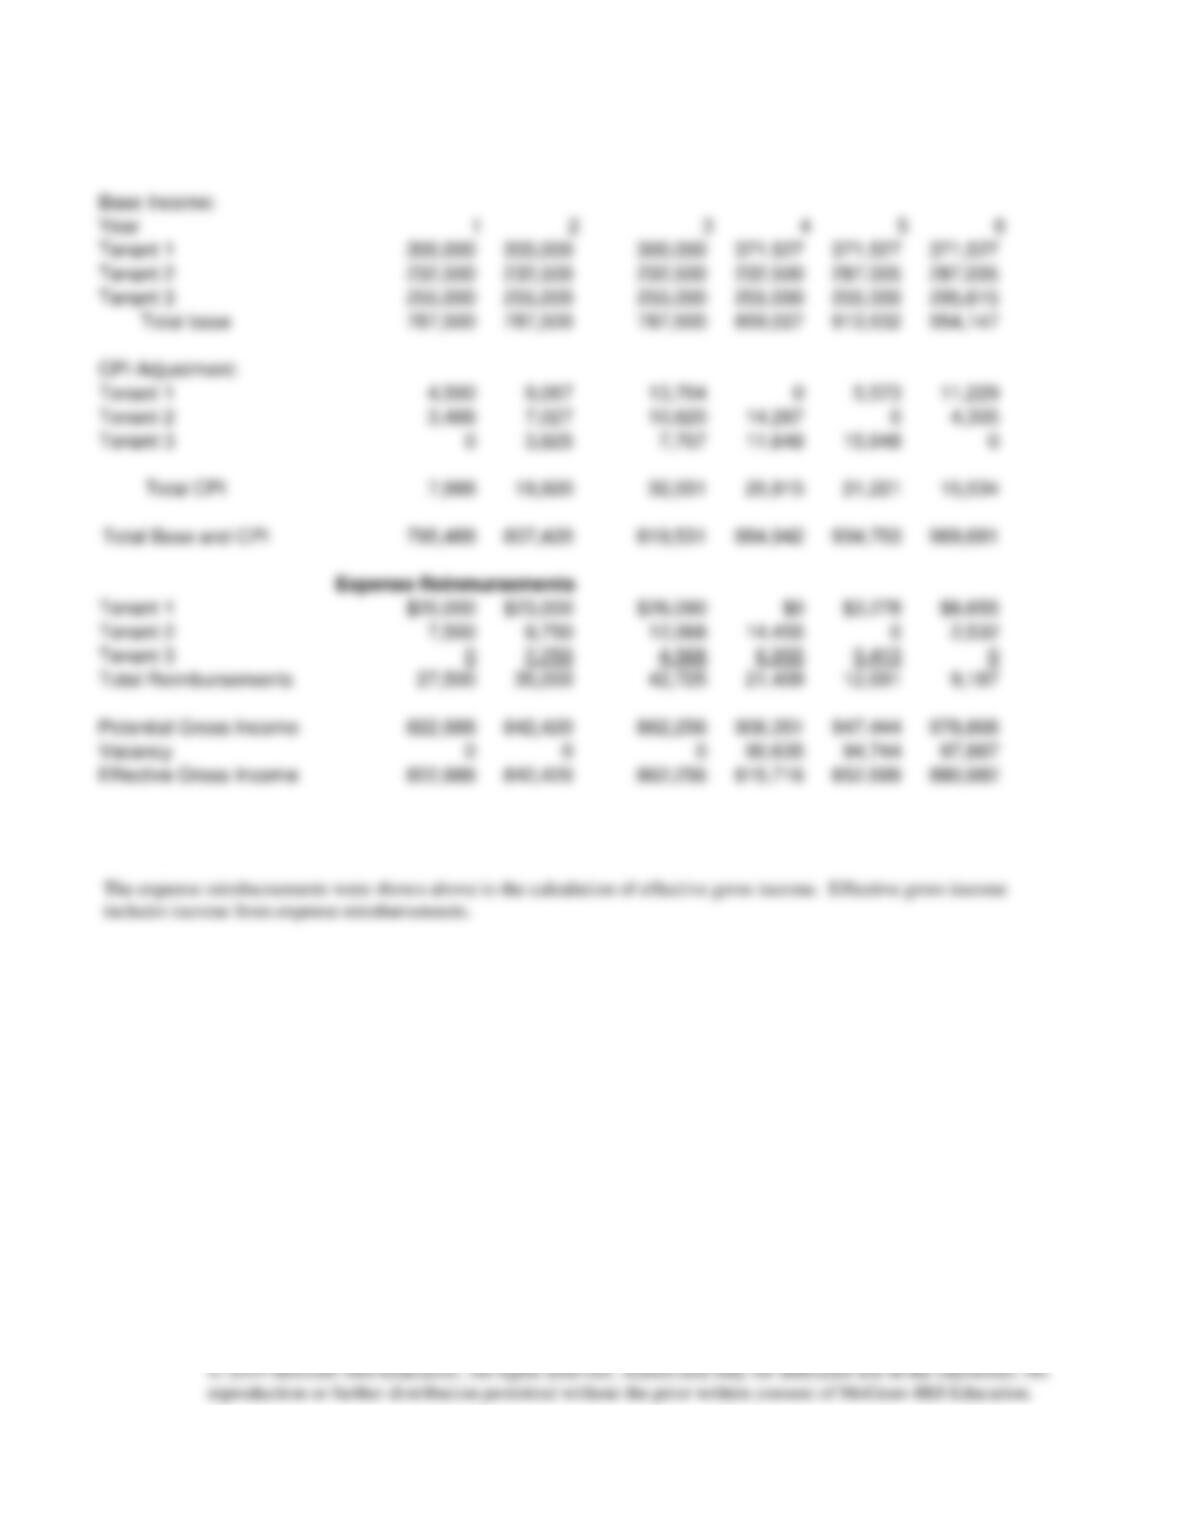
(a) EGI
(b) Expense Reimbursements
Base Income:
Year 1 2 3 4 5 6
Tenant 1 300,000 300,000 300,000 371,527 371,527 371,527
Tenant 2 232,500 232,500 232,500 232,500 287,005 287,005
Tenant 3 255,000 255,000 255,000 255,000 255,000 295,615
Total base 787,500 787,500 787,500 859,027 913,532 954,147
CPI Adjustment:
Tenant 1 4,500 9,067 13,704 05,573 11,229
Tenant 2 3,488 7,027 10,620 14,267 04,305
Tenant 3 0 3,825 7,707 11,648 15,648 0
Total CPI 7,988 19,920 32,031 25,915 21,221 15,534
Total Base and CPI 795,488 807,420 819,531 884,942 934,753 969,681
Tenant 1 $20,000 $23,000 $26,090 $0 $3,278 $6,655
Tenant 2 7,500 9,750 12,068 14,455 02,532
Tenant 3 0 2,250 4,568 6,955 9,413 0
Total Reimbursements 27,500 35,000 42,725 21,409 12,691 9,187
Potential Gross Income 822,988 842,420 862,256 906,351 947,444 978,868
Vacancy 0 0 0 90,635 94,744 97,887
Effective Gross Income 822,988 842,420 862,256 815,716 852,699 880,982
Expense Reinmursements
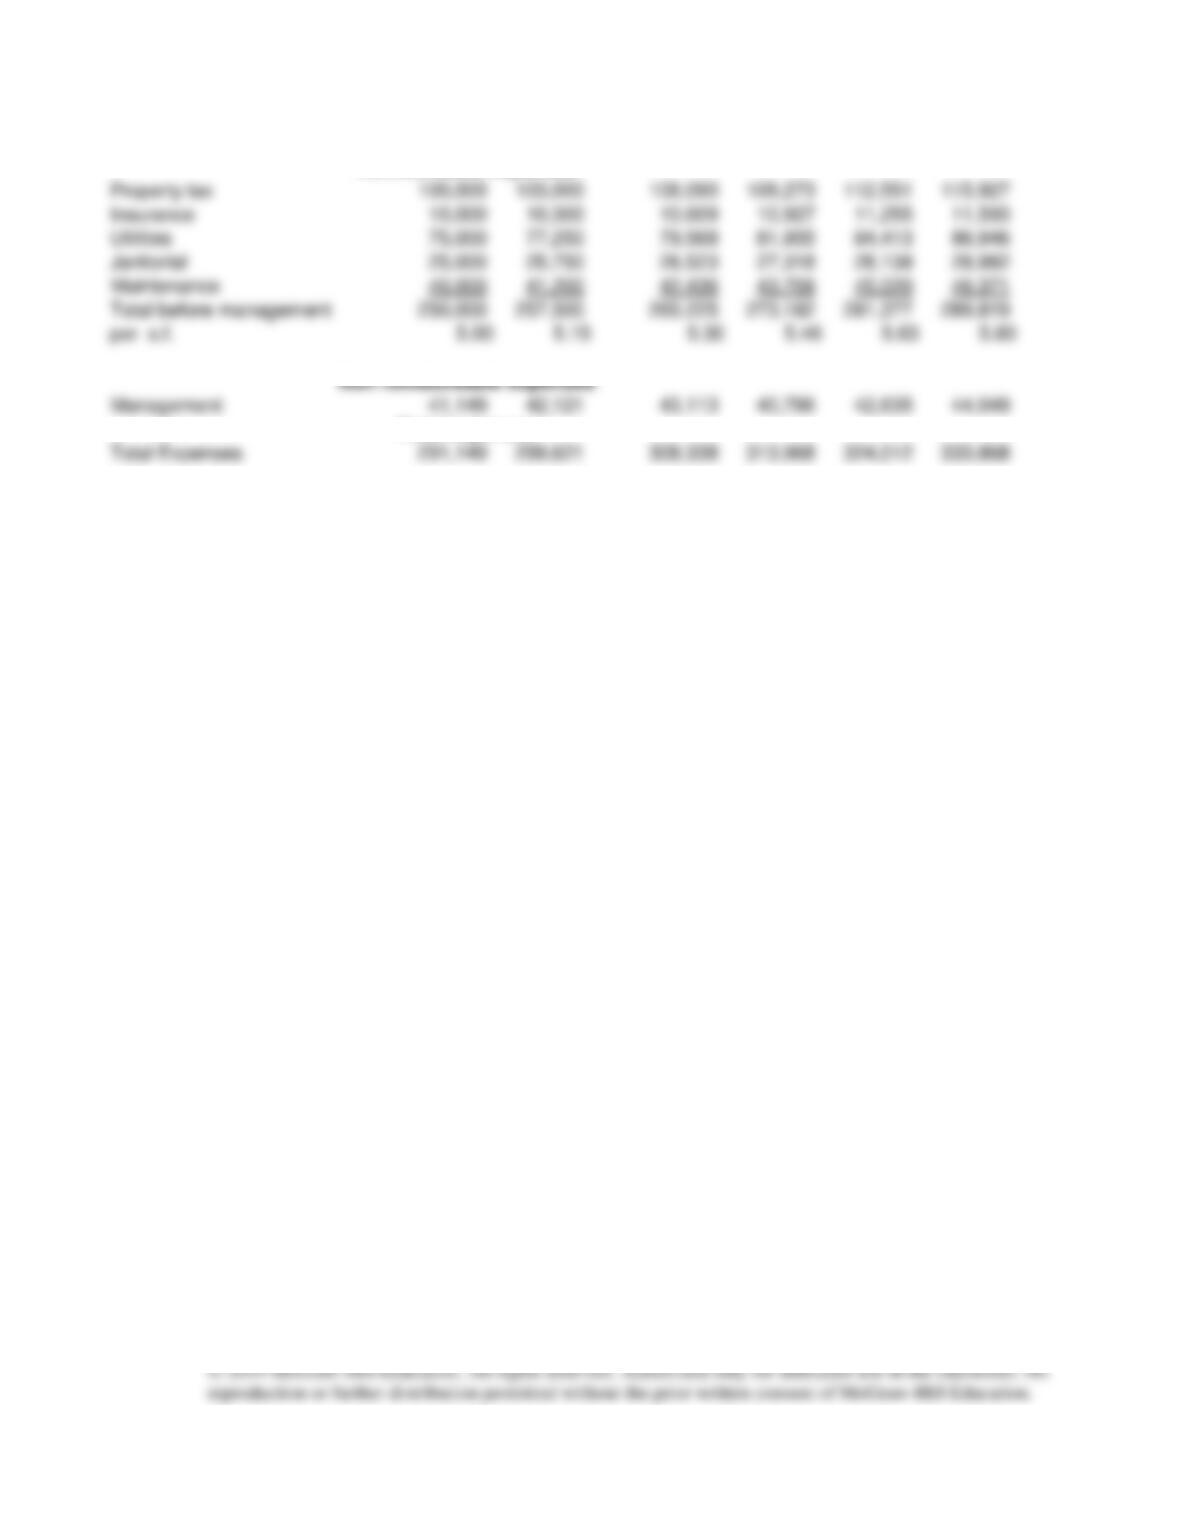
Property tax 100,000 103,000 106,090 109,273 112,551 115,927
Insurance 10,000 10,300 10,609 10,927 11,255 11,593
Utilities 75,000 77,250 79,568 81,955 84,413 86,946
Janitorial 25,000 25,750 26,523 27,318 28,138 28,982
Maintenance 40,000 41,200 42,436 43,709 45,020 46,371
Total before management 250,000 257,500 265,225 273,182 281,377 289,819
per s.f. 5.00 5.15 5.30 5.46 5.63 5.80
Management 41,149 42,121 43,113 40,786 42,635 44,049
Total Expenses 291,149 299,621 308,338 313,968 324,012 333,868
Non reimbursable expenses
Total expenses
SUMMARY OF OPERATING EXPENSES
Reimbursable expenses
Annual increase in NOI over holding period:
0.57%
Cap. Rate:
10.64%
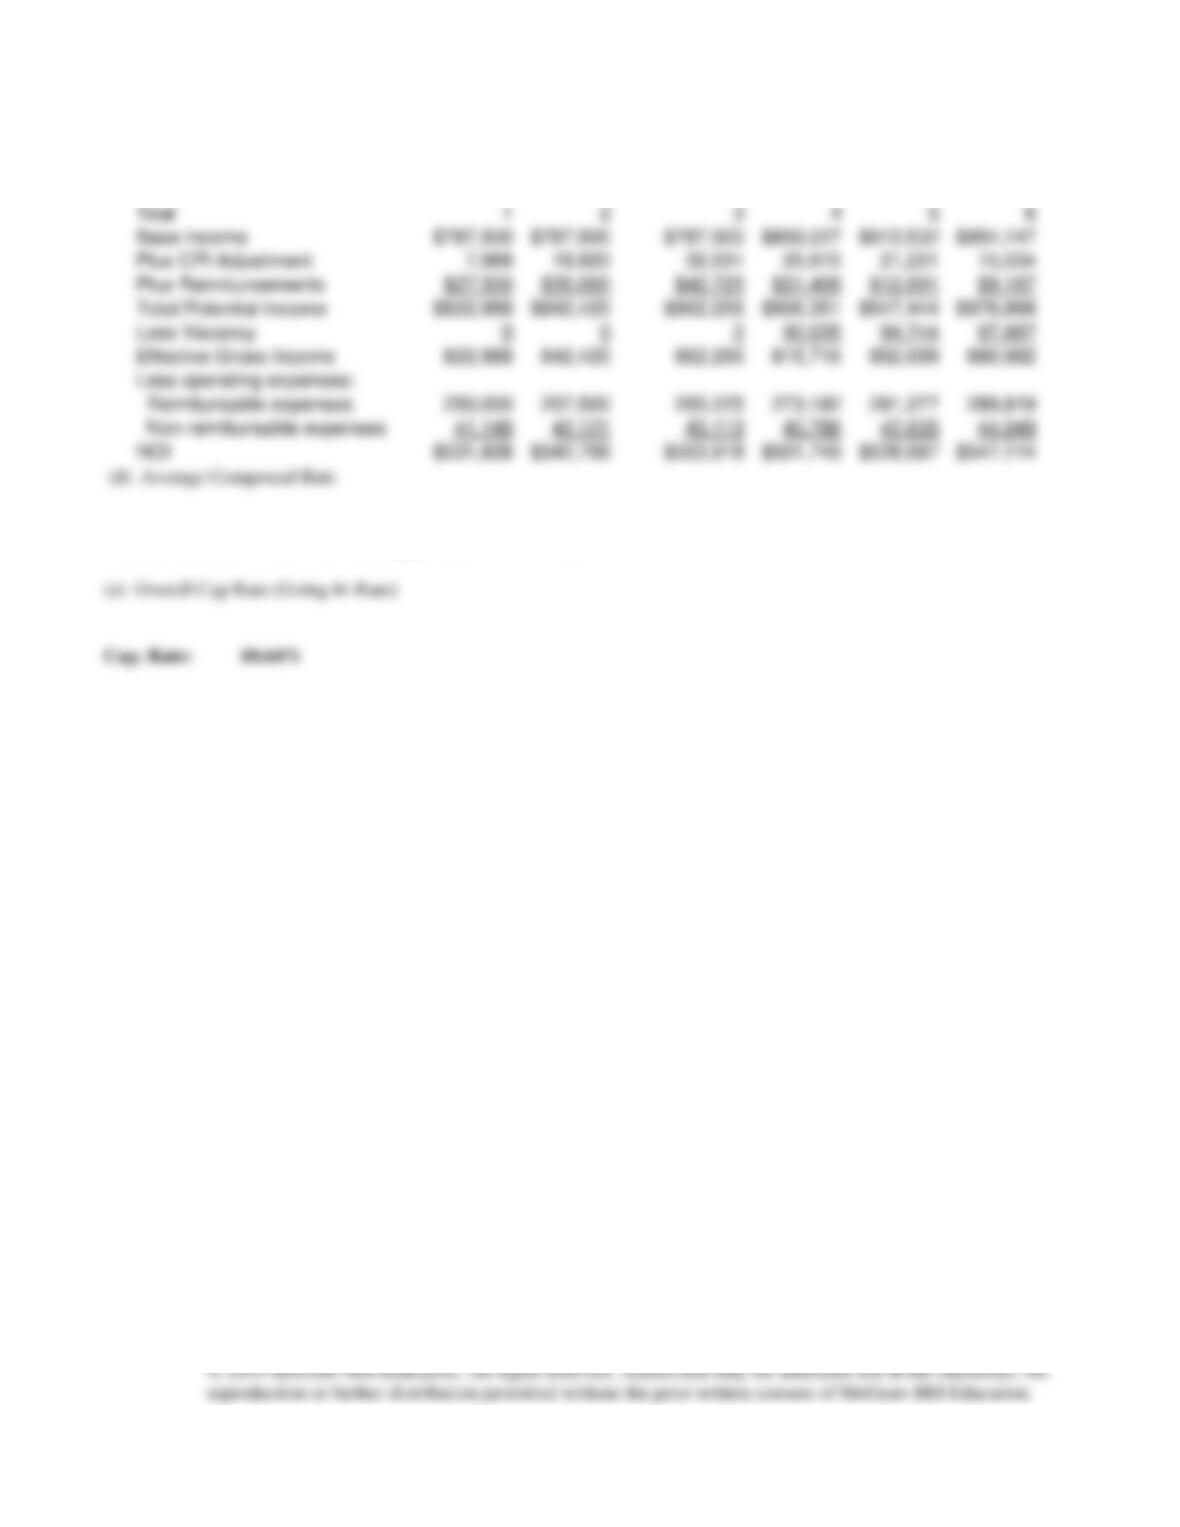
PROJECTED NET OPERATING INCOME
Year 1 2 3 4 5 6
Base income $787,500 $787,500 $787,500 $859,027 $913,532 $954,147
Plus CPI Adjustment 7,988 19,920 32,031 25,915 21,221 15,534
Plus Reimbursements $27,500 $35,000 $42,725 $21,409 $12,691 $9,187
Total Potential Income $822,988 $842,420 $862,256 $906,351 $947,444 $978,868
Less Vacancy 0 0 0 90,635 94,744 97,887
Effective Gross Income 822,988 842,420 862,256 815,716 852,699 880,982
Less operating expenses:
Reimbursable expenses 250,000 257,500 265,225 273,182 281,377 289,819
Non reimbursable expenses 41,149 42,121 43,113 40,786 42,635 44,049
NOI $531,838 $542,799 $553,918 $501,749 $528,687 $547,114
Problem 11-2
ASSUMPTIONS:
Asking Price
$1,250,000
Rent year 1
$200,000
Growth-Rent
3.00%
Vacancy & Coll. Loss
10.00%
of rents
Expenses
35.00%
of EGI
Loan-to-Value
70.00%
Loan Interest
11.00%
Loan term
30
years
Appreciation rate
3.00%
Holding Period
5
years
Selling costs
0.00%
of sale price
Equity discount rate
14.00%
Reinvestment rate
6.00%
Equity
375,000
Loan
875,000
Annual Loan Payment
99,994
Mortgage Balance
850,191
year
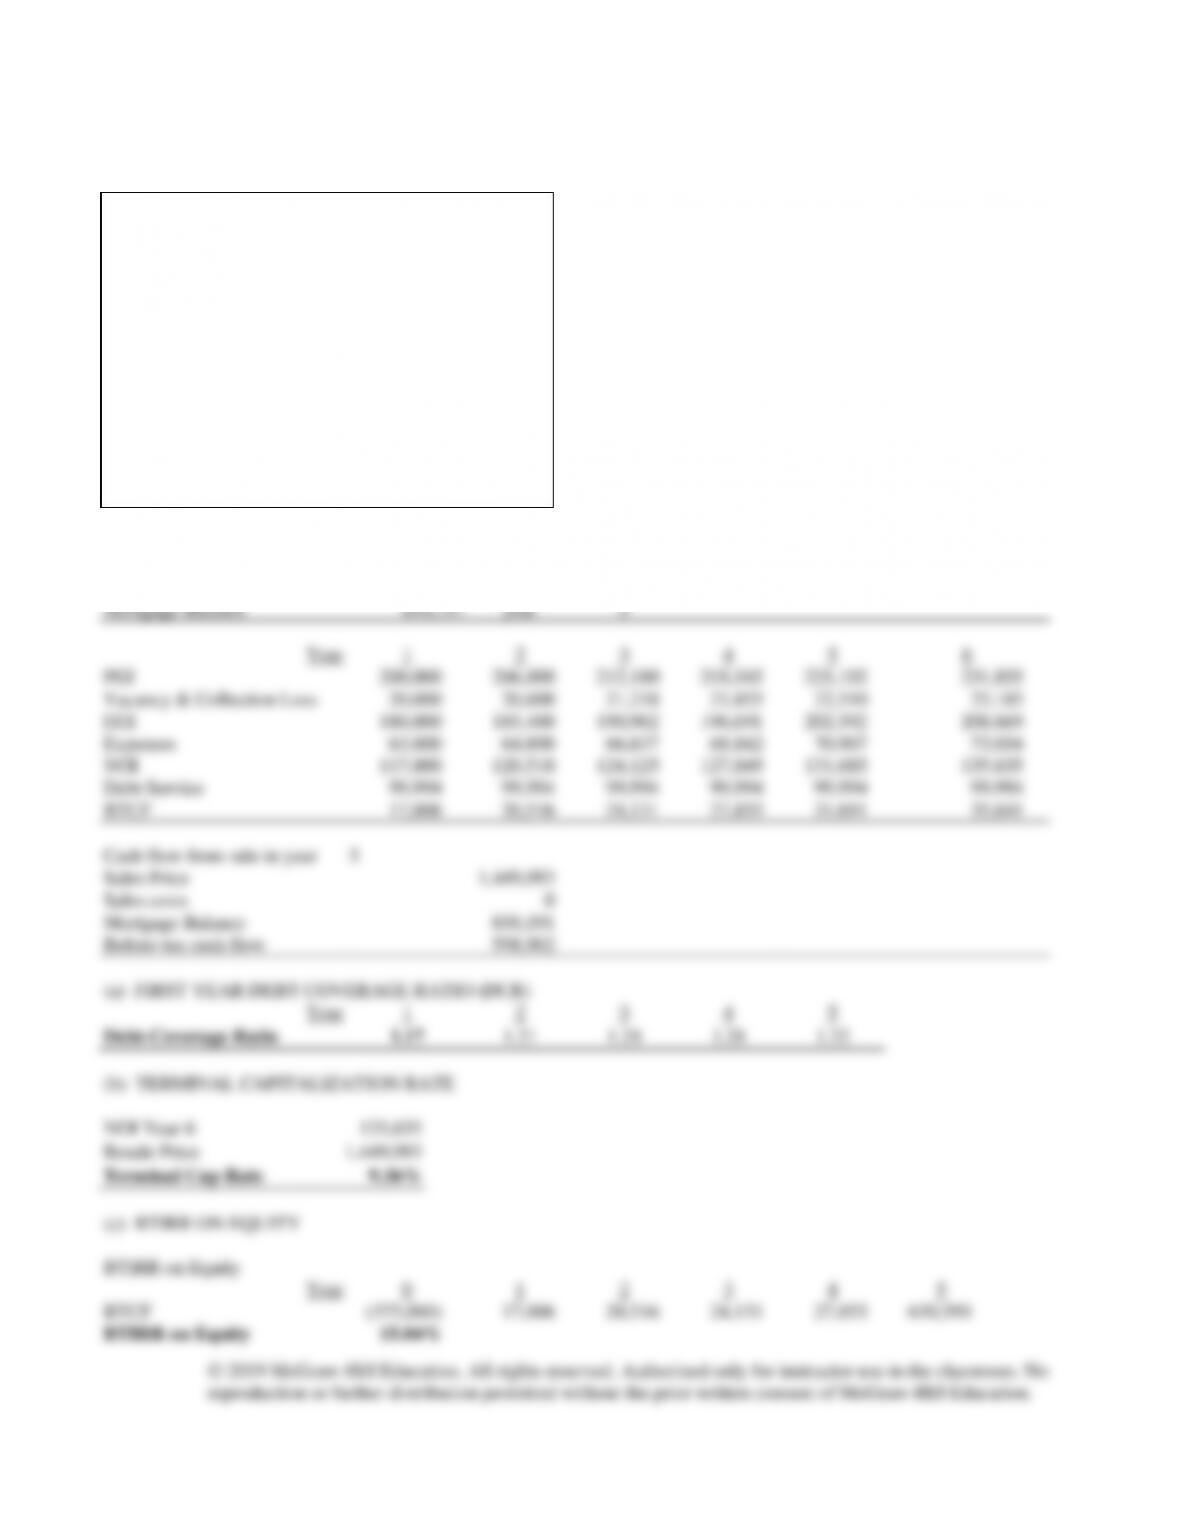
5
Year
1
2
3
4
5
6
PGI
200,000
206,000
212,180
218,545
225,102
231,855
Vacancy & Collection Loss
20,000
20,600
21,218
21,855
22,510
23,185
EGI
180,000
185,400
190,962
196,691
202,592
208,669
Expenses
63,000
64,890
66,837
68,842
70,907
73,034
NOI
117,000
120,510
124,125
127,849
131,685
135,635
Debt Service
99,994
99,994
99,994
99,994
99,994
99,994
BTCF
17,006
20,516
24,131
27,855
31,691
35,641
Cash flow from sale in year
5
Sales Price
1,449,093
Sales costs
0
Mortgage Balance
850,191
Before-tax cash flow
598,902
(a) FIRST YEAR DEBT COVERAGE RATIO (DCR)
Year
1
2
3
4
5
Debt-Coverage Ratio
1.17
1.21
1.24
1.28
1.32
(b) TERMINAL CAPITALIZATION RATE
NOI Year 6
135,635
Resale Price
1,449,093
Terminal Cap Rate
9.36%
(c) BTIRR ON EQUITY
BTIRR on Equity
Year
0
1
2
3
4
5
BTCF
(375,000)
17,006
20,516
24,131
27,855
630,593
BTIRR on Equity
15.04%

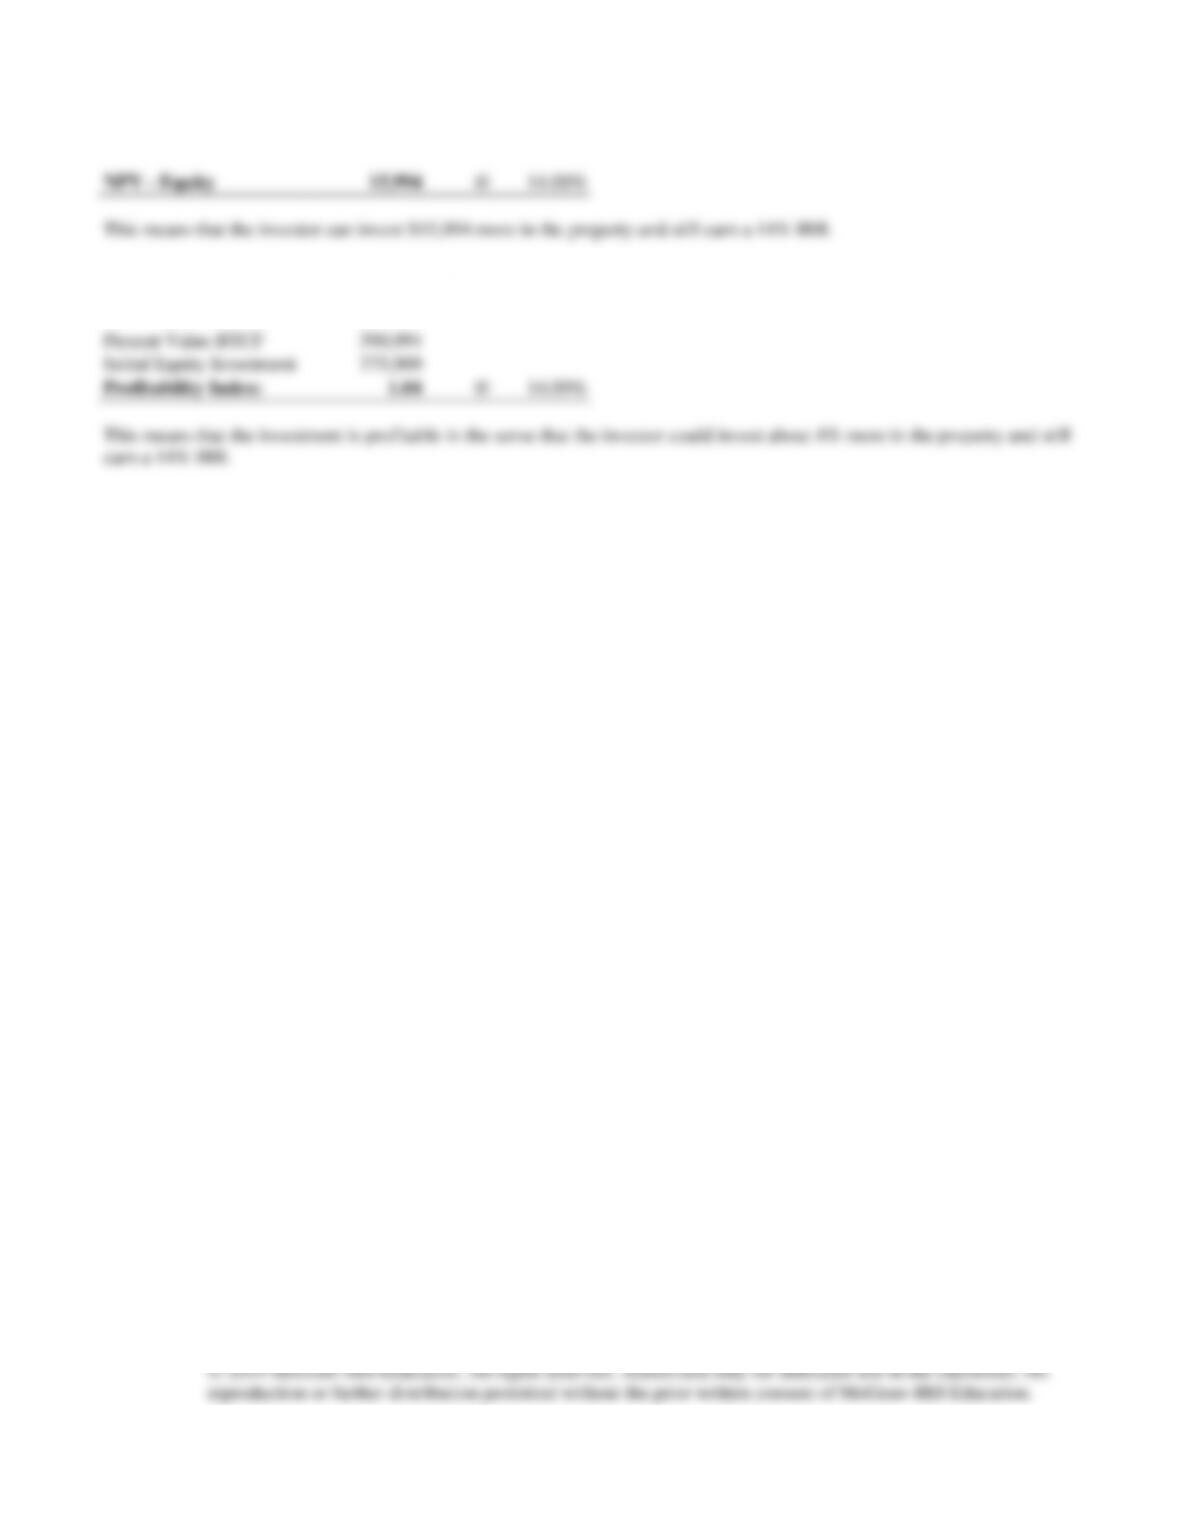
(d) NET PRESENT VALUE
NPV – Equity
@
14.00%
(e) PROFITABILITY INDEX
Present Value BTCF
390,994
Initial Equity Investment
375,000
Profitability Index:
1.04
@
14.00%
This means that the investment is profitable in the sense that the investor could invest about 4% more in the property and still
earn a 14% IRR.
Problem 11-3
ASSUMPTIONS:
Asking Price
$1,250,00
0
Tax Considerations:
Building Value
$1,125,00
0
Depreciation
39
years
Ordinary income tax rate
36.00%
Capital gains tax rate
20.00%
Depreciation recapture
tax rate
25.00%
Loan-to-Value
70.00%
Loan Interest
11.00%
Loan term
30
years
Payments per year
12
Holding Period
5
years
Selling costs
0.00%
of sale price
Equity discount rate
14.00%
Reinvestment rate
6.00%
Equity
375,000
Loan
875,000
Annual Loan Payment
99,994
Mortgage Balance
850,191
year
5
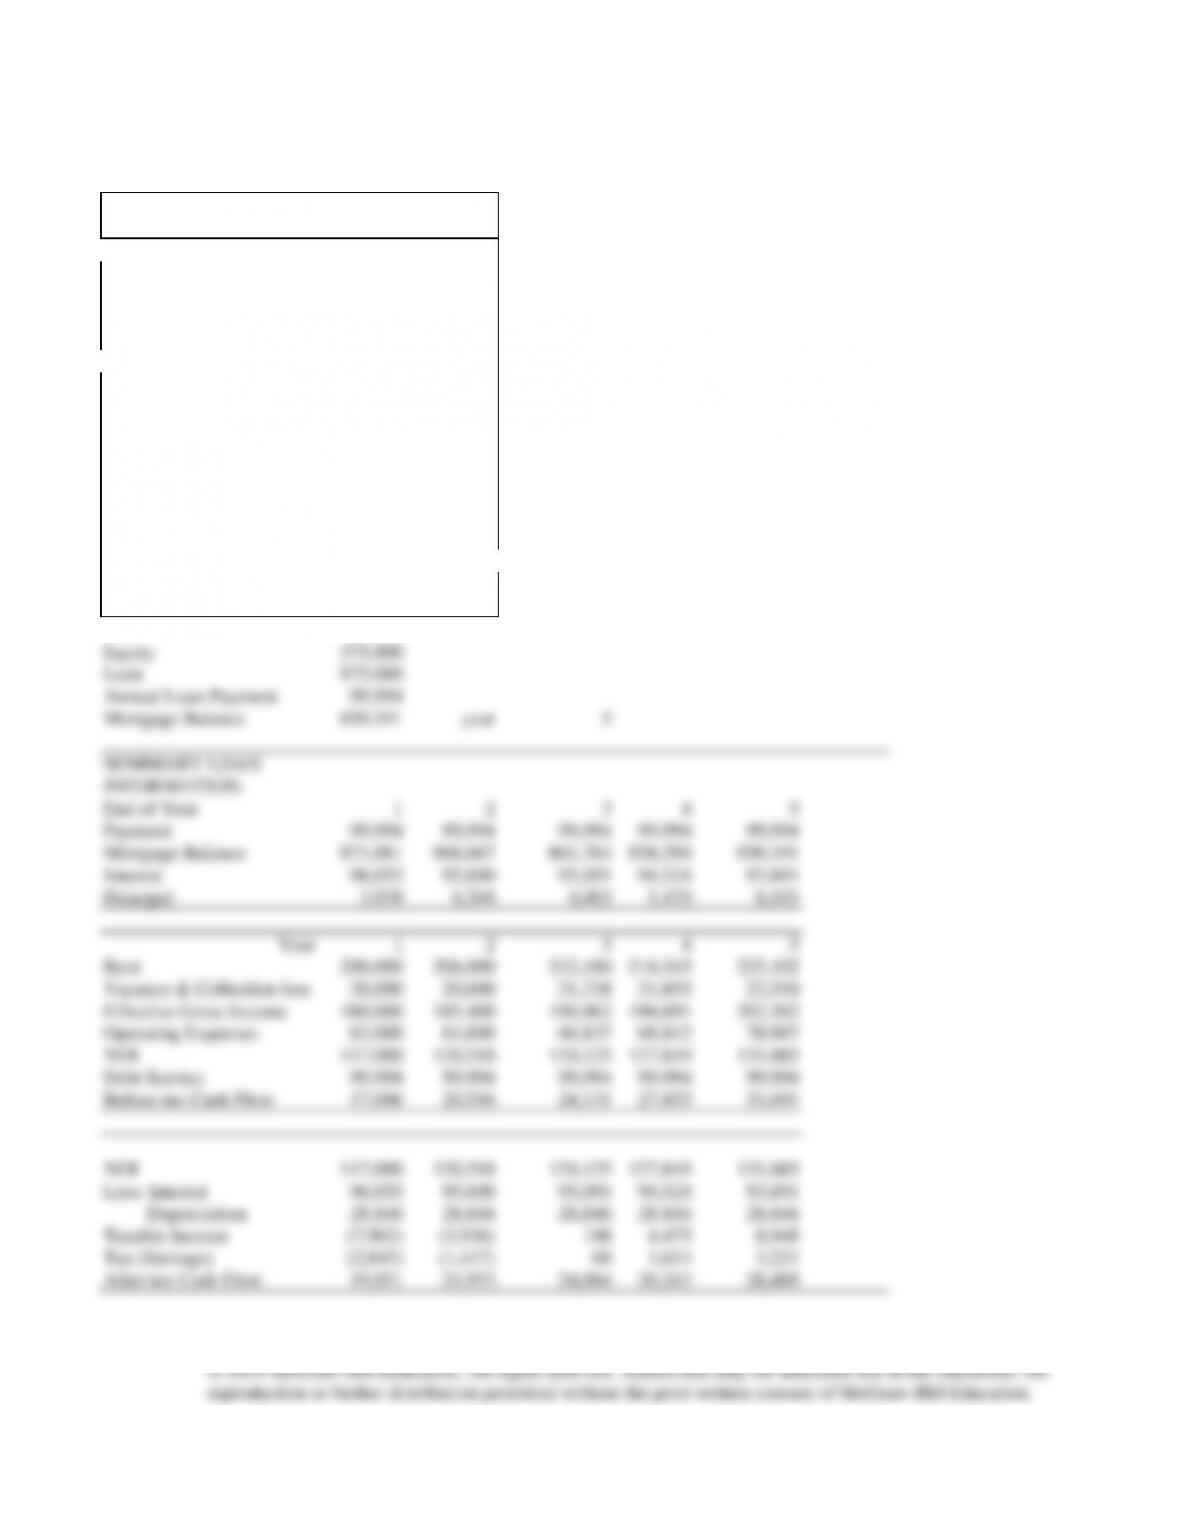
SUMMARY LOAN
INFORMATION:
End of Year
1
2
3
4
5
Payment
99,994
99,994
99,994
99,994
99,994
Mortgage Balance
871,061
866,667
861,764
856,294
850,191
Interest
96,055
95,600
95,091
94,524
93,891
Principal
3,939
4,394
4,903
5,470
6,103
Year
1
2
3
4
5
Rent
200,000
206,000
212,180
218,545
225,102
Vacancy & Collection loss
20,000
20,600
21,218
21,855
22,510
Effective Gross Income
180,000
185,400
190,962
196,691
202,592
Operating Expenses
63,000
64,890
66,837
68,842
70,907
NOI
117,000
120,510
124,125
127,849
131,685
Debt Service
99,994
99,994
99,994
99,994
99,994
Before-tax Cash Flow
17,006
20,516
24,131
27,855
31,691
NOI
117,000
120,510
124,125
127,849
131,685
Less: Interest
96,055
95,600
95,091
94,524
93,891
Depreciation
28,846
28,846
28,846
28,846
28,846
Taxable Income
(7,902)
(3,936)
188
4,479
8,948
Tax (Savings)
(2,845)
(1,417)
68
1,613
3,221
After-tax Cash Flow
19,851
21,933
24,064
26,243
28,469
Cash flow from sale in
year
5
Sales Price
1,449,093
Sales costs
0
Mortgage Balance
850,191
Before-tax cash flow
598,902
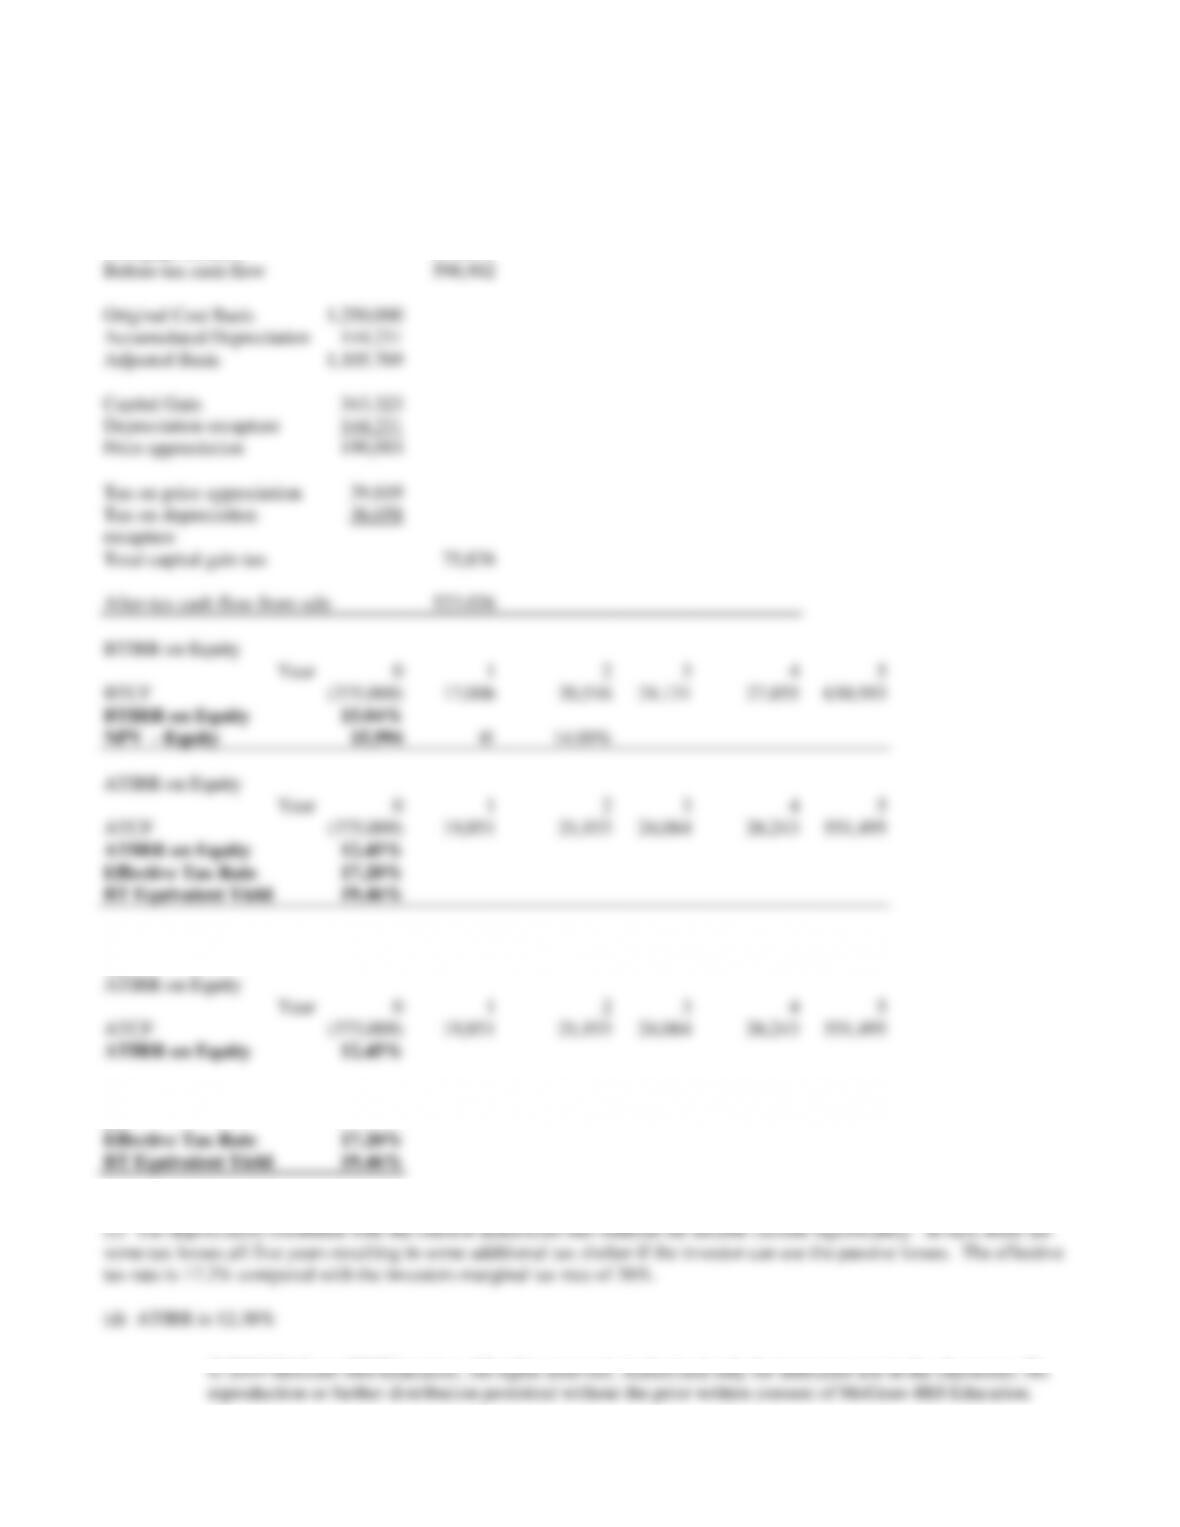
Original Cost Basis
1,250,000
Accumulated Depreciation
144,231
Adjusted Basis
1,105,769
Capital Gain
343,323
Depreciation recapture
144,231
Price appreciation
199,093
Tax on price appreciation
39,819
Tax on depreciation
recapture
36,058
Total capital gain tax
75,876
After-tax cash flow from sale
523,026
BTIRR on Equity
Year
0
1
2
3
4
5
BTCF
(375,000)
17,006
20,516
24,131
27,855
630,593
BTIRR on Equity
15.04%
NPV – Equity
15,994
@
14.00%
ATIRR on Equity
Year
0
1
2
3
4
5
ATCF
(375,000)
19,851
21,933
24,064
26,243
551,495
ATIRR on Equity
12.45%
Effective Tax Rate
17.20%
BT Equivalent Yield
19.46%
(a)
ATIRR on Equity
Year
0
1
2
3
4
5
ATCF
(375,000)
19,851
21,933
24,064
26,243
551,495
ATIRR on Equity
12.45%
(b)
Effective Tax Rate
17.20%
BT Equivalent Yield
19.46%

Spreadsheet limitations: 5 year holding period. Assumes passive losses can not be used
and must be carried forward to offset taxable income in future years.
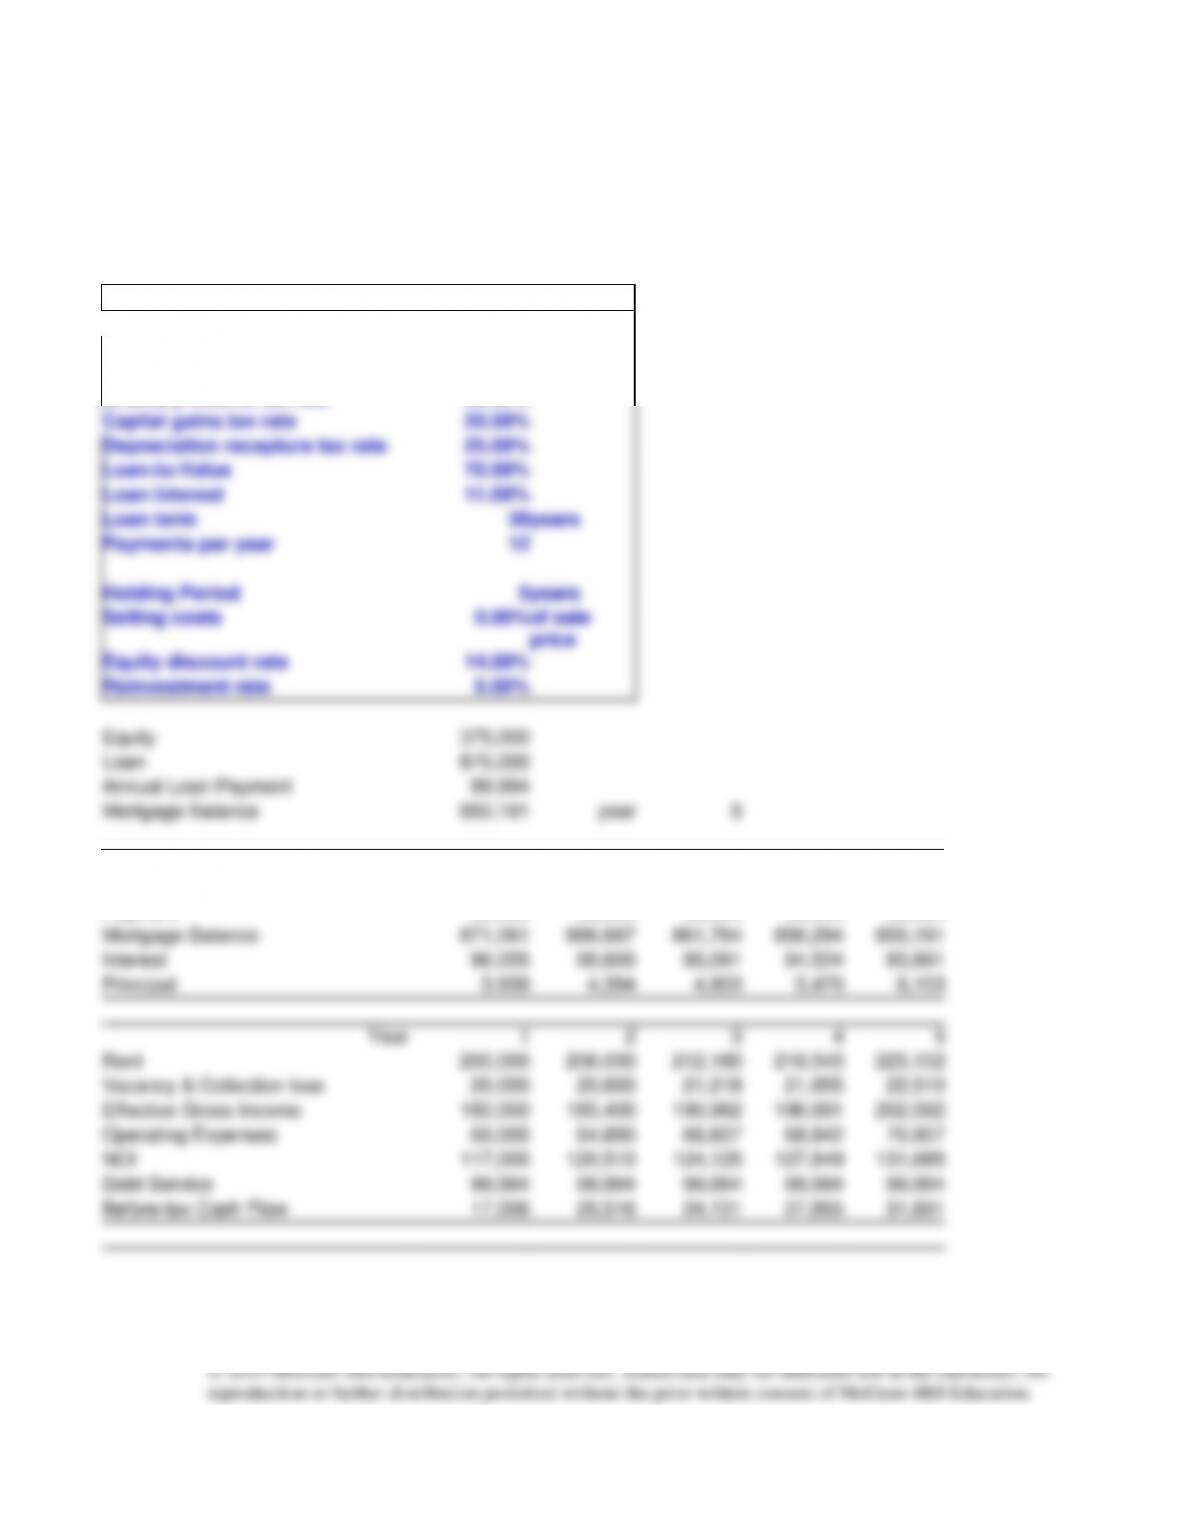
Data Input Box:
Asking Price
$1,250,000
Tax Considerations:
Building Value
$1,125,000
Depreciation
39
years
Ordinary income tax rate
36.00%
Capital gains tax rate
20.00%
Depreciation recapture tax rate
25.00%
Loan-to-Value
70.00%
Loan Interest
11.00%
Loan term
30
years
Payments per year
12
Holding Period
5
years
Selling costs
0.00%
of sale
price
Equity discount rate
14.00%
Reinvestment rate
6.00%
Equity
375,000
Loan
875,000
Annual Loan Payment
99,994
Mortgage Balance
850,191
year
5
SUMMARY LOAN INFORMATION:
End of Year
1
2
3
4
5
Payment
99,994
99,994
99,994
99,994
99,994
Mortgage Balance
871,061
866,667
861,764
856,294
850,191
Interest
96,055
95,600
95,091
94,524
93,891
Principal
3,939
4,394
4,903
5,470
6,103
Year
1
2
3
4
5
Rent
200,000
206,000
212,180
218,545
225,102
Vacancy & Collection loss
20,000
20,600
21,218
21,855
22,510
Effective Gross Income
180,000
185,400
190,962
196,691
202,592
Operating Expenses
63,000
64,890
66,837
68,842
70,907
NOI
117,000
120,510
124,125
127,849
131,685
Debt Service
99,994
99,994
99,994
99,994
99,994
Before-tax Cash Flow
17,006
20,516
24,131
27,855
31,691
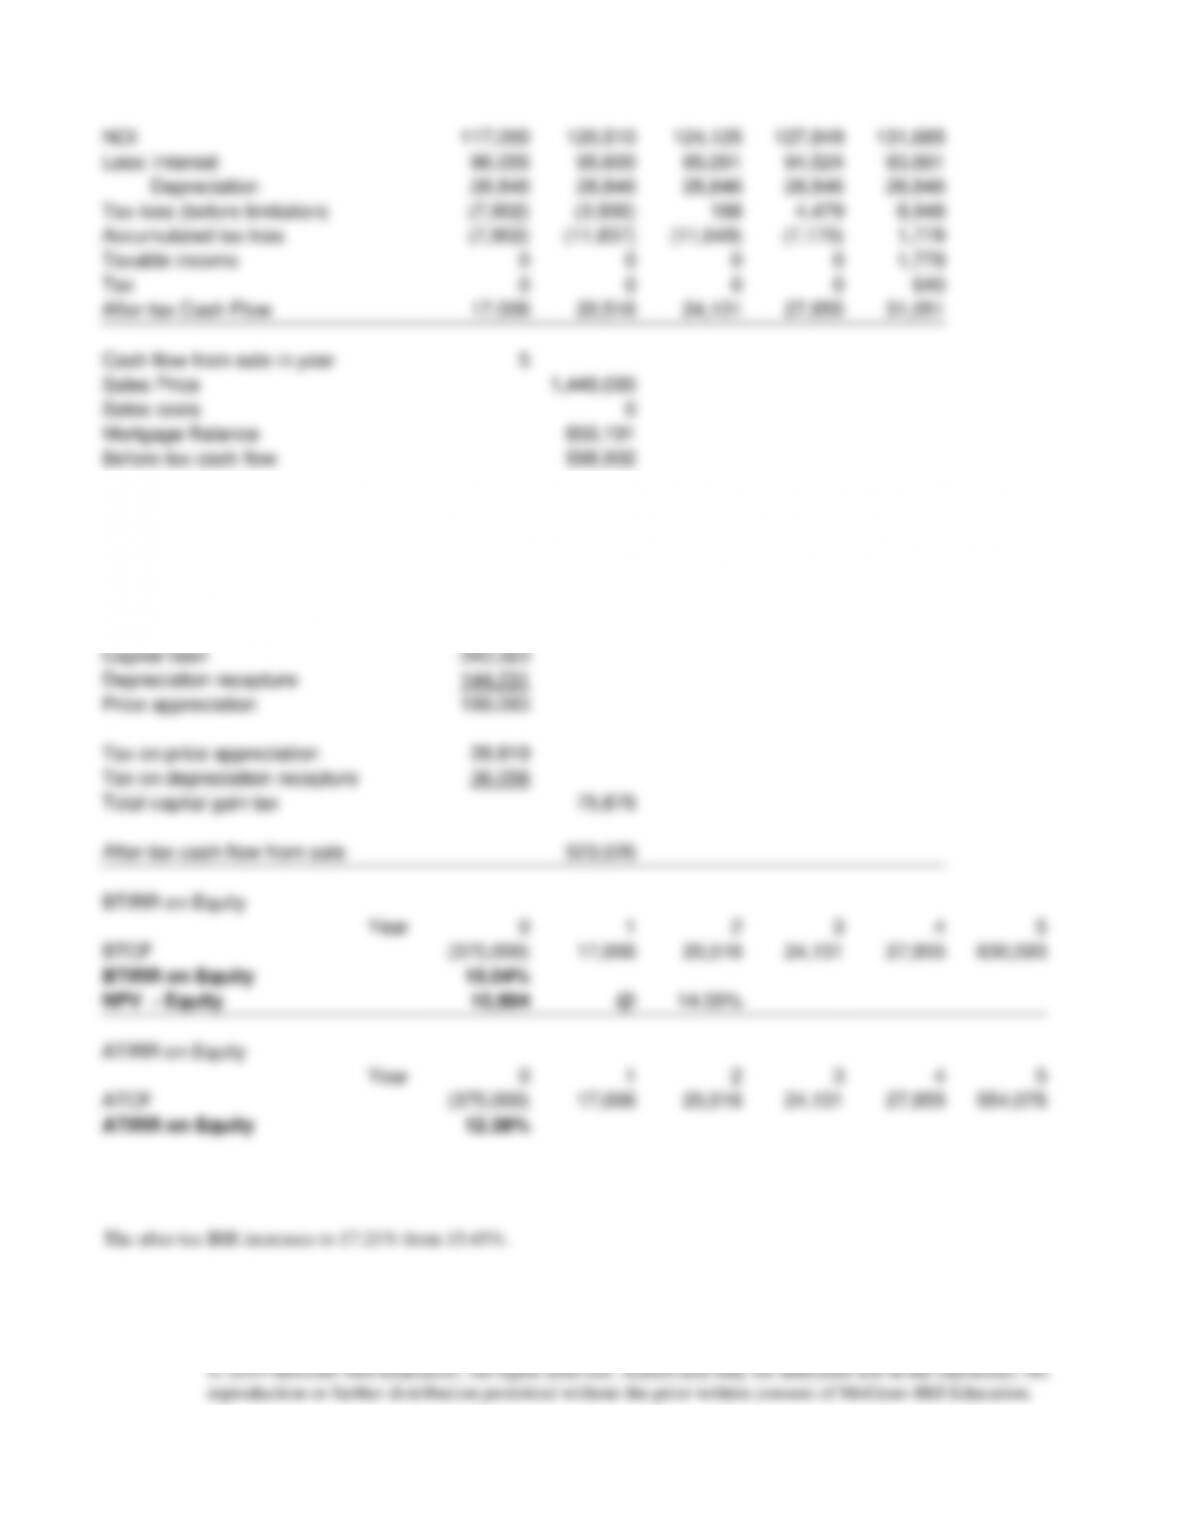
NOI
117,000
120,510
124,125
127,849
131,685
Less: Interest
96,055
95,600
95,091
94,524
93,891
Depreciation
28,846
28,846
28,846
28,846
28,846
Tax loss (before limitation)
(7,902)
(3,936)
188
4,479
8,948
Accumulated tax loss
(7,902)
(11,837)
(11,649)
(7,170)
1,778
Taxable income
0
0
0
0
1,778
Tax
0
0
0
0
640
After-tax Cash Flow
17,006
20,516
24,131
27,855
31,051
Cash flow from sale in year
5
Sales Price
1,449,093
Sales costs
0
Mortgage Balance
850,191
Before-tax cash flow
598,902
Original Cost Basis
1,250,000
Accumulated Depreciation
144,231
Adjusted Basis
1,105,769
Unused accumulated tax loss
0
Capital Gain
343,323
Depreciation recapture
144,231
Price appreciation
199,093
Tax on price appreciation
39,819
Tax on depreciation recapture
36,058
Total capital gain tax
75,876
After-tax cash flow from sale
523,026
BTIRR on Equity
Year
0
1
2
3
4
5
BTCF
(375,000)
17,006
20,516
24,131
27,855
630,593
BTIRR on Equity
15.04%
NPV – Equity
15,994
@
14.00%
ATIRR on Equity
Year
0
1
2
3
4
5
ATCF
(375,000)
17,006
20,516
24,131
27,855
554,076
ATIRR on Equity
12.38%
PROBLEM 11-4
PROBLEM 11-5
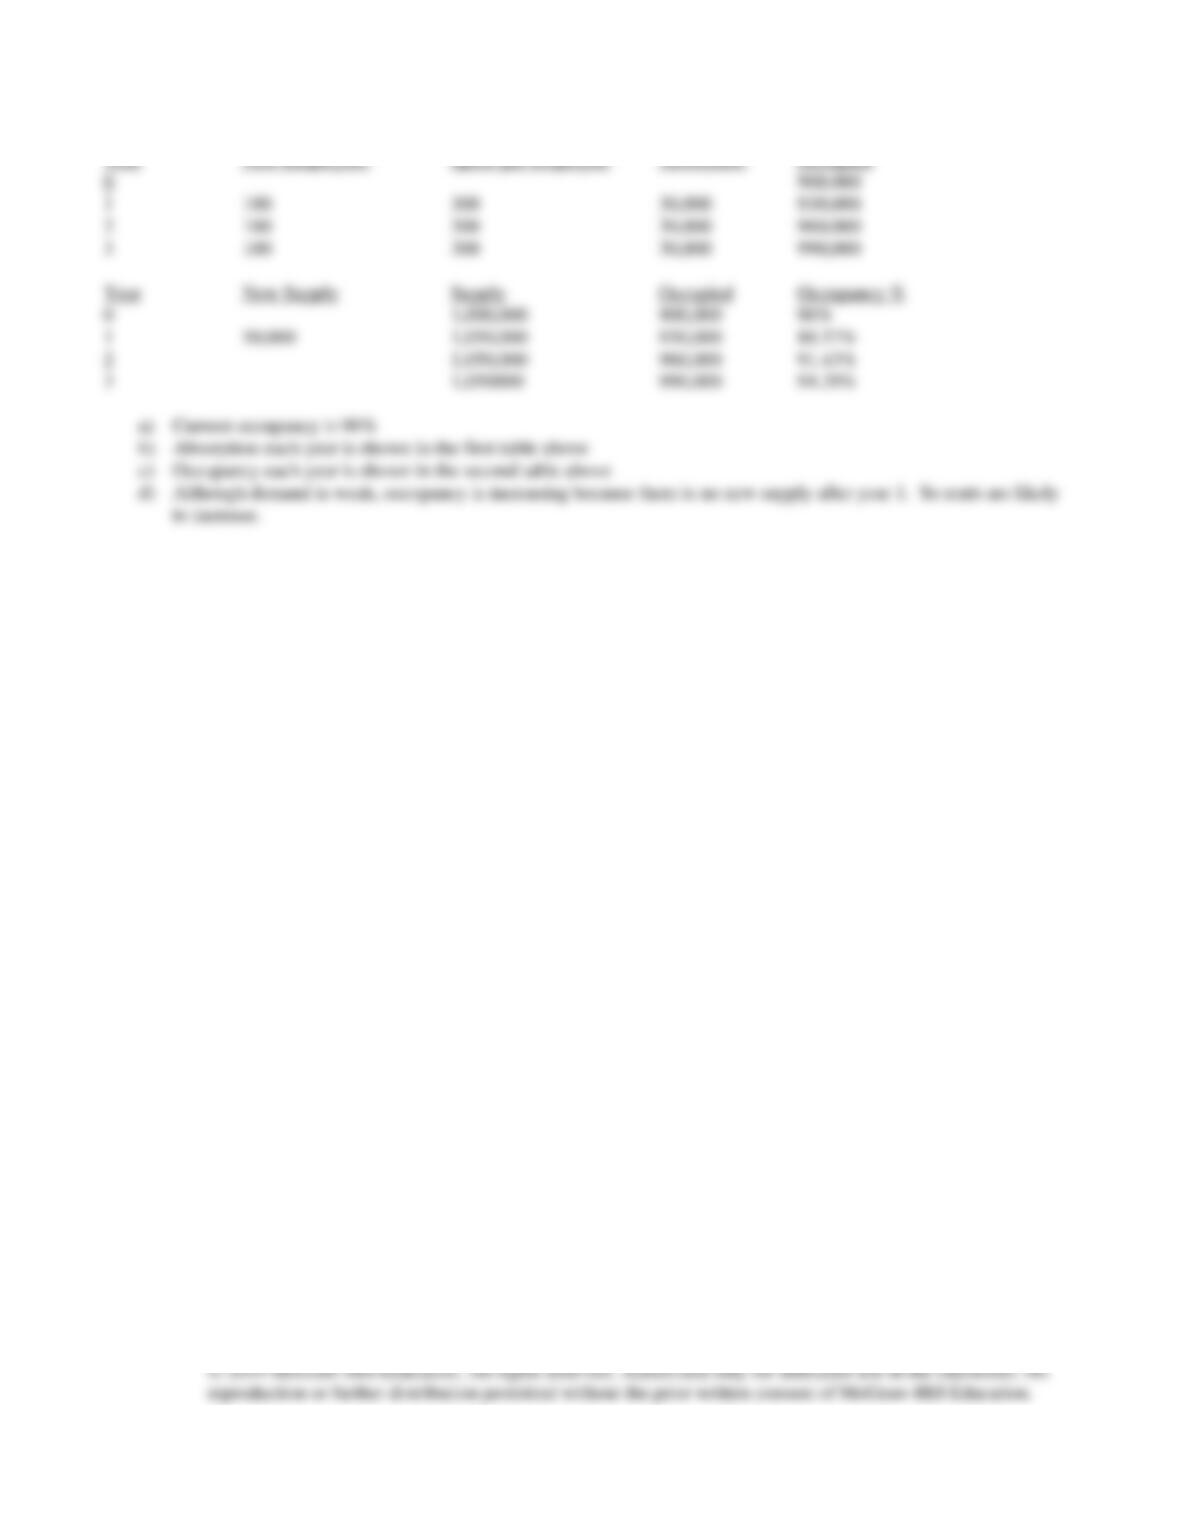
Year New Employees Space per Employee Absorption Occupied