
Chapter 10 – Analysis of Government Financial Performance
10-1
CHAPTER 10: ANALYSIS OF GOVERNMENT FINANCIAL
PERFORMANCE
OUTLINE
Number
Topic
Type/Task
Status
(re: 17/e)
Questions:
10-1
Economic condition
Identify, define
10-2
10-2
Financial Trend Monitoring System
Define, explain
New
10-3
Financial condition
Identify, explain
Same
10-4
Financial Trend Monitoring System and
citizens
Identify, explain
Same
10-5
Economic condition and ratio analysis
Explain, relate
Same
10-6
Organizational factors in the FTMS
Explain
Same
10-7
Pension plan funding
Explain
Same
10-8
Financial position
Explain, relate
Same
10-9
Electronic Municipal Market Access
Define, explain
Same
10-10
Benchmarking
Explain
New
10-11
Credit rating agencies
Identify, explain
10-10
Cases:
10-12
Electronic Municipal Market Access
Research
10-11 revised
10-13
Financial analysis
Analyze
10-12 revised
10-14
Financial analysis
Analyze
New
10-15
Financial trends
Analyze
10-4
Exercises/Problems:
10-16
Examine the CAFR
Analyze
10-15
10-17
Various
Multiple Choice
10-16, 10-14
new
10-18
Financial condition
Matching
10-17
10-19
Benchmarks
Evaluate
10-18
10-20
Financial analysis
Analyze
New
10-21
City of Arborland financial ratios
Calculate
10-20
Chapter 10 – Analysis of Government Financial Performance
10-2
CHAPTER 10: EVALUATION OF GOVERNMENT FINANCIAL
PERFORMANCE
Answers to Questions
10-1. The GASB identifies economic condition as a composite measure that comprises three
General Problem Information: Economic condition
Learning Objective: 10-2
Topic: Government Financial Reporting Concepts
Bloom’s Taxonomy: Remember
Accreditation Skills tag: AACSB: Communication, AICPA: BB Industry
Level of Difficulty: Easy
General Problem Information: Financial Trend Monitoring System
Learning Objective: 10-3
Topic: Internal Financial Trend Monitoring
Bloom’s Taxonomy: Remember
Accreditation Skills tag: AACSB: Communication, AICPA: BB Industry
Level of Difficulty: Easy
10-3. The four types of solvency the ICMA describes are: cash solvency, budgetary solvency,
long-run solvency, and service-level solvency. If a government does not have cash
Chapter 10 – Analysis of Government Financial Performance
10-3
Ch. 10, Answers, Question 10-3 (Cont’d)
General Problem Information: Financial condition
Learning Objective: 10-2
Topic: Government Financial Reporting Concepts
Bloom’s Taxonomy: Understand
Accreditation Skills tag: AACSB: Communication, AICPA: BB Industry
Level of Difficulty: Medium
10-4. As part of community needs and resources in Illustration 10-1 of the chapter several
citizen characteristics are identified that can impact the government’s financial condition.
General Problem Information: Financial Trend Monitoring System and citizens
Learning Objective: 10-3
Topic: Internal Financial Trend Monitoring
Bloom’s Taxonomy: Understand
Accreditation Skills tag: AACSB: Communication, AICPA: BB Industry
Level of Difficulty: Medium
10-5. Ratios constructed from governmental fund financial statement information would reflect
the modified accrual basis of accounting. Modified accrual focuses on the current sources
General Problem Information: Economic condition and ratio analysis
Learning Objective: 10-4
Topic: Analyzing Government Financial Statements
Bloom’s Taxonomy: Understand
Chapter 10 – Analysis of Government Financial Performance
10-4
Ch. 10, Answers, Question 10-5 (Cont’d)
Accreditation Skills tag: AACSB: Communication, AICPA: BB Reporting
Level of Difficulty: Easy
10-6. Organizational factors, such as management practices and legislative policies, play a
crucial role in determining fiscal policy. If sound management policies are in place, then
General Problem Information: Organizational factors in the FTMS
Learning Objective: 10-3
Topic: Internal Financial Trend Monitoring
Bloom’s Taxonomy: Understand
Accreditation Skills tag: AACSB: Communication, AICPA: BB Industry
Level of Difficulty: Medium
10-7. Yes, citizens should consider a decrease in the ratio of the fiduciary net position to total
pension liability from year to year to be a warning sign. Generally accepted accounting
principles require display and disclosure of pension information, but do not prescribe the
General Problem Information: Pension plan funding
Learning Objective: 10-4
Topic: Internal Financial Trend Monitoring
Bloom’s Taxonomy: Understand
Accreditation Skills tag: AACSB: Communication, AICPA: FN Reporting
Level of Difficulty: Medium
10-8. The GASB defines financial position as the status of the government’s assets, deferred
outflows, liabilities, deferred inflows of resources, and net position, which are all
displayed on the balance sheet and/or the statement of net position. Thus, all of the ratios
Chapter 10 – Analysis of Government Financial Performance
10-5
Ch. 10, Answers, Question 10-8 (Cont’d)
General Problem Information: Financial position
Learning Objective: 10-4
Topic: Analyzing Government Financial Statements
Bloom’s Taxonomy: Understand
Accreditation Skills tag: AACSB: Communication, AICPA: FN Reporting
Level of Difficulty: Medium
10-9. EMMA is the Electronic Municipal Market Access, which is operated by the Municipal
Securities Rulemaking Board. EMMA is a free online service that is available to
investors or other users who are interested in learning more about the municipal securities
General Problem Information: Electronic Municipal Market Access
Learning Objective: 10-5
Topic: Use of Benchmarks to Aid Interpretation
Bloom’s Taxonomy: Understand
Accreditation Skills tag: AACSB: Communication, AICPA: BB Industry
Level of Difficulty: Medium
10-10. The most common type of benchmarking in government is the comparison over time of
the government to itself. According to the Government Finance Officers’ Association a
Learning Objective: 10-5
Topic: Use of Benchmarks to Aid Interpretation
Bloom’s Taxonomy: Understand
Accreditation Skills tag: AACSB: Communication, AICPA: BB Industry
Level of Difficulty: Easy
Chapter 10 – Analysis of Government Financial Performance
10-6
Ch. 10, Answers (Cont’d)
10-11. Municipal bond rating agencies each have established criteria to conduct a bond rating
analysis. Although there is some difference in the criteria, they all give considerable
weight to the economy. Other factors that are common in the rating process are
management, debt, and some aspect of finance (this could include liquidity, budget, and
General Problem Information: Credit rating agencies
Learning Objective: 10-5
Topic: Use of Benchmarks to Aid Interpretation
Bloom’s Taxonomy: Understand
Accreditation Skills tag: AACSB: Communication, AICPA: BB Industry
Level of Difficulty: Medium
Solutions to Cases
10-12.
a. 1. According to the information provided on EMMA, an official statement is issued by
state and local governments in connection with a new bond issue. It provides a
2. Three factors provided in the MSRB’s “Evaluating a Municipal Bond’s Default Risk”
document that should be considered when assessing default risk are:
b. The answers for questions 1–4 will vary widely, depending on the municipality selected
Chapter 10 – Analysis of Government Financial Performance
10-7
Ch. 10, Solutions, Case 10-12 (Cont’d)
General Problem Information: Electronic Municipal Market Access
Learning Objective: 10-5
Topic: Use of Benchmarks to Aid Interpretation
Bloom’s Taxonomy: Understand
Accreditation Skills tag: AACSB: Knowledge Application, AICPA: FN Leveraging
Technology
Level of Difficulty: Medium
10-13.
a. Following is a narrative of some of the indicators that students may address. However,
the indicators are not exhaustive and students may include additional information.
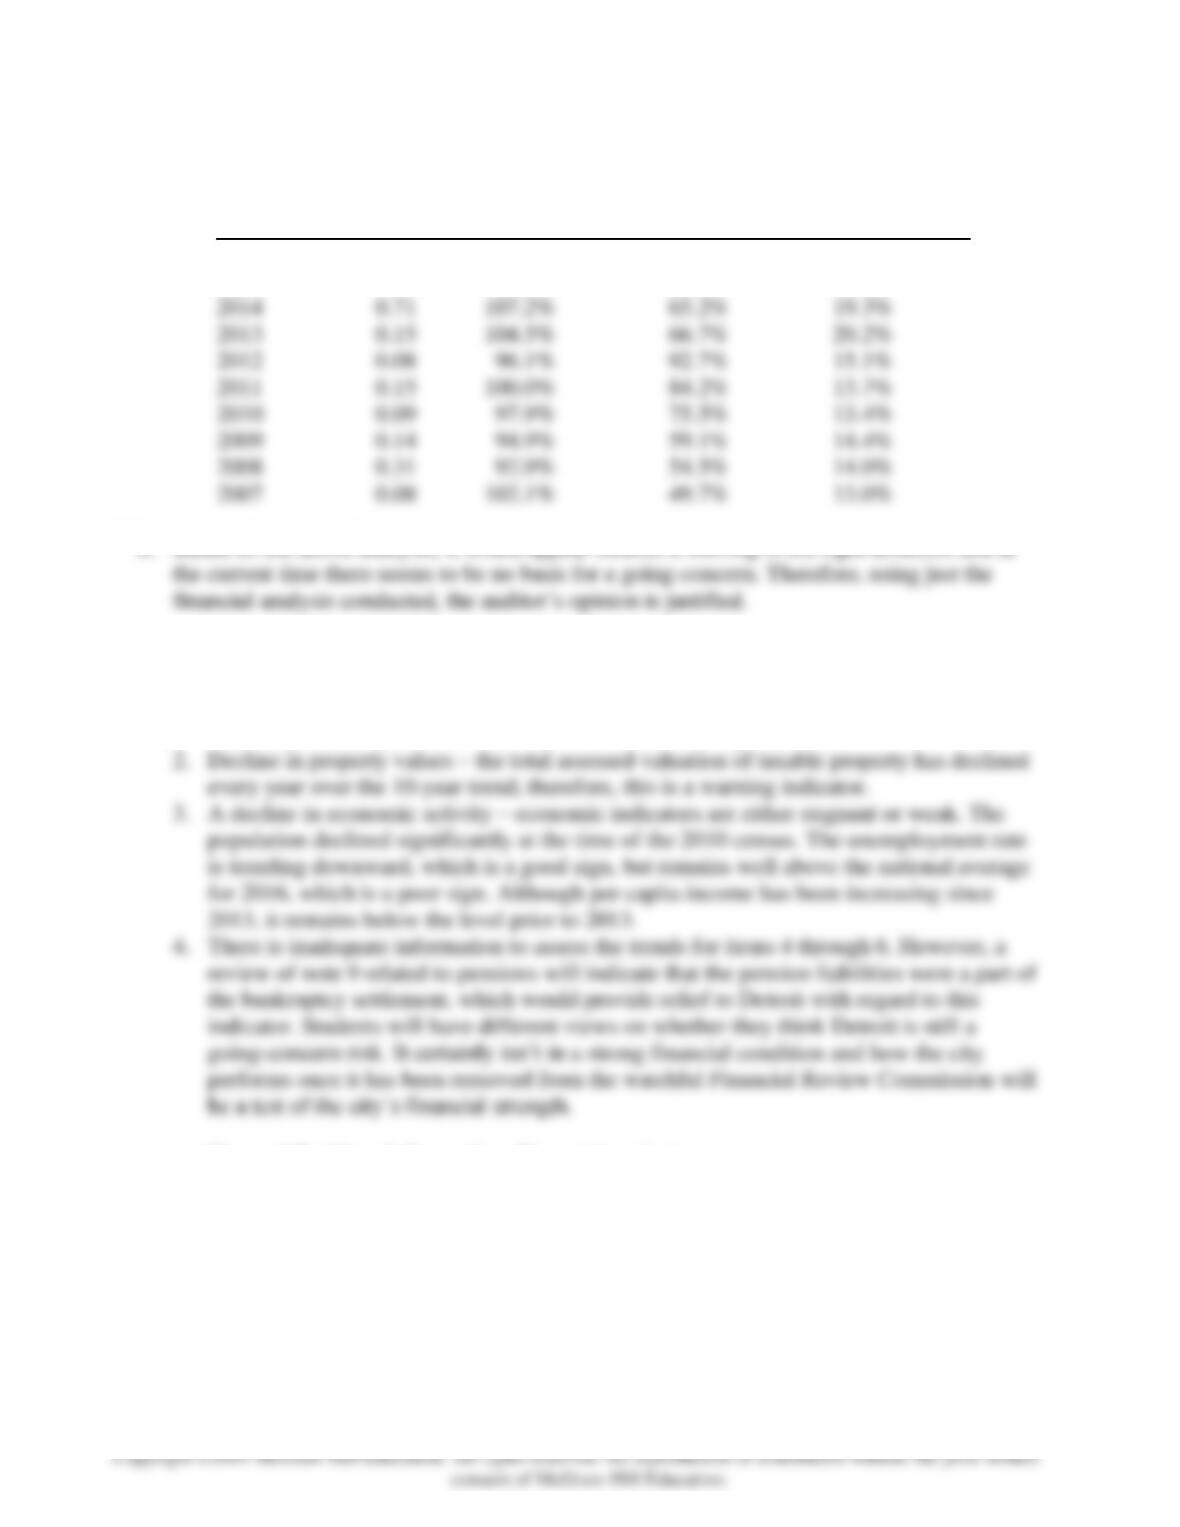
As the table below indicates since bankruptcy was declared in 2014, and Detroit received
financial relief, financial indicators have started to improve. Liquidity is now over the
Chapter 10 – Analysis of Government Financial Performance
10-8
Ch. 10, Solutions, Case 10-13 (Cont’d)
Year Liquidity Revenues over Debt Limit Debt Service
Expenditures Used
2016 1.73 118.1% 34.5% 13.5%
2015 1.70 91.5% 56.9% 18.3%
b. Based on the above analysis, it would appear Detroit is moving in the right direction and at
c. Based on the information provided and in response to the warning indicators the following is
provided:
1. Decline or inadequate growth in revenues relative to expenses – there is not a decline
over the past four years and therefore this is not a warning indicator.
Learning Objective: 10-3, 10-4
Topic: Use of Benchmarks to Aid Interpretation
Bloom’s Taxonomy: Analyze
Accreditation Skills tag: AACSB: Analytical Thinking, AICPA: BB Critical Thinking
Level of Difficulty: Hard
10-9
Copyright ©2019 McGraw-Hill Education. All rights reserved. No reproduction or distribution without the prior written
consent of McGraw-Hill Education.
Ch. 10, Solutions (Cont’d)
10-14.
a.
1. Governmental fund revenues have been fairly stagnant over the past four years ranging in the area
of $62 billion to $65 billion. This is up from the first four years of the 10-year trend when
revenues were stagnant at around $50 billion. As can be seen, given the size of revenue amounts,
there has not been much growth over the 10-year period.
b. Student answers may differ on this, but none of the indicators listed in part a are particularly
strong. Revenue growth and expenditure growth are stagnant, with expenditures continuing
General Problem Information: Financial analysis
Learning Objective: 10-4, 10-5
Topic: Use of Benchmarks to Aid Interpretation
Bloom’s Taxonomy: Analyze
Accreditation Skills tag: AACSB: Analytical Thinking, AICPA: BB Critical Thinking
Level of Difficulty: Hard
Chapter 10 – Analysis of Government Financial Performance
10-10
Ch. 10, Solutions (Cont’d)
10-15.
a. The solution to this case will depend on which year’s Financial Trends report each
student obtains. In the 2016 report, the following indicators are labeled as “negative”
b. Students will, of course, formulate different questions; however, you should expect them
to address the negative indicators identified in part a. For example: What is driving the
revenue problems? Is anything being done to counteract the situation? Is the revenue in
General Problem Information: Financial trends
Learning Objective: 10-3, 10-4
Topic: Internal Financial Trend Monitoring
Bloom’s Taxonomy: Analyze
Accreditation Skills tag: AACSB: Analytical Thinking, AICPA: BB Critical Thinking
Level of Difficulty: Hard
Solutions to Exercises and Problems
10-16. The specific solution to this exercise will depend on which city’s CAFR is evaluated.
Generally, the analysis for each ratio should follow the approach shown in Illustrations

Chapter 10 – Analysis of Government Financial Performance
10-11
Ch. 10, Solutions Exercise 10-16 (Cont’d)
General Problem Information: Examine the CAFR
Learning Objective: 10-3, 10-4
Topic: Use of Benchmarks to Aid Interpretation
Bloom’s Taxonomy: Analyze
Accreditation Skills tag: AACSB: Analytical Thinking, AICPA: FN Measurement and
Reporting
Level of Difficulty: Hard
10-17. 1. b. 6. b. 11. c.
General Problem Information: Various
Learning Objective: 10-1, 10-2, 10-3, 10-5
Topic: Various Chapter Topics
Bloom’s Taxonomy: Understand
Accreditation Skills tag: AACSB: Knowledge Application, AICPA: BB Critical
Thinking
Level of Difficulty: Medium
10-18.
a. −
f. +
k. −
b. −
g. −
l. −
c. +
h. −
m. +
d. −
i. +
n. NE (see Note)
e. +
j. −
o. NE
Note: The effect of population growth on financial condition is indeterminate. Although
population growth normally leads to growth in the municipality’s tax base, it also
leads to growing demands for capital expenditures and social services.
General Problem Information: Financial condition
Learning Objective: 10-4
Topic: Internal Financial Trend Monitoring
Bloom’s Taxonomy: Understand
Accreditation Skills tag: AACSB: Knowledge Application AICPA: FN Measurement
Level of Difficulty: Medium
Chapter 10 – Analysis of Government Financial Performance
10-12
Ch. 10, Solutions (Cont’d)
10-19.
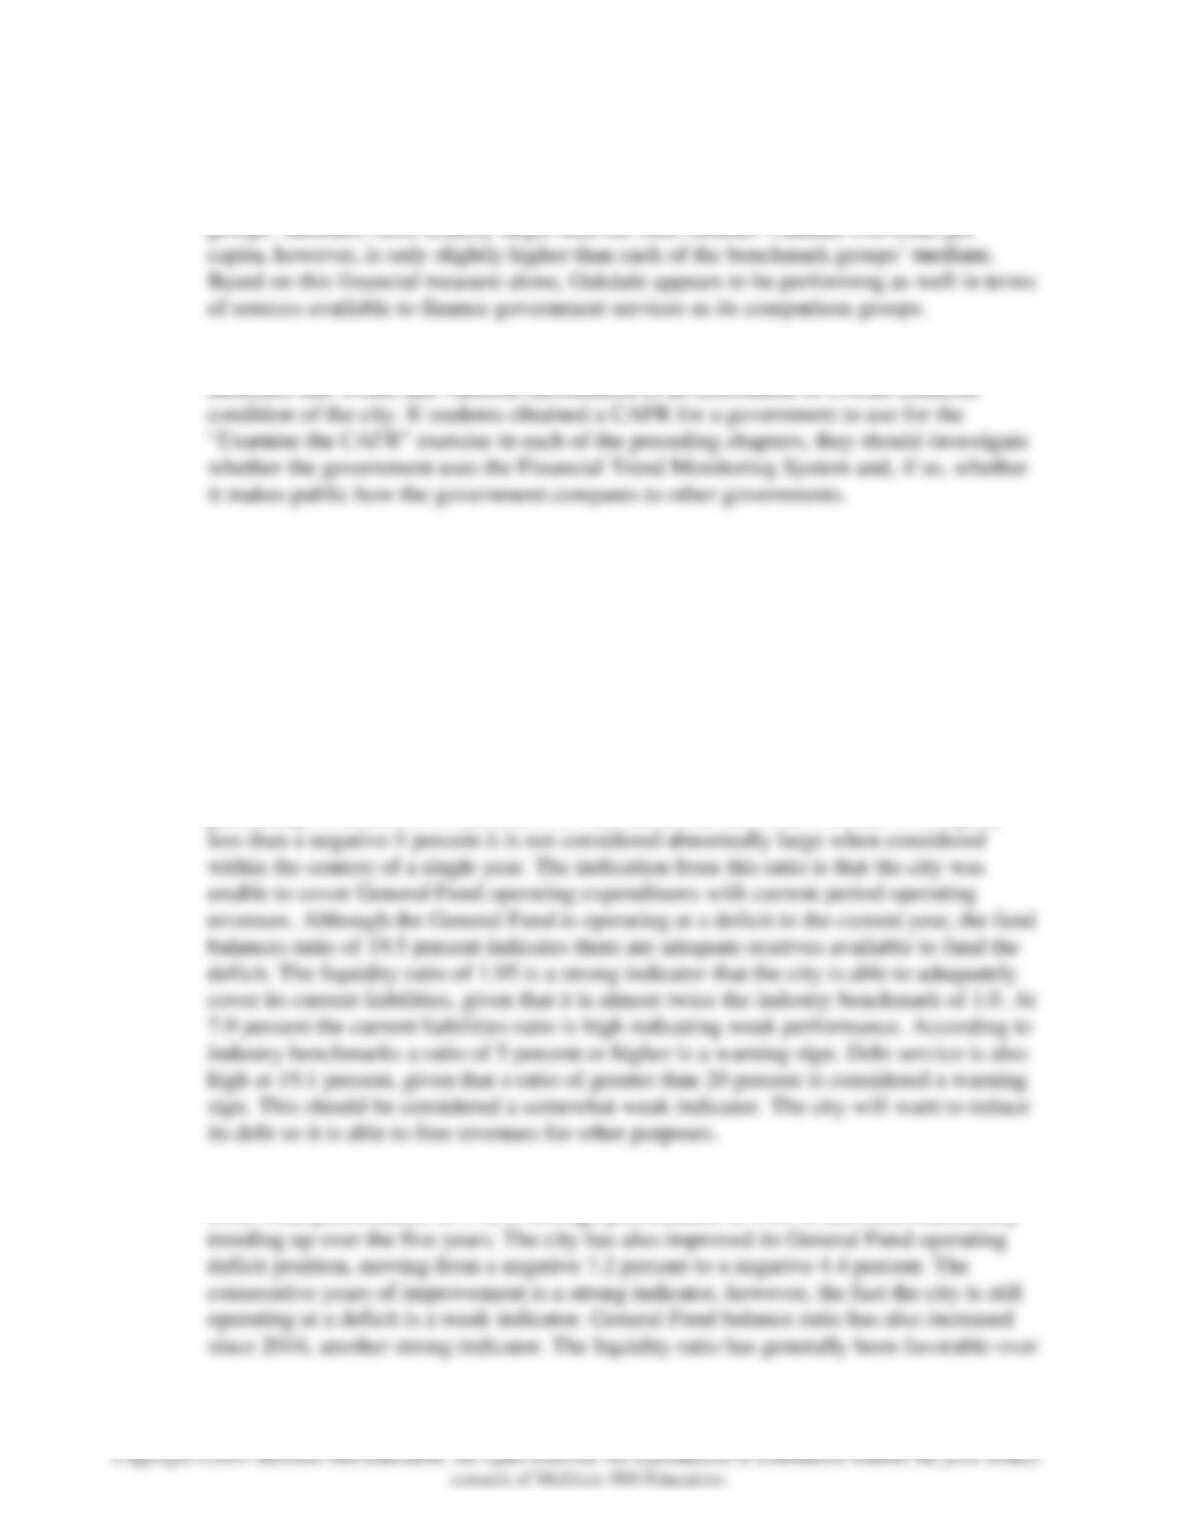
a. Here is a graphical presentation of the Town of Oakdale compared to three reference
FY Total Revenue
0
50,000,000
100,000,000
150,000,000
200,000,000
Oakdale
Aaa-Rated
Median
Comparison
RG Median
State Median
Comparison Groups
$ of Total Revenue
FY Revenue per Capita
0
500
1000
1500
2000
2500
3000
3500
Oakdale
Aaa-Rated
Median
Comparison
RG Median
State Median
Comparison Groups
$ of Revenue per Capita
Chapter 10 – Analysis of Government Financial Performance
10-13
Ch. 10, Solutions, Exercise 10-19 (Cont’d)
b. Oakdale has a much higher amount of total revenue for the fiscal year than its reference
groups’ medians, most notably larger than the state median. Oakdale’s revenue per
c. Students should refer to Illustrations 10-3 and 10-4 in the text for examples of other
measures that would add valuable information to an assessment of overall financial
General Problem Information: Financial trends
Learning Objective: 10-4, 10-5
Topic: Use of Benchmarks to Aid Interpretation
Bloom’s Taxonomy: Analyze
Accreditation Skills tag: AACSB: Analytical Thinking, AICPA: FN Decision Making
Level of Difficulty: Hard
10-20.
a. At 1.01 the total revenues over total expenditures ratio for 2020 indicates an average
position. The city is just covering its expenditures for the year with the revenues it is
generating. A deficit of 4.4 percent is a weak indicator; however, because it is slightly
b. Over the time period the city has improved its revenues over expenditures ratio, moving
from weak performance at 0.92 to average performance at 1.01. It has been consistently
Chapter 10 – Analysis of Government Financial Performance
10-14
Ch. 10, Solutions, Exercise 10-20 (Cont’d)
time with only one year where the ratio was less than the benchmark of 1.0. Thus, the
liquidity ratio should be viewed as strong. The current liabilities ratio has been high
d. Students will come up with several different answers to this question. However, some
General Problem Information: Financial analysis
Learning Objective: 10-3, 10-4
Topic: Analyzing Government Financial Statements
Bloom’s Taxonomy: Analyze
Accreditation Skills tag: AACSB: Analytical Thinking, AICPA: FN Decision Making
Level of Difficulty: Hard
10-21.
a. The performance measures shown in Illustration 10-4 use data from the basic financial
statements, which includes the government-wide financial statements as well as the fund
financial statements. The measures that can be calculated using the government-wide
financial statements presented in this case are:
1. Unrestricted net position
2. Capital asset condition
Chapter 10 – Analysis of Government Financial Performance
Ch. 10, Solutions, Exercise 10-21 (Cont’d)
b.
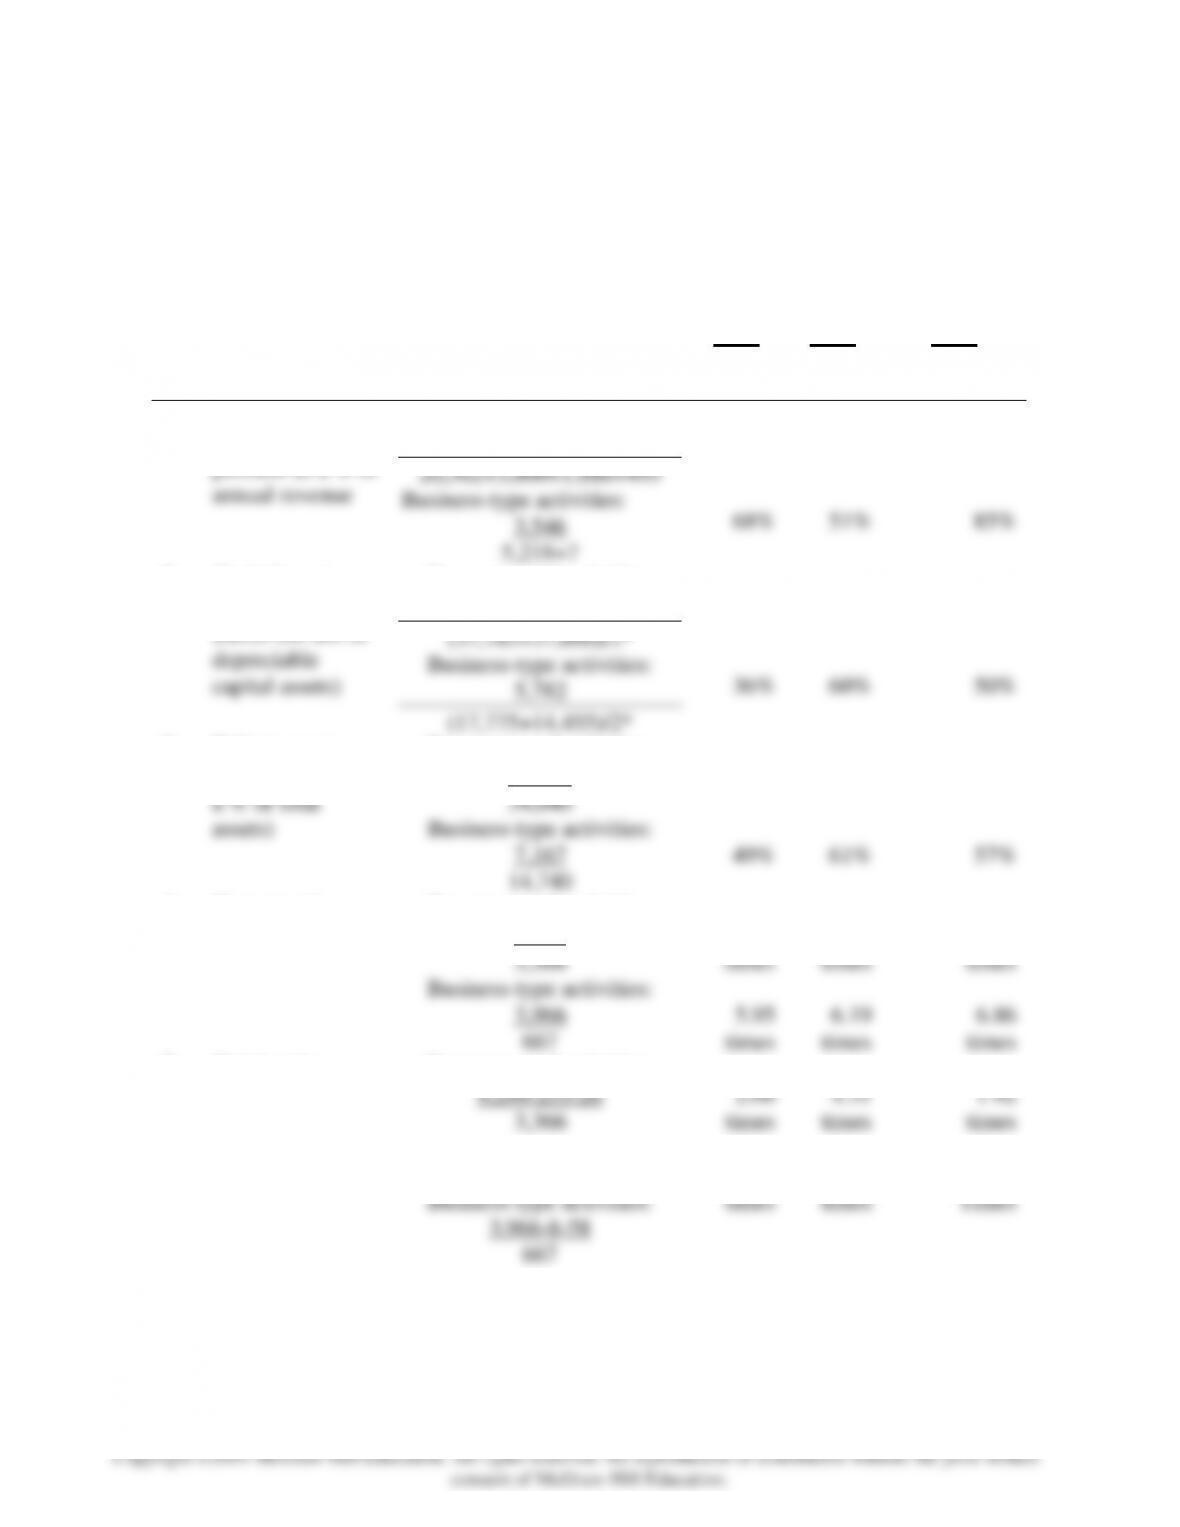
City of Arborland
Government-wide Financial Performance Measures
2020 Calculations
2020
2019
2018
(see Ill. 10-4 for definition
of ratios)
($ or % or number of times)
1.
Ending
unrestricted net
position as a % of
annual revenue
Governmental activities:
4,597
20,302+3,860+1,886+495
Business-type activities:
3,546
5,218+7
17%
68%
14%
51%
13%
85%
2.
Capital asset
condition (% of
useful life left in
depreciable
capital assets)
Governmental activities:
15,039
(37,183+37,600)/2*
Business-type activities:
5,782
(17,775+14,455)/2*
40%
36%
44%
60%
50%
50%
3.
Debt to assets
(total liabilities as
a % of total
assets)
Governmental activities:
19,266
34,040
Business-type activities:
7,167
14,740
57%
49%
61%
61%
68%
57%
4.
Current ratio
Governmental activities:
9,299
3,366
Business-type activities:
3,966
667
2.76
times
5.95
times
4.49
times
6.19
times
2.03
times
6.86
times
5.
Quick ratio
Governmental activities:
9,299-253-26
3,366
Business-type activities:
3,966-8-58
667
2.68
times
5.85
times
4.31
times
6.10
times
1.92
times
6.75
Times
Ch. 10, Solutions, Exercise 10-21 (Cont’d)
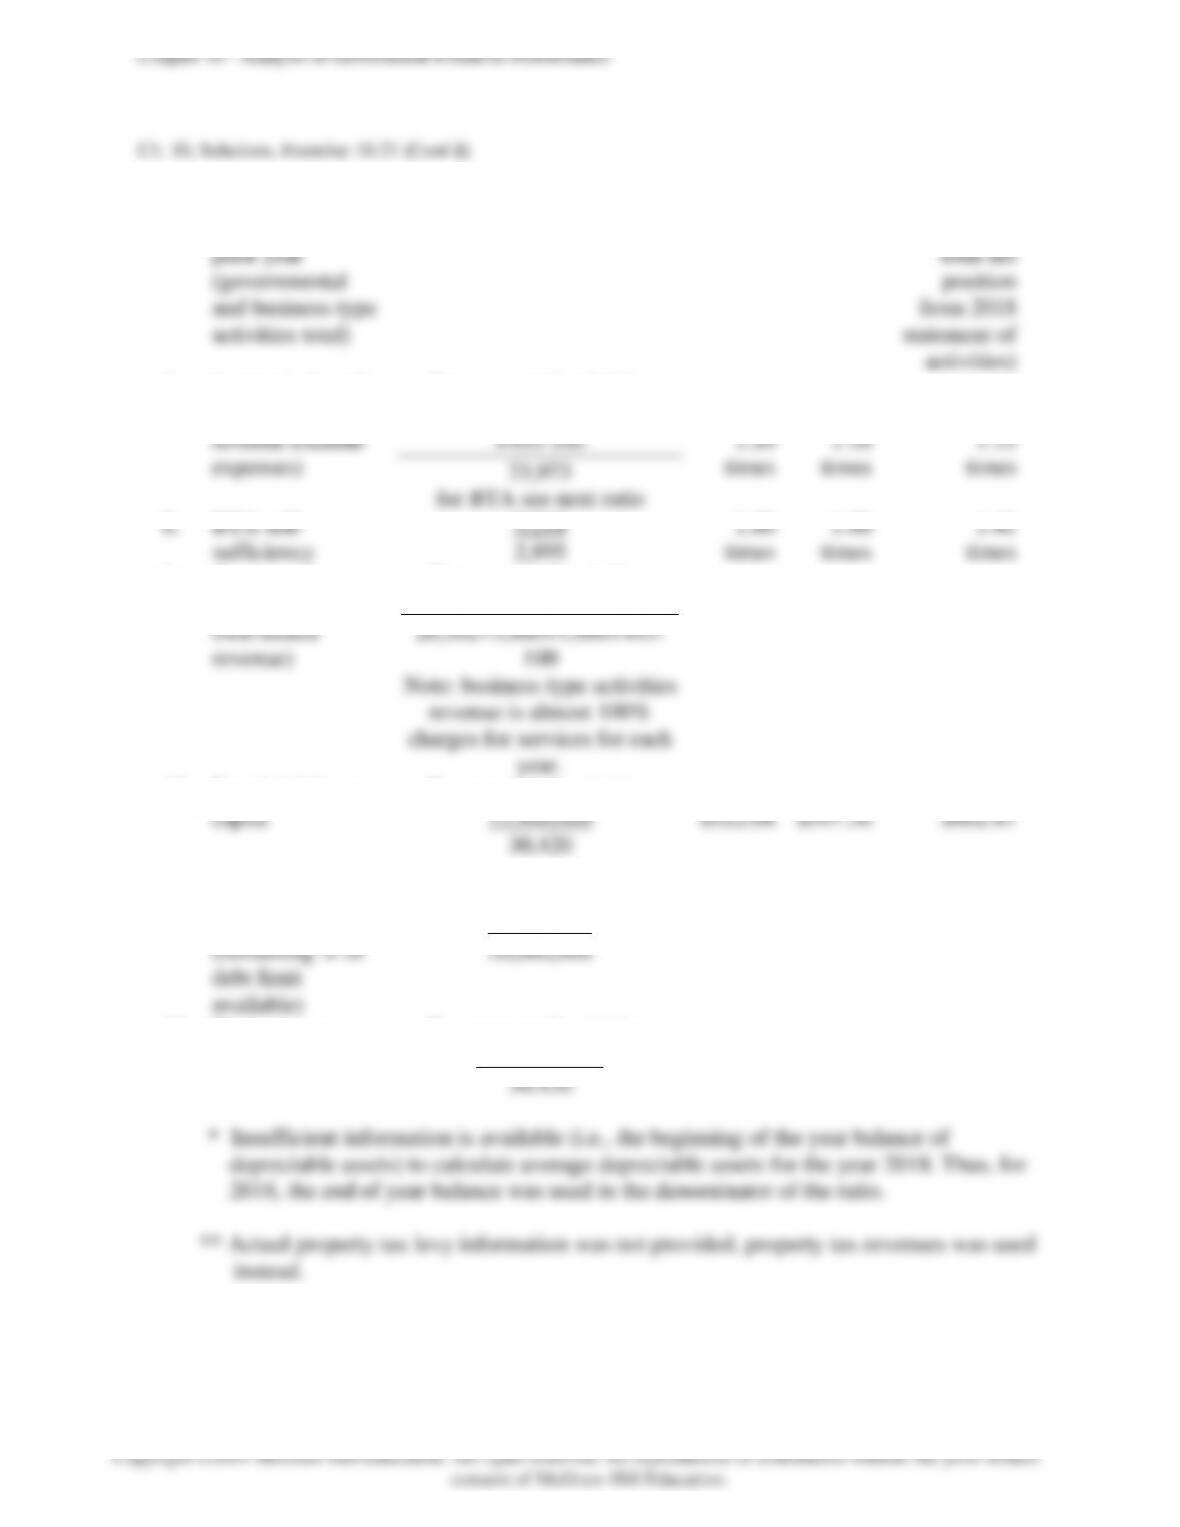
6.
Change in net
position from the
prior year
(governmental
and business-type
activities total)
22,347 – 17,447
$4,900
$3,220
$3,867
(change in
total net
position
from 2018
statement of
activities)
7.
Interperiod equity
(number of times
revenue exceeds
expenses)
Governmental activities:
20,302+3,860+1,886
+495-100
23,973
for BTA see next ratio
1.10
times
1.16
times
1.15
times
8.
BTA self-
sufficiency
5,218
2,895
1.80
times
1.00
times
1.41
times
9.
Revenue
dispersion (% of
own-source
revenue)
Governmental activities:
3,860+1,886+495+2,190+716
20,302+3,860+1,886+495–
100
Note: business-type activities
revenue is almost 100%
charges for services for each
year.
34.6%
37.7%
35.2%
10.
Bonded debt per
capita
Governmental activities:
15,900,000
30,420
$522.68
$597.36
$602.87
11.
Available legal
debt limit
(remaining % of
debt limit
available)
Governmental activities:
15,900,000
20,000,000
79.5%
84.5%
79.5%
12.
Property taxes
per capita
Governmental activities:
17,296,000**
30,420
$568.57
$481.39
$496.70

Chapter 10 – Analysis of Government Financial Performance
10-17
Ch. 10, Solutions, Exercise 10-21 (Cont’d)
c. The City of Arborland appears to be in strong financial condition based on the following