
2
POWERPOINT SLIDES 1–7
In this chapter, we take an analytical look at the defining goal of strategic management, gaining and sustaining competitive
advantage. To explain differences in competitive advantage, we must think hard about how to best measure it. We start by
introducing three standard dimensions used to study firm performance: (1) accounting, (2) shareholder value, and (3)
economic value creation. We apply them to competitive advantage and compare and contrast when it may be best to use each
type of measure. We then discuss two more holistic frameworks: (1) balanced scorecard and (2) triple bottom line. We
introduce diverse set of measures to capture the multifaceted nature of competitive advantage (refer students to Exhibit 5.10).
We then show how firm’s use business models to translate strategy into action.
Learning Objectives
LO 5-1 Conduct a firm profitability analysis using accounting data to assess and evaluate competitive
advantage.
LO 5-2 Apply shareholder value creation to assess and evaluate competitive advantage.
LO 5-3 Explain economic value creation and different sources of competitive advantage.
LO 5-4 Apply a balanced scorecard to assess and evaluate competitive advantage.
LO 5.5 Apply a triple bottom line to assess and evaluate competitive advantage.
LO 5-6 Outline how business models put strategy into action.
Strategic Management 3
e
Instructor Manual
Extended Discussion
You can extend the discussion of the opening case by asking each team of students to compare Apple’s performance to
another competitor in a different industry in which it competes, such as Samsung, Google, Pandora, or Amazon. This
might be useful if you plan to use this as a graded assignment and want to minimize the opportunity for sharing answers
across teams. Here are some sample questions and answers for comparing Apple to Blackberry in the mobile phone
industry in 2013 when Blackberry was struggling to develop an answer to market share lost to Apple and Android
phones. Using this time point of critical decision making for Blackberry sharply illustrates the learning objective and
also offers the opportunity for a follow–up assessment of how the firm’s strategies are currently working. You might
want to use a selection of questions from the above chapter case questions and the questions below for each team’s
assignment.
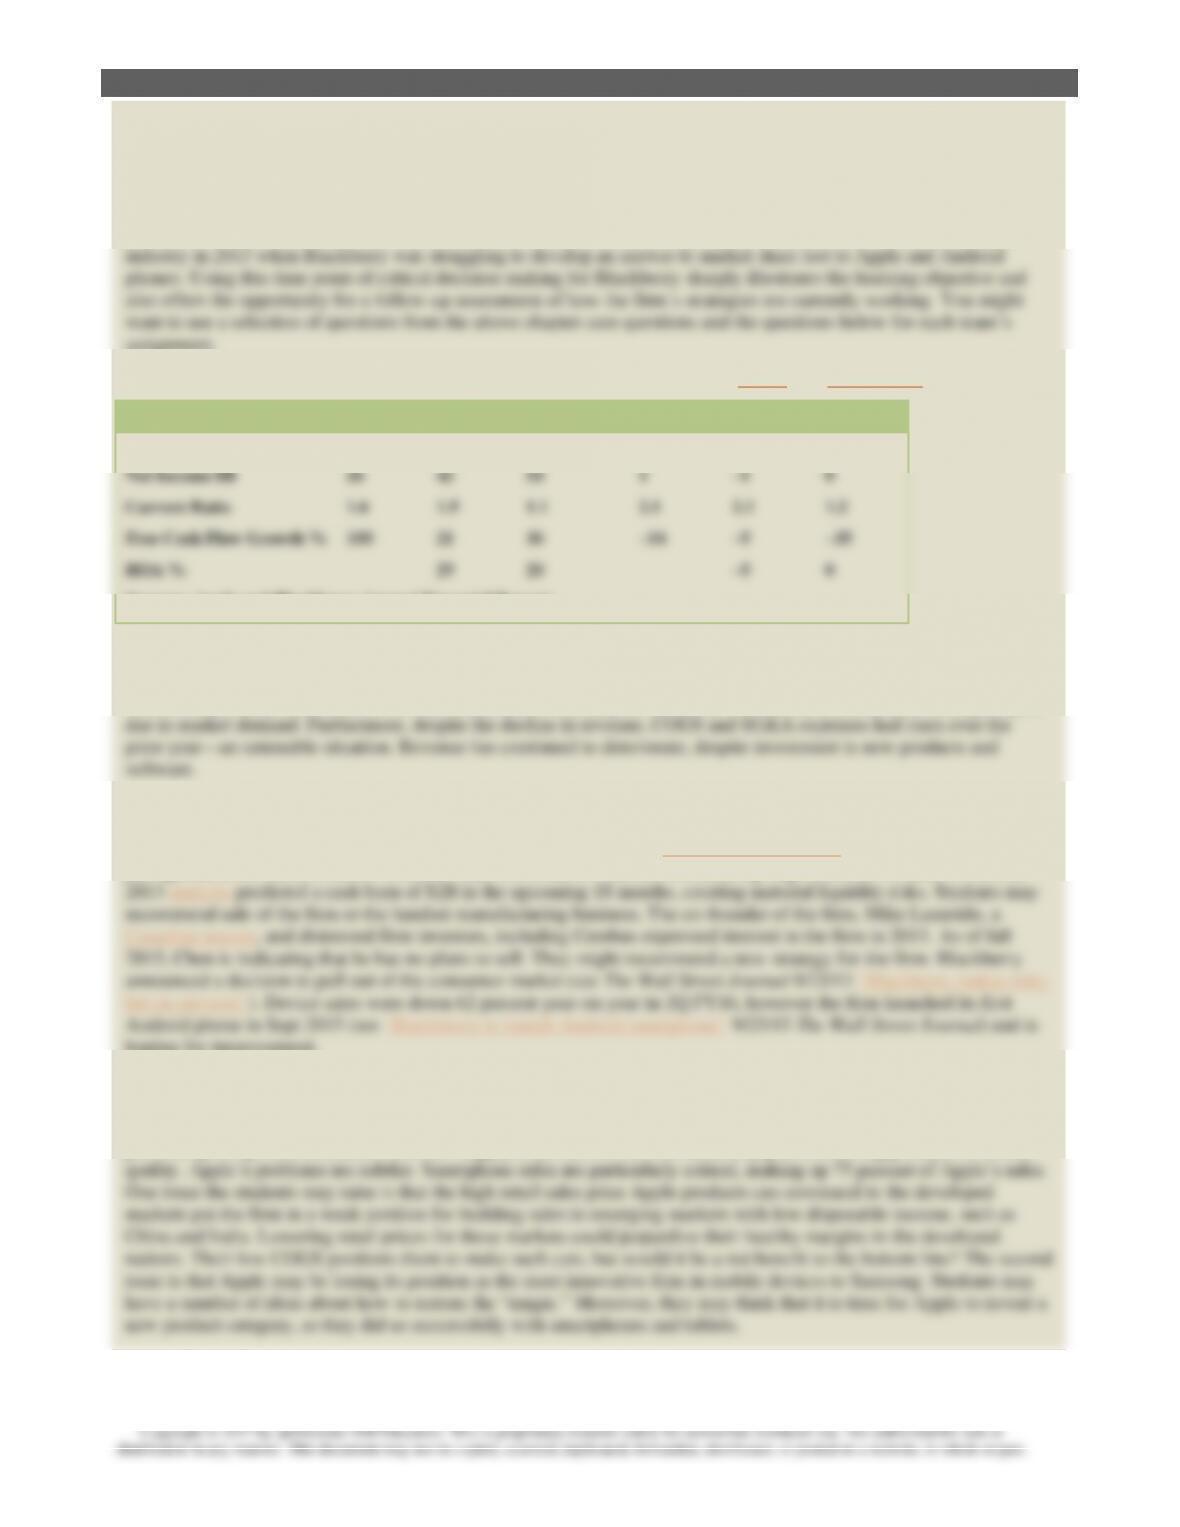
Calculate some key profitability, leverage, liquidity, and market ratios for Apple and BlackBerry over time.
AAPL 11
AAPL 12
AAPL FY15
BB FY 12
BB FY 13
BB FY 14
Revenue $B
108
156
234
18
11
3.3
Net Income $B
26
42
53
1
–1
0
Current Ratio
1.6
1.5
1.1
2.1
2.1
1.2
Free Cash Flow Growth %
100
21
36
–34
–5
–35
ROA %
29
20
–5
0
Sources: Apple and Blackberry Annual Financial Reports
Conduct a dynamic firm profitability analysis over time. Also chart market capitalization over time as in Exhibit
5.3. Can you find signs of performance differentials between these two firms that may have indicated problems
at BlackBerry? When did BlackBerry’s performance problems become apparent? The handwriting was on the
wall for Blackberry when their FY 2012 (March 2011–February 2012) results showed a decline in sales during a rapid
rise in market demand. Furthermore, despite the decline in revenue, COGS and SG&A expenses had risen over the
prior year—an untenable situation. Revenue has continued to deteriorate, despite investment in new products and
software.
Make a recommendation to the CEO of BlackBerry, Thorsten Heins in 2013 or John Chen in 2015, about actions
he could take to improve firm performance. Students may recommend further staff reductions. They may
recommend cutting back on non-core initiatives. Blackberry closed a “Center of Excellence” in October 2013 that had
just opened a few months earlier. Students may recommend financial restructuring steps to conserve cash. In October
2013 analysts predicted a cash burn of $2B in the upcoming 18 months, creating material liquidity risks. Students may
2015, Chen is indicating that he has no plans to sell. They might recommend a new strategy for the firm. Blackberry
announced a decision to pull out of the consumer market (see The Wall Street Journal 9/22/13 “Blackberry makes risky
bet on services”). Device sales were down 62 percent year-on-year in 2Q FY16, however the firm launched its first
Android phone in Sept 2015 (see “Blackberry to launch Android smartphone” 9/25/15 The Wall Street Journal) and is
hoping for improvement.
markets put the firm in a weak position for building sales in emerging markets with low disposable income, such as
China and India. Lowering retail prices for those markets could jeopardize their healthy margins in the developed
nations. Their low COGS positions them to make such cuts, but would it be a net benefit to the bottom line? The second
issue is that Apple may be losing its position as the most innovative firm in mobile devices to Samsung. Students may
have a number of ideas about how to restore the “magic.” Moreover, they may think that it is time for Apple to invent a
new product category, as they did so successfully with smartphones and tablets.

Strategic Management 3
e
Instructor Manual
5.1 Competitive Advantage and Firm Performance
LO 5–1
POWERPOINT SLIDES 8–10
STRATEGY SMART VIDEO LECTURE
POWERPOINT SLIDE 61
The brief video in this slide describes how to calculate return on investment. It can be assigned before class to ensure that
everyone remembers the calculation procedure before discussing the implications of the results in class.
EXAMPLES
POWERPOINT SLIDE 9
NEWER FACULTY: Competitive advantage must always be considered relative to some benchmark. The actual measures to
use are the subject of much debate in both academia and the business environment. Accounting measures are commonly used
to compare firms, particularly public companies, since the government reporting requirements assures a fair amount of
standardized information is available for analysis. Exhibit 5.1 illustrates both the calculation and comparison of ROIC for
Apple and Microsoft, but also illustrates how to break that calculation down to provide clues as to the sources of competitive
advantage. Toward the end of the textbook, a section called “How to Conduct a Case Analysis” includes a table with a
complete presentation of accounting measures (profitability, activity, leverage, liquidity, and market measures), how they are
calculated, and their benefits and shortcomings. The students should find these useful when working through the Strategy
Term Project or analyzing different case studies and business situations. AACSB 2015 Standard 9 Financial theories,
analysis, reporting, and markets
EXPERIENCED FACULTY: Consider Google versus Microsoft, which are becoming more direct competitors. Which of the
two has the competitive advantage in terms of accounting profitability? Microsoft is larger than Alphabet Inc (Google), with
revenues of $95B versus 64B. However, Microsoft’s profitability has declined in recent years; income for Microsoft in FY
2015 was $12.2B versus $13.9B in 2014 for Google. Microsoft’s free cash flow was greater at $23.1B than Google’s $11.4B.
Microsoft had a lower ROA (7.0 versus 11.5) and ROE (14.4 versus 14.5). Thus, we can conclude that Google held a
INTEGRATION
Financial Ratio Review: Profitability Ratios
Connect offers an opportunity for students to try their hand at re-creating Exhibit 5.1 using updated financials. This hands
on comparison between Apple and Microsoft can help students gain more confidence with strategic financial analysis.
The activity can be found at the end of the chapter lists on the “add a question” source selection inside Connect. Choose
“financial ratio review” and then look for “Calculating and Comparing ROIC—Apple versus Microsoft.” The activity
will be inside the Profitability Ratios section.
Difficulty: Medium Blooms: Apply AACSB: Analytic
Follow-Up Activity: The instructor can make available other assignments inside the financial ratio review for students
who would like some refresher examples on the calculation of a variety of ratios. The exercises have been hand selected
from McGraw-Hill accounting resources to match with ratio discussions in this chapter of the Rothaermel text.
Strategic Management 3
e
Instructor Manual
6
END OF CHAPTER ETHICAL/SOCIAL ISSUES 2 AND 3
The chapter mentions that accounting data do not consider off–balance sheet items. A retailer that owns its stores will
list the value of that property as an asset, for example, while a firm that leases its stores will not. What are some of the
accounting and shareholder advantages of leasing compared to owning retail locations?
As mentioned, the leasing of a facility is considered an off–balance sheet item. Therefore, when comparing such accounting
ratios as return on assets (net income/total assets) a firm that leases will have a higher ROA than a firm who owns its own
How do the perspectives on competitive advantage differ when comparing brick-and-mortar stores to online
businesses (e.g., Best Buy versus Amazon, Barnes & Noble versus Amazon, The Gap versus Threadless—noted in
Strategy Highlight 1.1—Nordstrom versus Zappos, and so on)? Make recommendations to brick-and-mortar stores as
to how they can compete more effectively with online firms. What conclusions do you draw?
Online stores have a big advantage over brick-and-mortar stores in the accounting of assets because they have fewer tangible
assets. For instance, most online companies keep their inventories in a handful of large distribution centers and ship products
DISCUSSION TOPICS
Invite accounting students to lead a discussion of the ethical implications of moving project financing, pensions, 49 percent
owned joint ventures, and other assets, liabilities or cash flows off balance sheet to improve ROA measures. AACSB 2015
Standard 9 Ethical understanding and reasoning (able to identify ethical issues and address the issues in a socially responsible
manner)
Dell executives said in 2013 that they cut prices on personal computers and servers in an effort to grow market share and
benefit from after-market sales of software and services. Note that software and services are higher margin sales than
hardware. Discuss the impact of this action on accounting measures of competitive advantage today and in the future. See
“Dell profit falls 72%; Sales flat” The Wall Street Journal 8/15/13.
Research Update
Hambrick, D. C. and Quigley, T. J. (2013), Toward more accurate contextualization of the CEO effect on firm performance.
Strat.
Mgmt
. J., doi: 10.1002/smj.2108
EXPERIENCED FACULTY: Extensive research using variance partition methodology has addressed the question, “How much
do CEOs matter?” The bulk of the evidence has suggested that 10–20 percent of the firm performance is attributable to
the CEO. This new research refines the methodology by replacing firm dummy variables with controls for the
organization’s health and profitability at the time that the new CEO took over. Using this methodological change with
typical ANOVA and multi-level modeling, CEO effects are 16–20 percent. When the change in control variables is
combined with the generalized estimating equations (GEE) method that is preferred when continuous variables are used
rather than dummy variables, the complete new method shows that the CEO effect explains 39 percent of the variance in
ROA.
Strategic Management 3
e
Instructor Manual
7
EXERCISE
EXPERIENCED FACULTY: If you teach a capstone course and look for ways to integrate knowledge from previous courses,
consider this exercise. Exhibit 5.1 can be used to generate a discussion about how a manager might communicate the firm’s
strategy to his/her team and place the team’s contribution to helping the firm achieve competitive advantage in context.
Employees often have difficulty relating to high–level firm objectives, such as improving the firm’s return on invested capital
AACSB 2015 Standard 9 Integrating knowledge across fields and Leading in organizational situations
5.1 Competitive Advantage and Firm Performance
LO 5–2
POWERPOINT SLIDES 11–12
EXAMPLES
NEWER FACULTY: We find that students are most comfortable with this perspective of measuring competitive advantage.
Whether they have invested their own money or not, they are largely familiar with buying and selling publicly traded stocks.
We try to point out the highly volatile and short-term nature of stock prices, whereas generally we think about competitive
advantage lasting more than one quarter or one year. Coverage of the drawbacks of this perspective is useful to help students
understand when this approach may be appropriate and when it may NOT be.
DISCUSSION TOPICS
The video “We’re all predictably irrational” is 20 minutes of a speech by Professor Dan Ariely, the author of The New York
Times bestseller Predictably Irrational and also a newer book The Upside of Irrationality. The video is too long for most
class presentations, but we ask for student volunteers to view the video before class and let them select a two– or three-minute
section to show to the class. Alternatively, each student could be assigned to view different brief videos on Professor Ariely’s
website (most are less than one minute) and summarize for the class in one sentence the learning message from that video
and how it might affect the purchase of stocks. Professor Ariely’s work focuses on behavioral economics and explains why
people are not rational in their purchase decisions.
EXPERIENCED FACULTY: Discuss the decision by Dell to take the company private. Michael Dell argued that he needs to
make tough decisions that will depress net income and he will be able to do this better without public markets measuring his
firm’s performance on a daily basis. Invite students to debate whether (and why) Dell has a better chance to gain a
competitive advantage without a public stock price or earnings reporting. Try to draw the finance students into this discussion
and ask them to justify their opinions with theory from their finance courses. See The Wall Street Journal article.
Strategic Management 3
e
Instructor Manual
8
skills are to a firm’s competitive advantage. For this particular measure of competitive advantage, this one item in the firm’s
slate of resources and capabilities can have an outsize impact.
END OF CHAPTER DISCUSSION QUESTION 2
For many people, the shareholder perspective is perhaps the most familiar measure of competitive advantage for
publicly traded firms. What are some of the disadvantages of using shareholder value as the sole point of view for
defining competitive advantage?
Using solely shareholder value to measure a company’s competitive advantage has several limitations. The most recent
recession made painfully clear some of these shortfalls. First, a firm’s short-term performance is difficult to determine
5.1 Competitive Advantage and Firm Performance
LO 5–3
POWERPOINT SLIDES 13–19
STRATEGY SMART VIDEO LECTURE
POWERPOINT SLIDES 16 AND 62
Students seem to find consumer and producer surpluses confusing. In slide 62, the short video may help to reinforce the
written description in the textbook and could be assigned for viewing before your lecture or to accompany Slide 16.
EXAMPLES
NEWER FACULTY: The PC example in the text should resonate well with students, since it represents a significant purchase
for them in which they likely consider competing brands with different positioning. We use some of the class time to
highlight the differences between consumer surplus and producer surplus. Also, in a foreshadowing of Chapter 6 (business–
level strategies), we note firms have the ability to adjust the price within the economic value created space (V–C). In
discussing economic value creation, we sometimes refer to these as the “VPCs” to highlight the key components in a way to
help students remember the material. We also note some drawbacks of this approach.
POWERPOINT SLIDE 17
An example from the text is for the cost versus price of the Apple Watch, provided in “What makes the Apple Watch tick” (N
Olivarez-Giles 4/30/15 The Wall Street Journal).
POWERPOINT SLIDE 17

Strategic Management 3
e
Instructor Manual
9
Strategic Management 3
e
Instructor Manual
10
As you can see from the pizza example, economic value created therefore also equals the sum of consumer and producer
surplus (that is, profit):
Economic value created = $12 – $7 = $5
Consumer surplus + Producer surplus = $2 + $3 = $5
The bistro entrepreneur faces two types of opportunity costs: (1) forgone wages she could be earning if she was employed
elsewhere and (2) the cost of capital she invested in her bistro, which could instead be invested in, say, the stock market or
U.S. Treasury bonds. At the end of the year, the bistro entrepreneur considers her business over the last 12 months. She made
an accounting profit of $60,000, calculated as total revenues minus expenses (which include all historical costs but not
opportunity costs). But she also realizes she has forgone $40,000 in salary she could have earned at another firm. In addition,
POWERPOINT SLIDES 14–15
To provide a similar example to that illustrated in Exhibits 5.5 and 5.6, consider that, if the economic value created (V – C)
by the pizzeria across the street is only $4, then the bistro entrepreneur has a competitive advantage because $5 > $4. (For
simplicity, assume there are no other pizza parlors or delivery services nearby.)
INTEGRATION
Interactive Labeling: Economic Value Creation
This interactive drag-and-drop exercise starts with a brief case using pizza costs and pricing as an additional example of
economic value. This complements the book’s discussion about laptop computers. The student must read the textbook
and also the case provided here. Then, the student will apply some simple math to check understanding of the correct
economic concepts and drag the elements to the correct locations. The activity complements the PowerPoint discussion
on the pizza bistro noted above. Finally the student will answer three related questions to complete the activity.
Difficulty: Medium Blooms: Apply AACSB: Analytic
Follow-Up Activity: The instructor can expand on the concepts from this interactive by using end of chapter discussion
question 1 which asks the students to look up the Domino’s Pizza website and decide if the firm is focused on
accounting, shareholder, or economic perspectives in describing its competitive advantage.
Strategic Management 3
e
Instructor Manual
11
END OF CHAPTER DISCUSSION QUESTION 1
Domino’s Pizza has been in business for over 50 years and claimed #1 Worldwide in Pizza Delivery in 2013. Visit the
company’s business-related website (www.dominosbiz.com) and read the company profile under the “Investors” tab.
Does the firm focus on the economic, accounting, or shareholder perspective in describing its competitive advantage in
the profile?
On the Domino’s Pizza company profile page, most of the focus is on economic value creation for the company and its
customers. The site talks about all the products the company offers—from thin crust, deep dish, hand-tossed pizzas to bread
sticks, cheesy bread, buffalo wings, sandwiches, pasta, and boneless chicken. The website mentions the 2009 reconfiguration
EXERCISES
POWERPOINT SLIDES 14–15
You can extend the ChapterCase with an economic value creation example on smartphones. The 9/12/12 Wall Street Journal
article “iPhone 5 costs stay in check” discusses decisions that Apple made to hold costs in check on its new product and the
video dissects the iPhone 5 to its components. The video raises the opportunity to discuss some supply chain drivers of
economic value creation. Accompanying graphics illustrate the cost of goods sold and sales price for a variety of models of
Apple products and some competing products, such as the Nokia Lumia phone. The data from the graphics can be used as a
homework question or an exam question to assess their achievement of this learning outcome. In the case of the comparison
of Apple iPhone 4S to Nokia Lumia 900: The retail cost is $450 for the Lumia and $649 for iPhone. The component cost is
$209 for Lumia and $190 for iPhone.
Research Update
Garcia-Castro, R. and Aguilera, R. V. (2015), Incremental value creation and appropriation in a world with multiple
stakeholders. Strategic Management Journal, 36: 137–147
EXPERIENCED FACULTY: This research offers the opportunity to connect the neoclassical view of economic value
creation, which divides value creation into consumer surplus and producer surplus, with the resource-based view from
Chapter 4, which digs deeper to assess specific resources and capabilities that generate value for the firm and the firm’s
ability to appropriate that value relative to other stakeholders. These scholars propose a taxonomy of value creation to
include various types of value creation, appropriation due to both bargaining power and property rights, and the
relationship between value appropriated by a stakeholder and total value creation by the firm.
Strategic Management 3
e
Instructor Manual
12
5.1 Competitive Advantage and Firm Performance
LO 5–4
POWERPOINT SLIDES 20–24
STRATEGY SMART VIDEO LECTURE
POWERPOINT SLIDE 59
NEWER FACULTY: Robert Kaplan explains how the balanced scorecard can be used as a tool to communicate strategy
throughout the firm.
EXERCISE
Balanced-scorecard methods may have some advantages for firms when they are trying to assess the sustainability of their
competitive advantage over the long term, rather than the snapshot in time offered by three methods previously discussed.
“Measuring long-term performance” McKinsey Quarterly March 2005 discusses how firms might use a selection of multiple
measures of performance to give a better insight into competitive advantage in the medium to long term. Examples of
measures they suggest are sales growth, ability to control cost structure relative to competitors over the past 5 years, strength
of new product pipeline, asset maintenance, and financial flexibility. Divide the students into teams and tell them that they
have just been appointed as consultants to the CEO of Microsoft. Develop a balanced scorecard of areas he/she should focus
on to ensure that the company would have an improved competitive advantage versus Apple by 2018.
END OF CHAPTER ETHICAL/SOCIAL ISSUES 1
You work as a supervisor in a manufacturing firm. The company has implemented a balanced-scorecard
performance-appraisal system and a financial bonus for exceeding goals. A major customer order for 1,000 units
needs to ship to a destination across the country by the end of the quarter, which is two days away from its close. This
shipment, if it goes well, will have a major impact on both your customer-satisfaction goals and your financial goals.
With 990 units built, a machine breaks. It will take two days to get the parts and repair the machine. You realize there
is an opportunity to load the finished units on a truck tomorrow with paperwork for the completed order of 1,000
units. You can have an employee fly out with the 10 remaining parts and meet the truck at the destination city once
the machinery has been repaired. The 10 units can be added to the pallet and delivered as a complete shipment of
1,000 pieces, matching the customer’s order and your paperwork. What do you do? AACSB 2015 Standard 9 Ethical
understanding and reasoning (able to identify ethical issues and address the issues in a socially responsible manner)
Students will certainly take different approaches on this issue, but the important aspect is that everyone understands the
issues on both sides. As a supervisor it would be your responsibility to update the customer on the situation. In this instance,
a phone call is appropriate to discuss the plan and assure the customer of your confidence in order fulfillment. The