
4. Do you think a proposal to abolish limited liability for stockholders would be
supported by companies issuing stock? (LO1)
Answer: No. The obvious downside would be that stocks would become much
less attractive as an investment, making it much costlier for firms to raise funds
is unlikely to be a feasible option.
5. You peruse the available records of some public figures in your area and notice that
most likely to you? (LO5)
Answer: Your first instinct is that the public officials have access to inside
information, which they use to guide their investment decisions. Other possibilities
6. Do you think that widespread belief in the efficient markets theory was a significant
contributor to the 2007-2009 financial crisis? Why or why not? (LO5)
Answer: The efficient market hypothesis does not postulate that market prices of
risks associated with certain securities.
7. Based on the dividend-discount model, what do you think would happen to stock
Answer: If investors perceive bonds are more risky, then the relative riskiness of
stocks will fall. Stocks would become relatively more attractive, requiring a smaller
8. *Use the dividend-discount model to explain why an increase in stock prices is often
a good indication that the economy is expected to do well. (LO3)
Answer: How well investors expect the economy to do is reflected in the expected

that g enters the numerator positively and the denominator negatively, so if g
increases, the stock price increases.
9. Memories of the 2007-2009 financial crisis have made you more risk averse,
doubling the risk premium you require to purchase a stock. Suppose that your risk
and expected dividend growth, what price (rounded to the nearest dollar) would you
now be willing to pay for this stock? (LO3)
Answer: First, use the dividend discount model formula to calculate the risk-free
interest rate.
Using this information, calculate the price you would be willing to pay with rp =
0.08.
10. Suppose a shock to the financial system were to disproportionately hit corporate bond
you anticipate this would have on i) the expected return on holding stocks and ii) the
volatility of equity returns? (LO3)
Answer:
i) As the proportion of a company’s financing via equity versus debt rises, the
ii) The decline in volatility of equity returns reflects the residual claimant status of
Data Exploration:
1. How well does the stock market anticipate the behavior of the economy? Plot on a
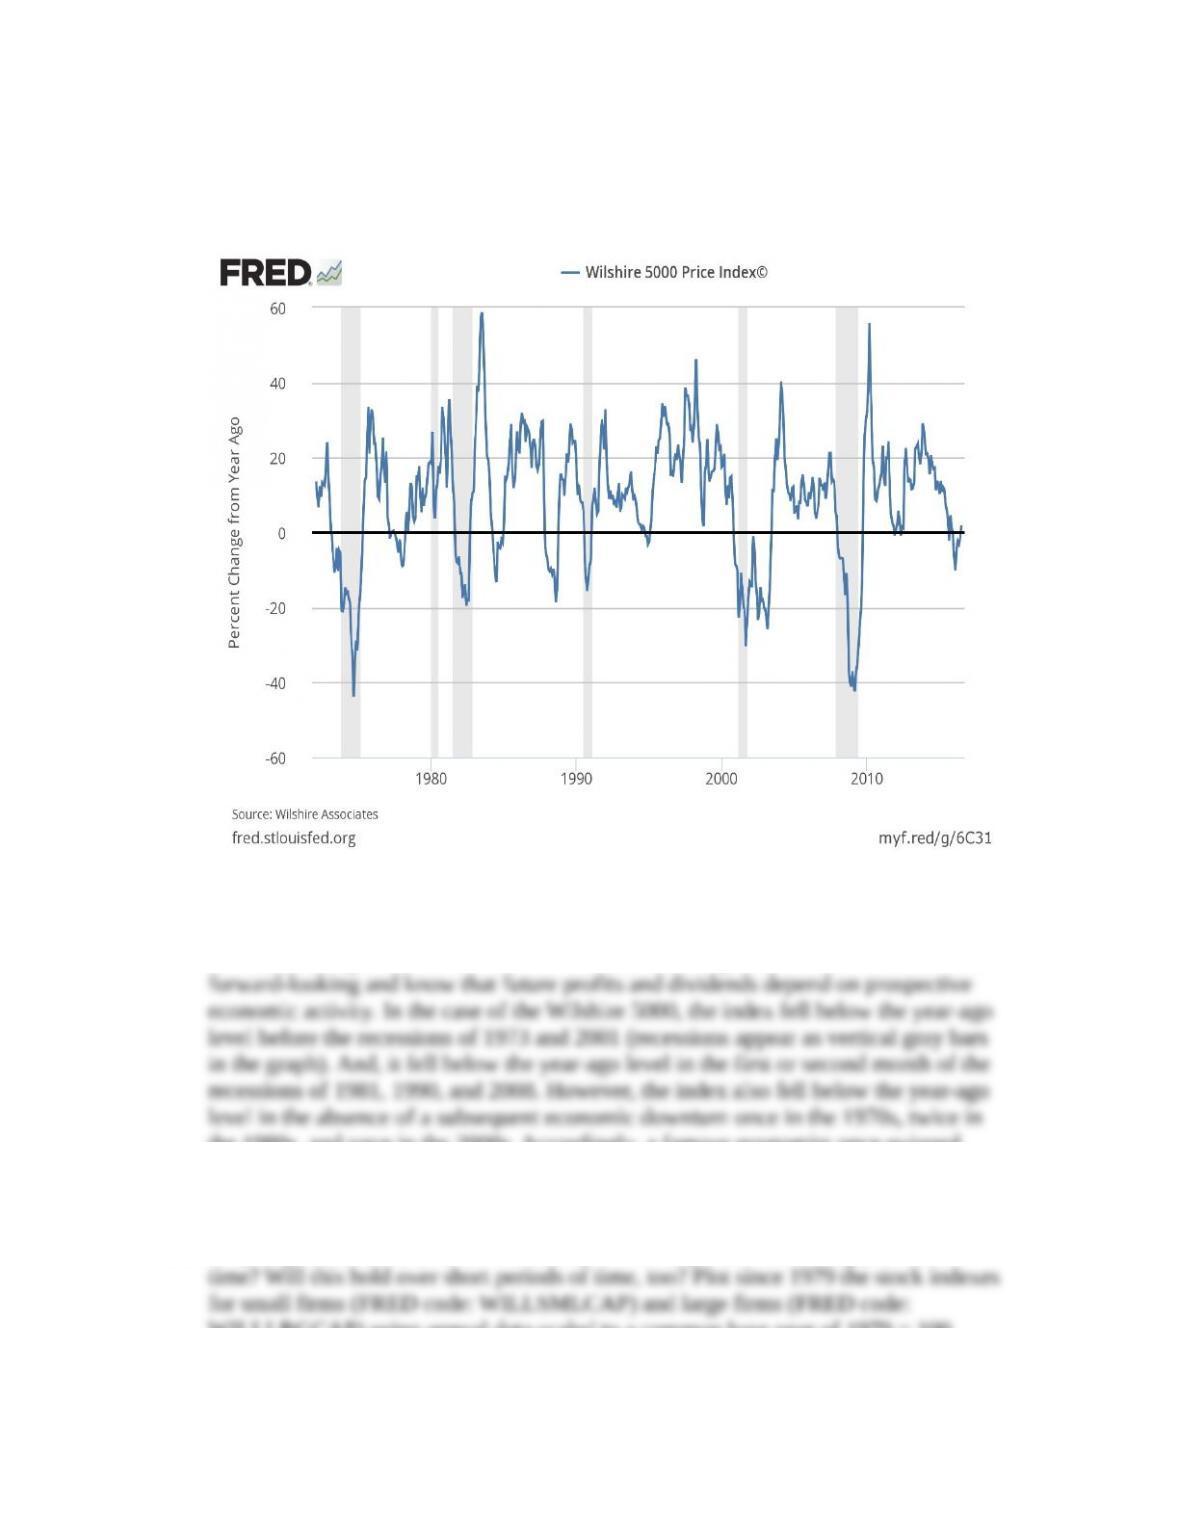
downturns (depicted in the graph by vertical, shaded bars)? (LO5)
Answer: The data plot is:
Wilshire Associates, Wilshire 5000 Price Index© [WILL5000PR], retrieved from FRED, Federal Reserve Bank of
St. Louis; https://fred.stlouisfed.org/series/WILL5000PR, August 15, 2016.
Among various measures of financial conditions, a broad index of the stock market is
one of the best predictors of economic downturns and upturns because investors are
the 1980s, and once in the 2000s. Accordingly, a famous economist once quipped
decades ago: “The stock market forecast nine of the past five recessions.”
2. Why might the stocks of small firms outperform large firms over long periods of
WILLLRGCAP) using annual data scaled to a common base year of 1979 = 100.
(LO3)
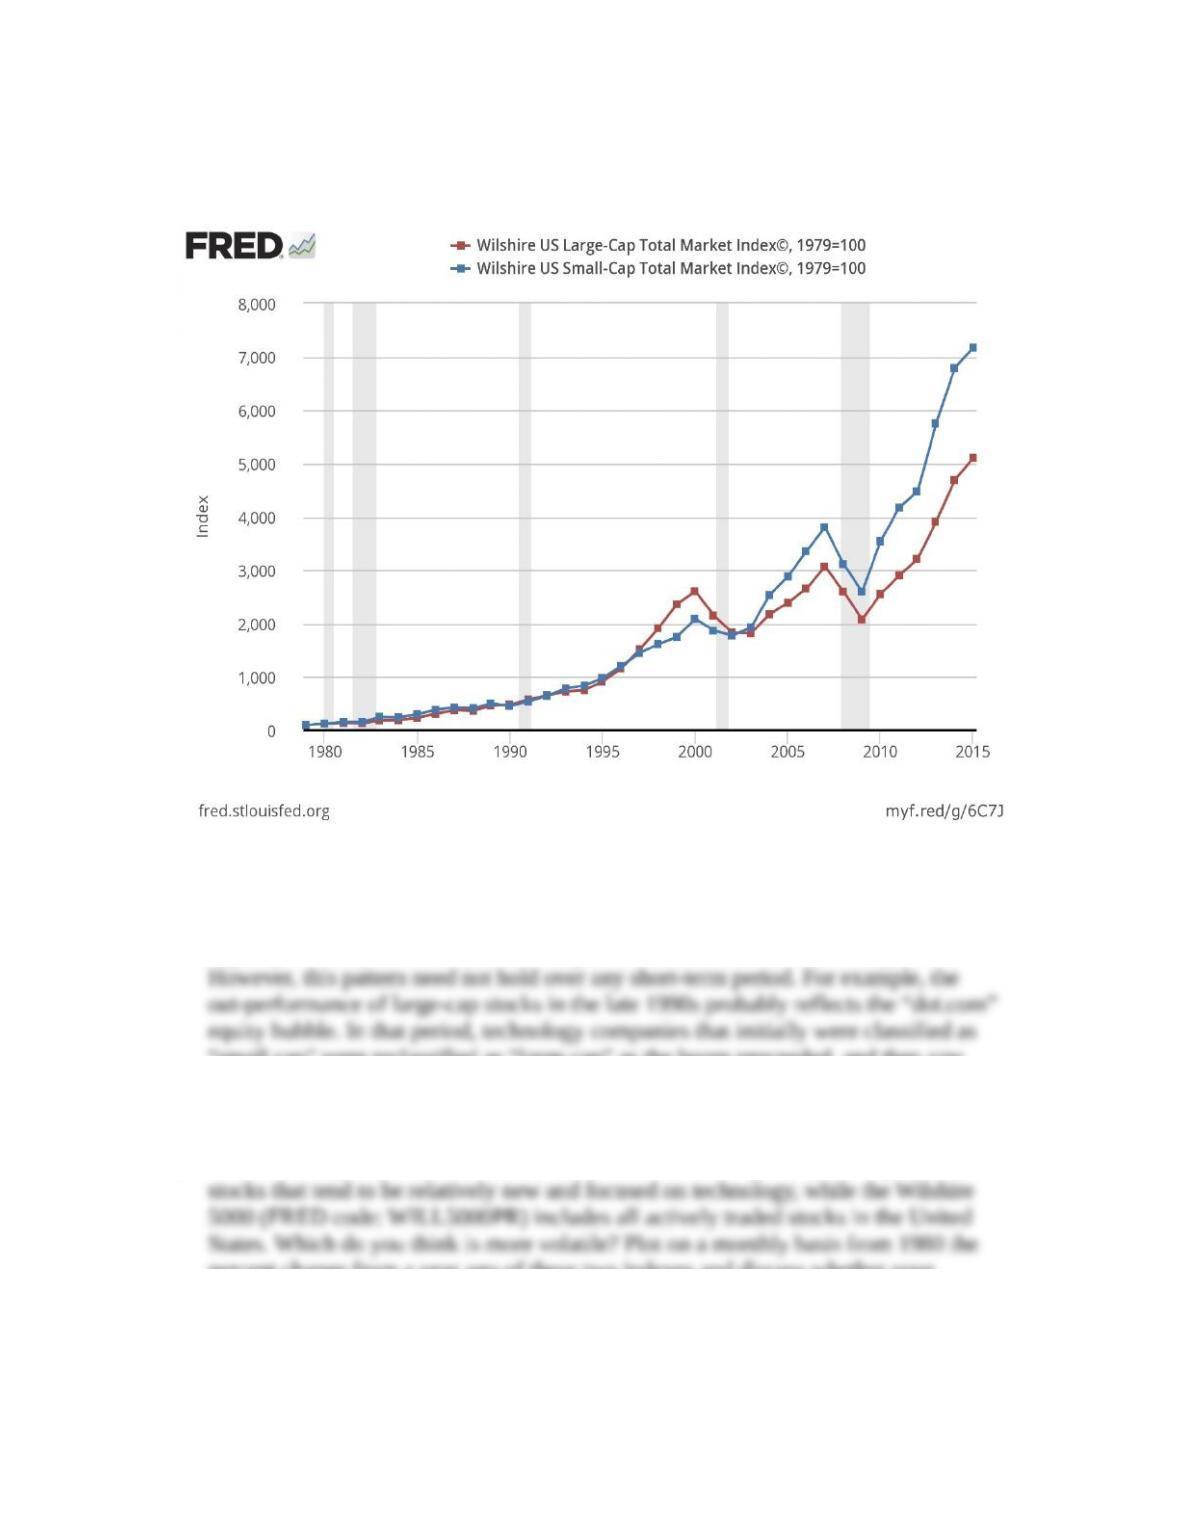
Answer: The data plot is:
Wilshire Associates, Wilshire US Small-Cap Total Market Index© [WILLSMLCAP] and Wilshire US
Large-Cap Total Market Index© [WILLLRGCAP], retrieved from FRED, Federal Reserve Bank of St. Louis;
https://fred.stlouisfed.org/series/WILL5000PR, August 15, 2016.
Because risk requires compensation, we expect the stocks of small firms (that have a
higher probability of failure) to offer higher returns than the stocks of large firms.
“small cap” were reclassified as “large cap” as the boom proceeded, and then saw
their values plunge when the boom went bust.
3. The NASDAQ stock market index (FRED code: NASDAQCOM) is comprised of
percent change from a year ago of these two indexes and discuss whether your
intuition was correct. (LO5)
Answer: The data plot is:
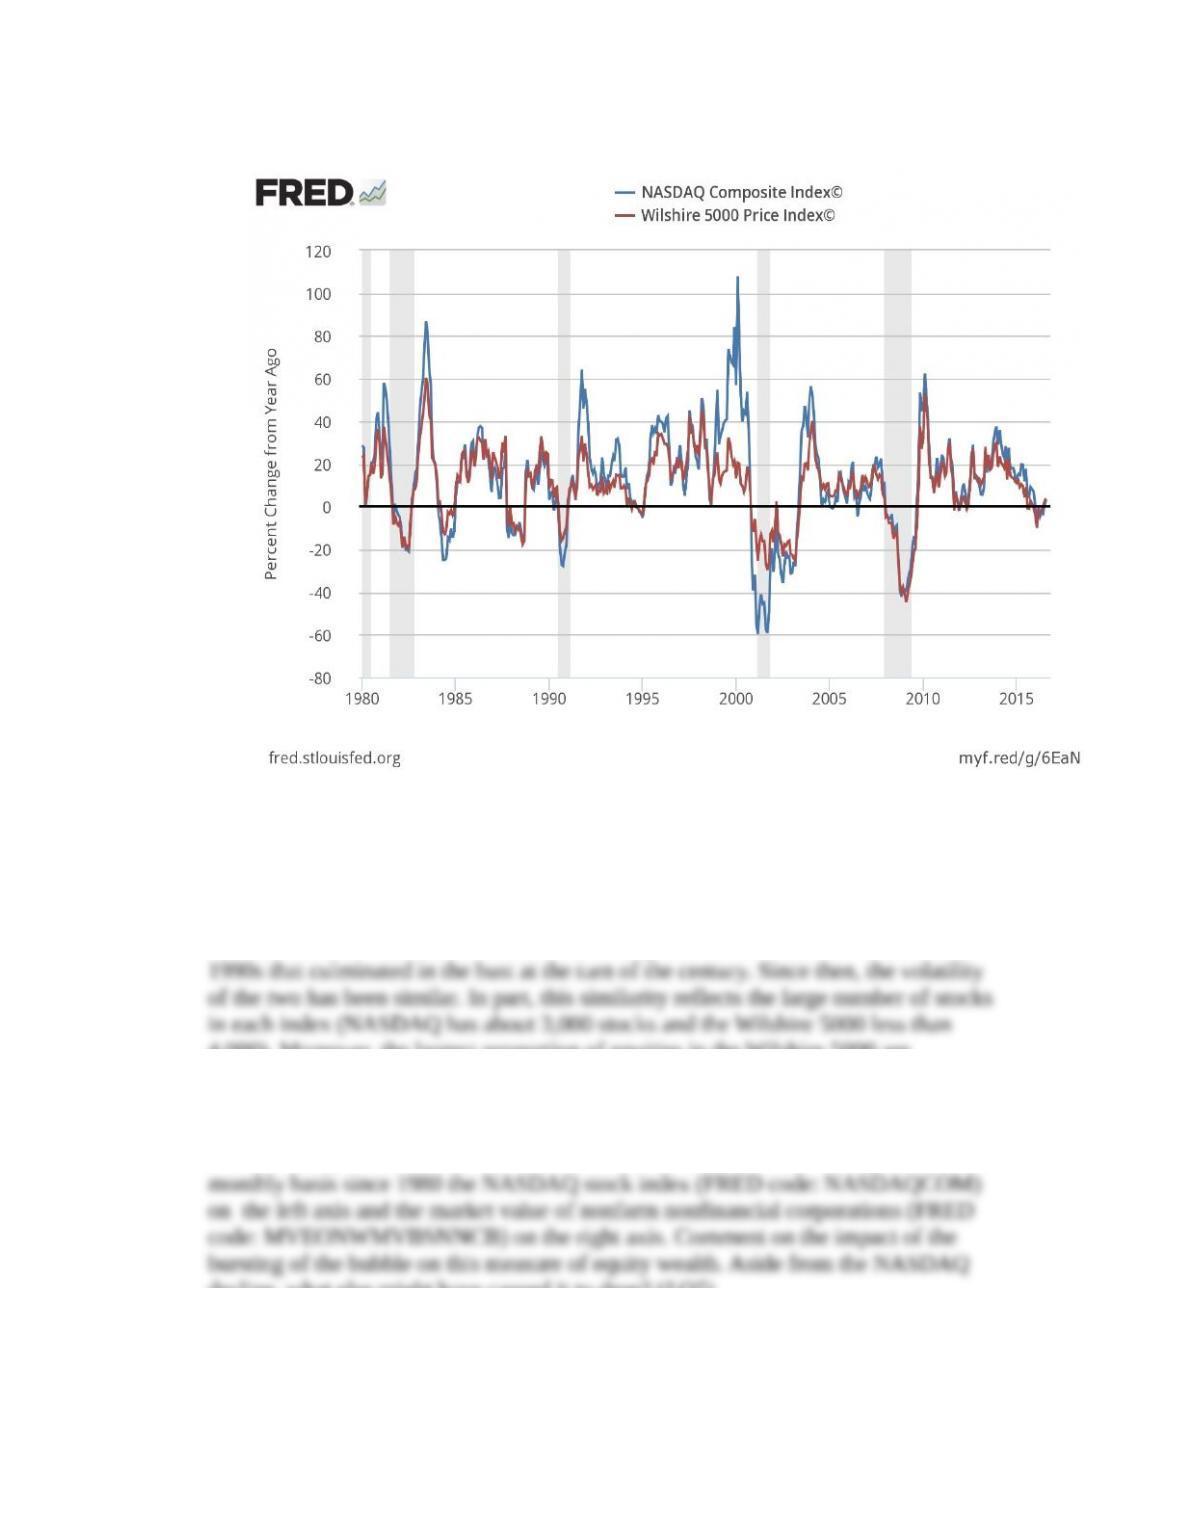
NASDAQ OMX Group, NASDAQ Composite Index© [NASDAQCOM], retrieved from FRED, Federal
Reserve Bank of St. Louis; https://fred.stlouisfed.org/series/NASDAQCOM. Wilshire Associates, Wilshire
5000 Price Index© [WILL5000PR], retrieved from FRED, Federal Reserve Bank of St. Louis;
https://fred.stlouisfed.org/series/WILL5000PR.
Answer: The components of the NASDAQ hint that this index would be more volatile
than the broader Wilshire 5000. This was clearly true in the “dot.com” boom of the
4,000). Moreover, the largest proportion of equities in the Wilshire 5000 are
NASDAQ stocks, suggesting that their statistical properties should be broadly similar.
4. To see the impact of the bubble in internet stocks on household wealth, plot on a
decline, what else might have caused it to drop? (LO5)
Answer: The plot is:
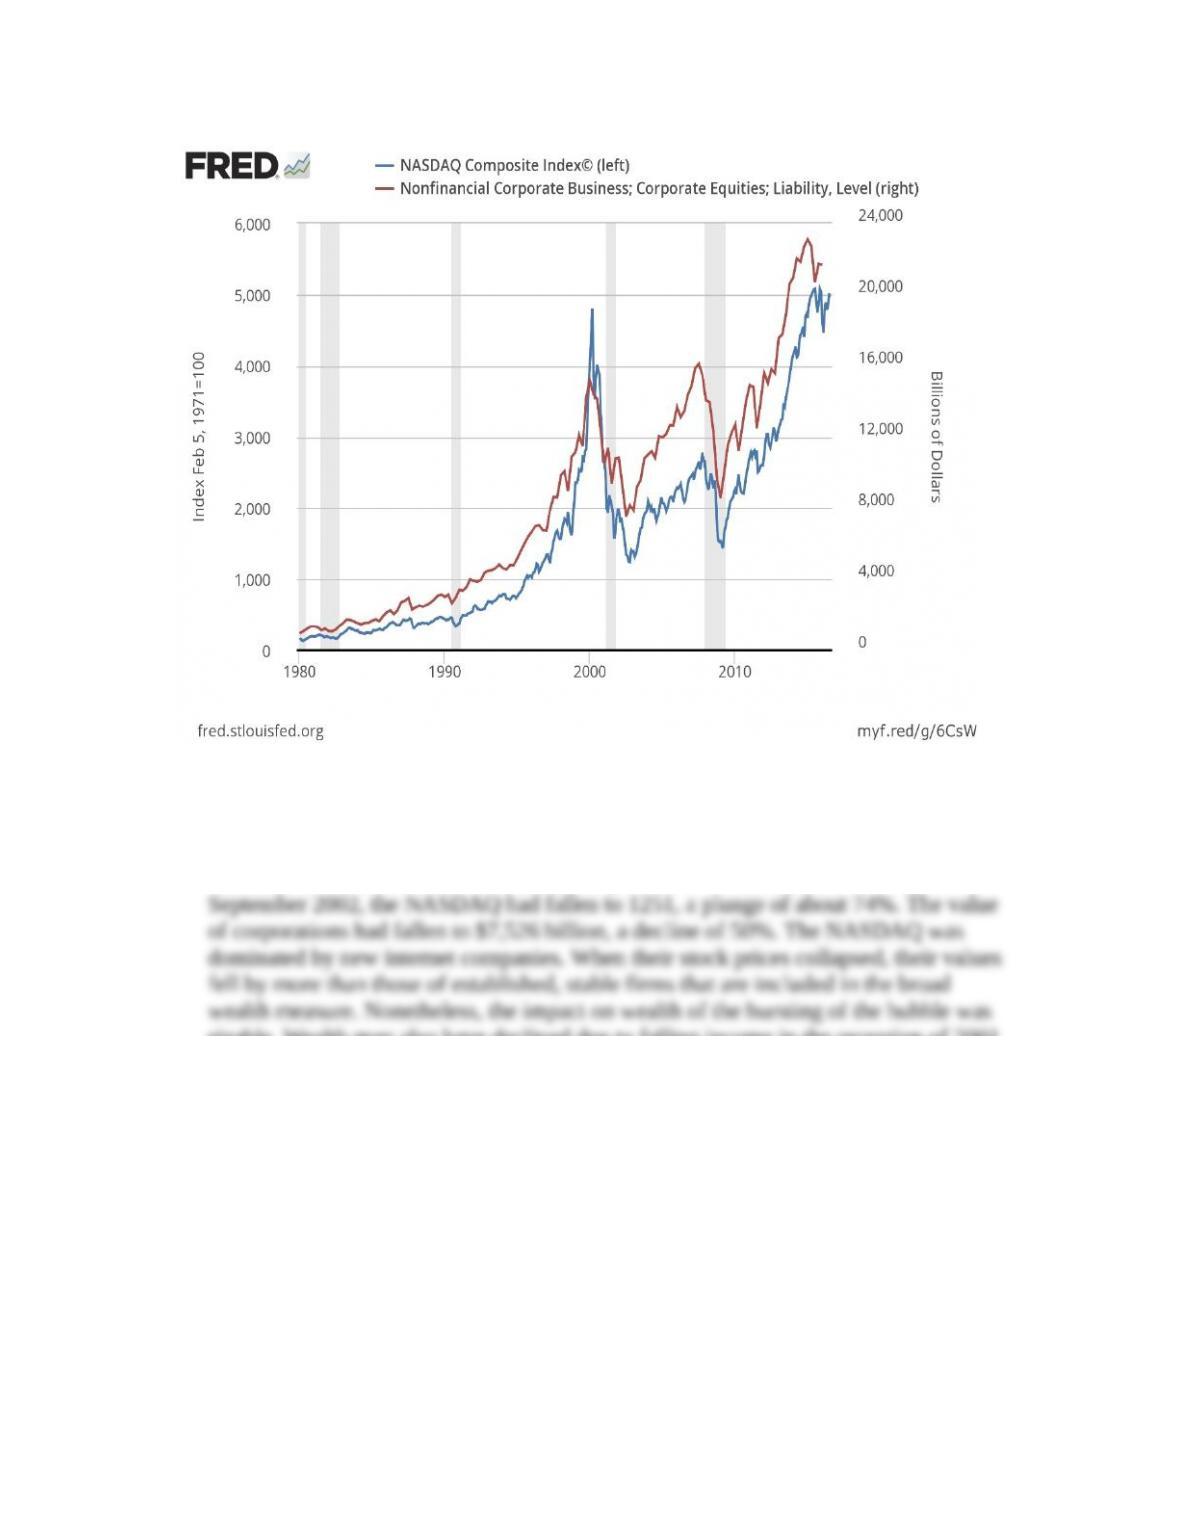
NASDAQ OMX Group, NASDAQ Composite Index© [NASDAQCOM], retrieved from FRED, Federal
Reserve Bank of St. Louis; https://fred.stlouisfed.org/series/NASDAQCOM, August 15, 2016.
Wealth as measured by the value of corporations fell along with the NASDAQ index,
but by a smaller percentage. On a monthly basis, the NASDAQ peaked at a value of
4802 in March 2002, when the value of corporations was $15,172 billion. By
sizable. Wealth may also have declined due to falling income in the recession of 2001
that also diminished the value of firms not included in the NASDAQ.
5. Have stock dividends become a more important source of income to U.S. households?
Plot on a quarterly basis since 1959 the share of dividend income (FRED code:
B703RC1Q027SBEA) in personal disposable income (FRED code: DSPI). Can you
explain the 50-year trend? (LO5)
Answer: The data plot is:
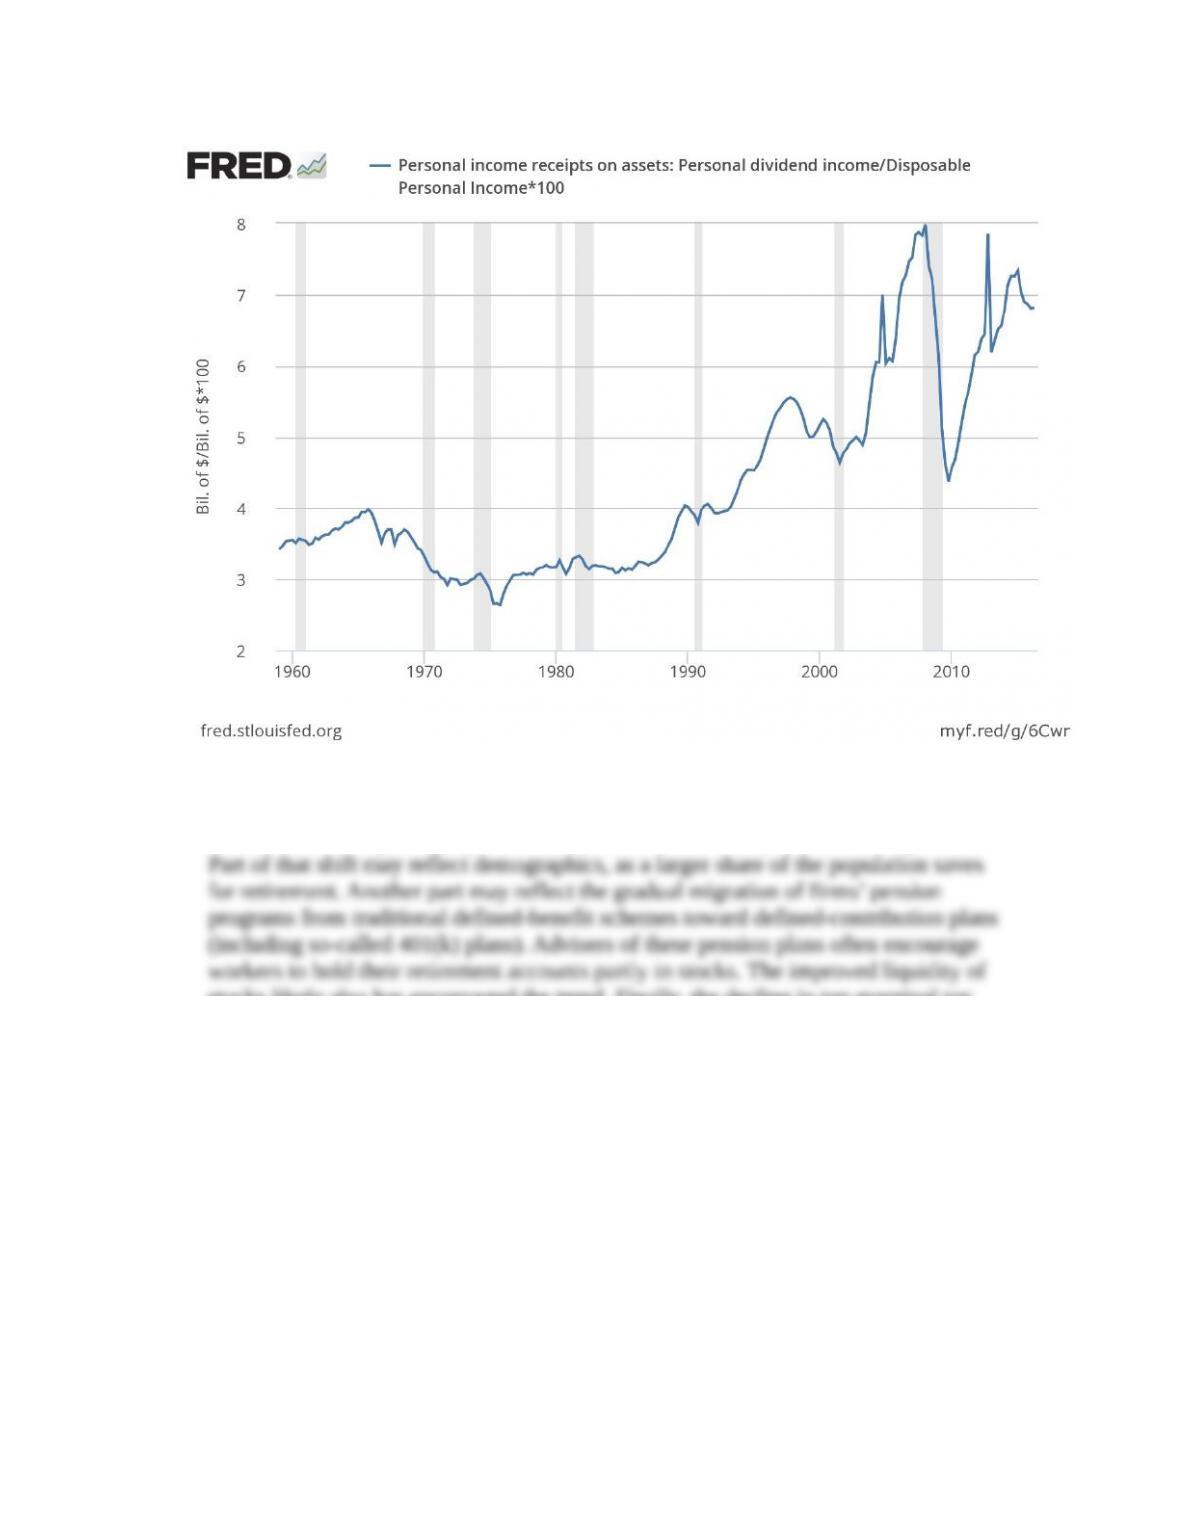
Several factors may explain the rise in dividend income as a proportion of disposable
income. Ownership of equity has become much more widespread over this period.
stocks likely also has encouraged the trend. Finally, the decline in top marginal tax
rates probably made dividends relatively more attractive to investors over time.
* indicates more difficult problems