1. Suppose that a sustainable peace is reached around the world, reducing military
affect the U.S. bond market? (LO3)
Answer: As the government’s need to issue bonds to finance military spending is
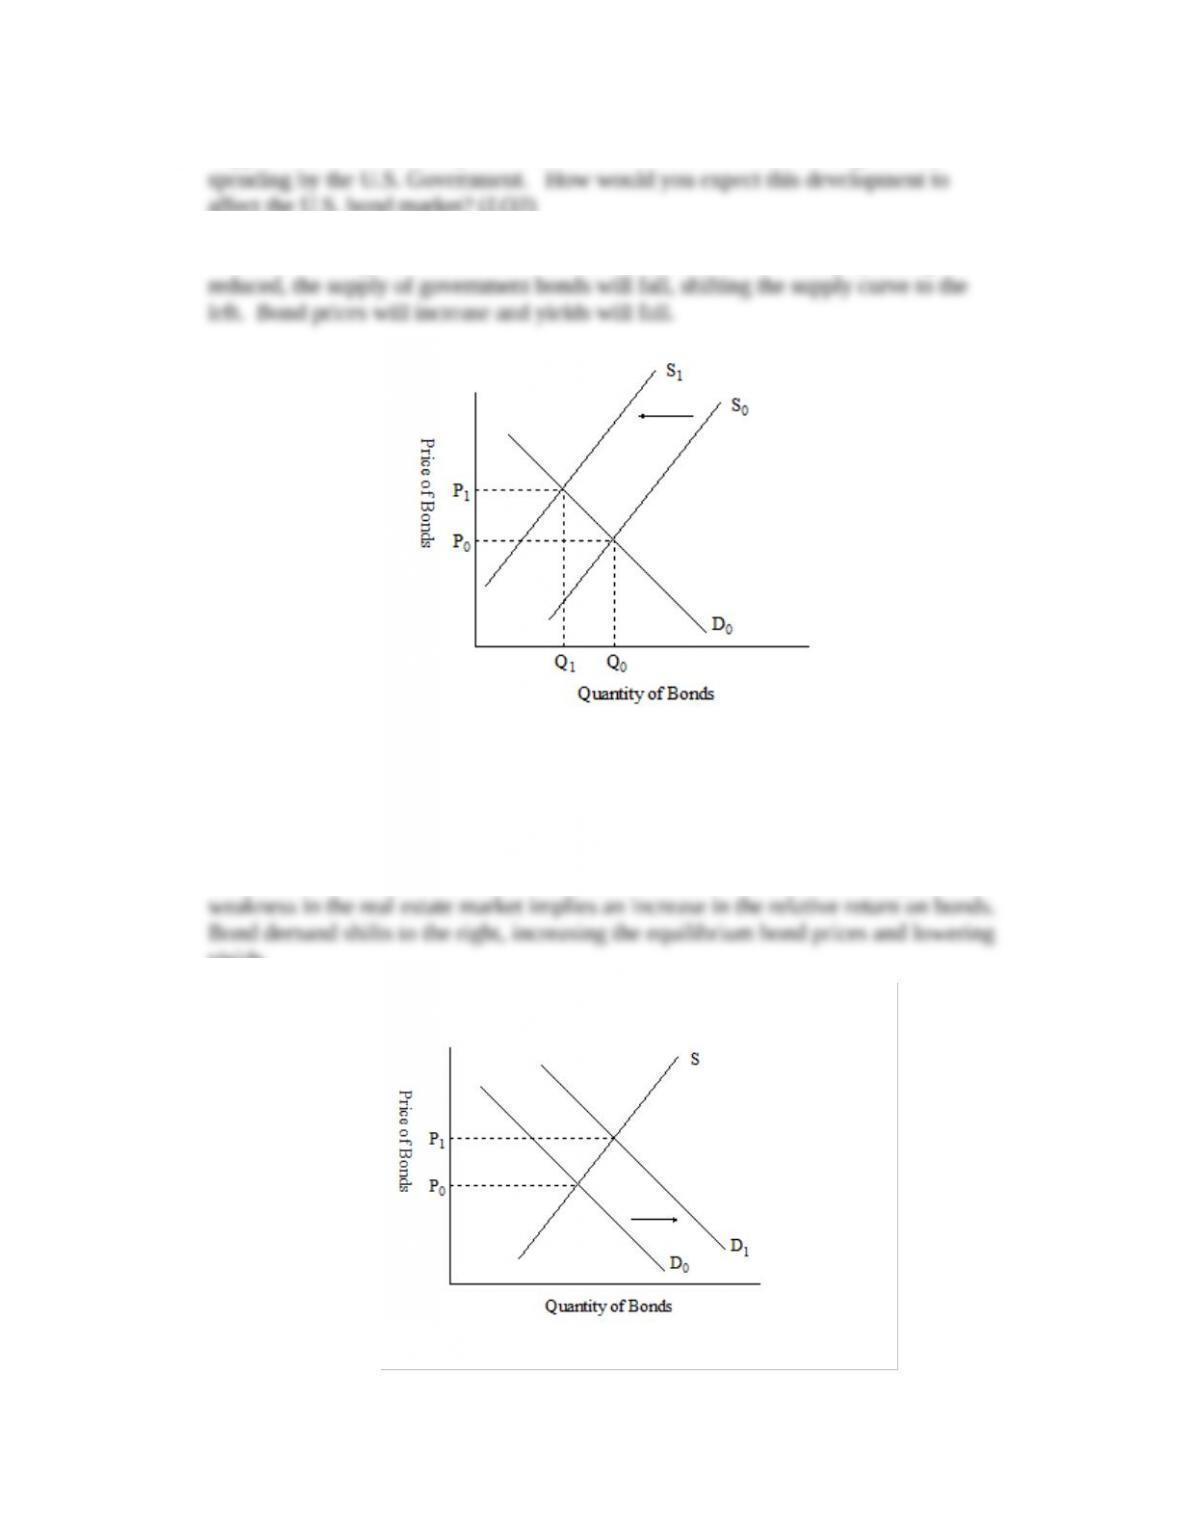
2. Use the model of supply and demand for bonds to determine the impact on bond
prices and yields of expectations that the real estate market is going to weaken. (LO3)
Answer: If we think of real estate as an alternative investment to bonds, expected
yields.

3. *Suppose there is an increase in investors’ willingness to hold bonds at a given price.
the bond price. (LO3)
Answer: The sensitivity of bond supply to changes in the price of bonds is reflected in
price for any given shift in the demand curve.
4. Under what circumstances would purchase of a Treasury Inflation Protected Security
(TIPS) from the U.S. government be virtually risk free? (LO4)
Answer: Purchasing a Treasury Inflation Protected Security (TIPS) would be virtually
risk free if you purchased a bond whose maturity exactly matched your investment
be redeemed at par when it matures. Interest rate movements that cause the price of
the bond to change before it matures will not affect you.
5. In the wake of the financial crisis of 2007-2009, negative connotations often
over the past 30 years? (LO4)
Answer: If the person you are trying to convince is a borrower, they may have
received a lower mortgage interest rate due to the increased liquidity provided by
mortgage as securitization broadened the potential sources of funds for their loan. If
Price of Bonds
Quantity of Bonds
D0
D1
S
P0
P1
Price of Bonds
Quantity of Bonds
D0
D1
S
P0
P1
by securitization.
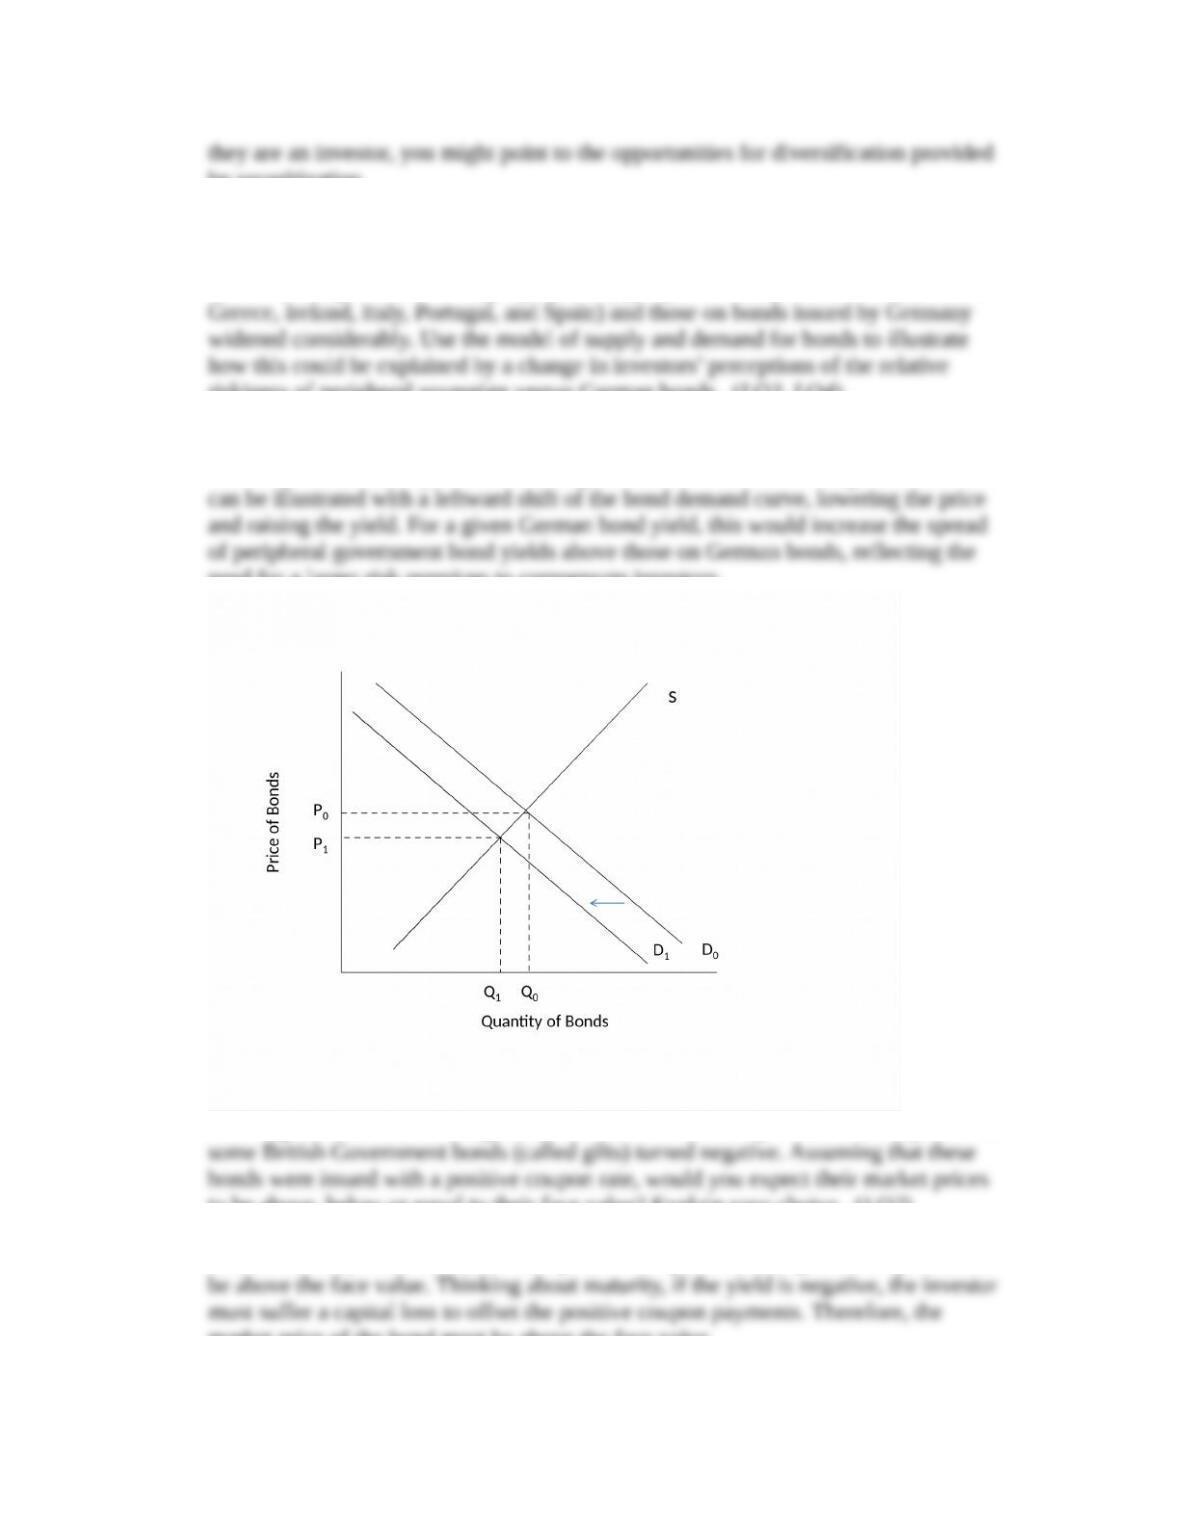
6. During the euro-area sovereign debt crisis, the spread between the yields on bonds
issued by the governments of geographically peripheral European countries (such as
riskiness of peripheral sovereign versus German bonds. (LO3, LO4).
Answer: Investor worries about the possibility of default on bonds issued by
relatively indebted peripheral euro-area governments increased during the crisis. This
need for a larger risk premium to compensate investors.
7. Not long after the United Kingdom’s vote to leave the European Union, the yields on
to be above, below or equal to their face value? Explain your choice. (LO2)
Answer: If the yield on a bond with a positive coupon rate is negative, the price must
market price of the bond must be above the face value.
Data Exploration
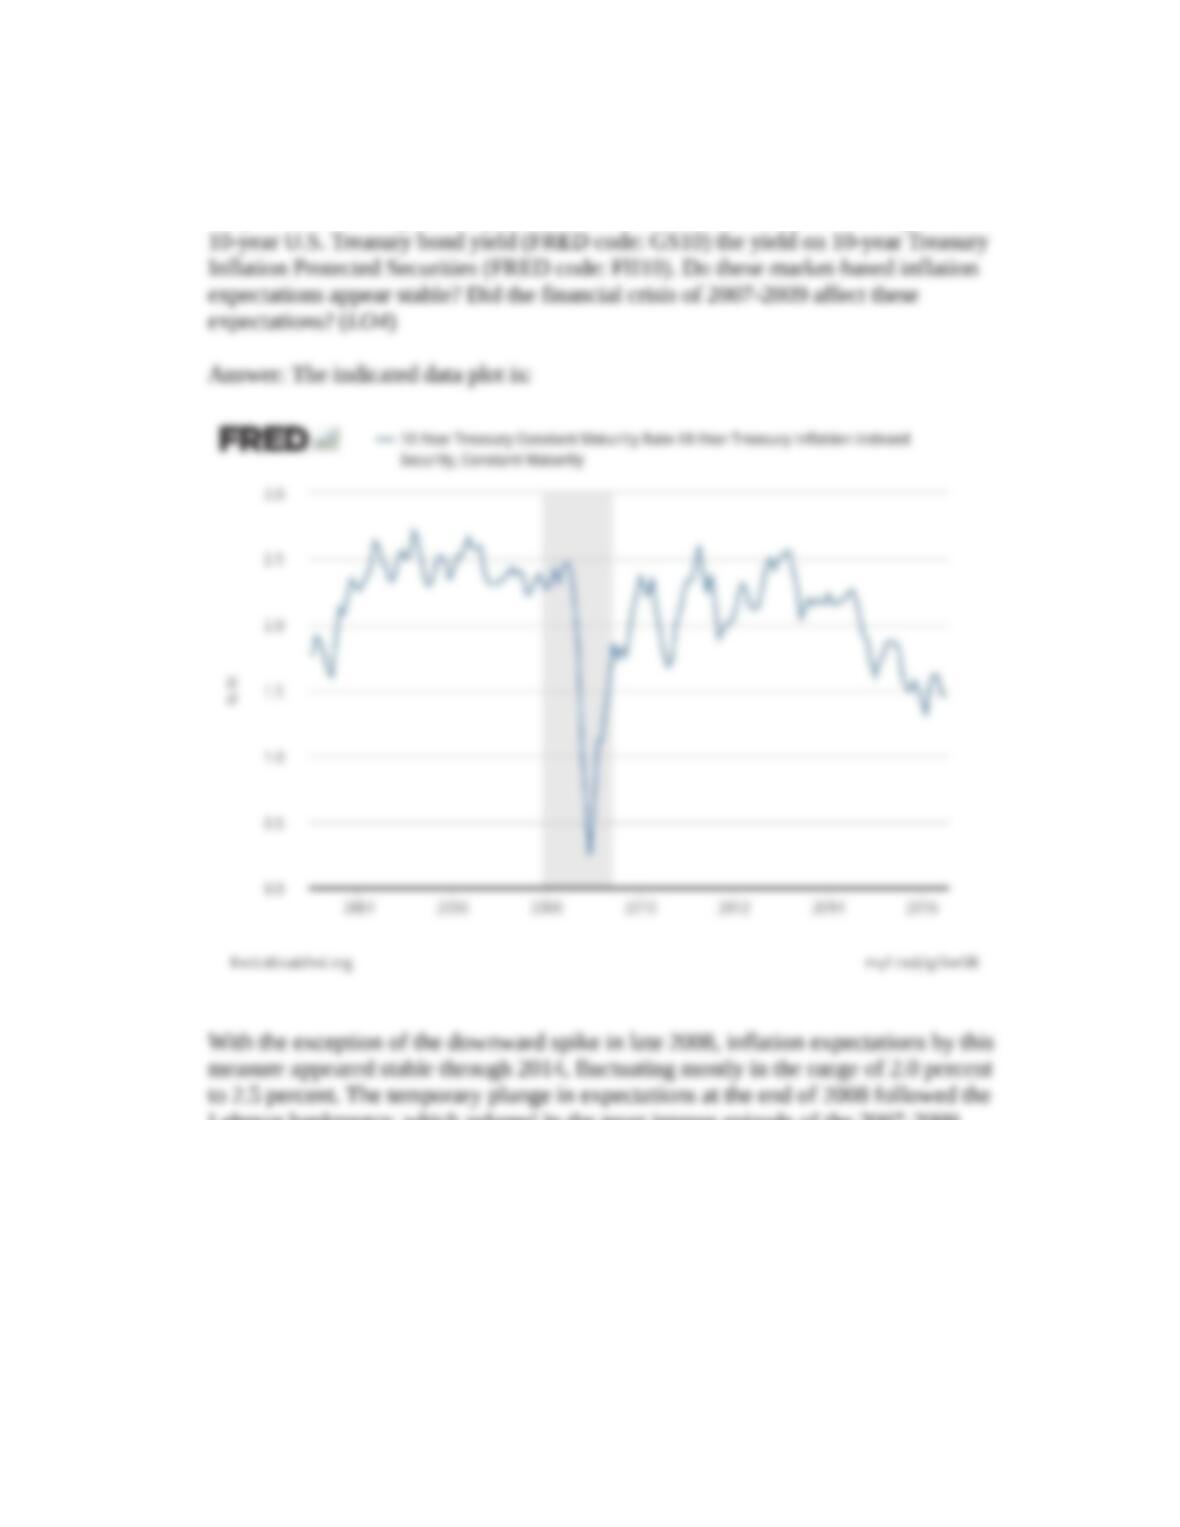
1. Graph investors’ long-term expected inflation rate since 2003 by subtracting from the
Lehman bankruptcy, which ushered in the most intense episode of the 2007-2009
financial crisis. More recently, this measure of expected inflation has drifted lower,
perhaps due to the persistent undershoot of the Fed’s 2 percent inflation target and to
the modest growth of real GDP.
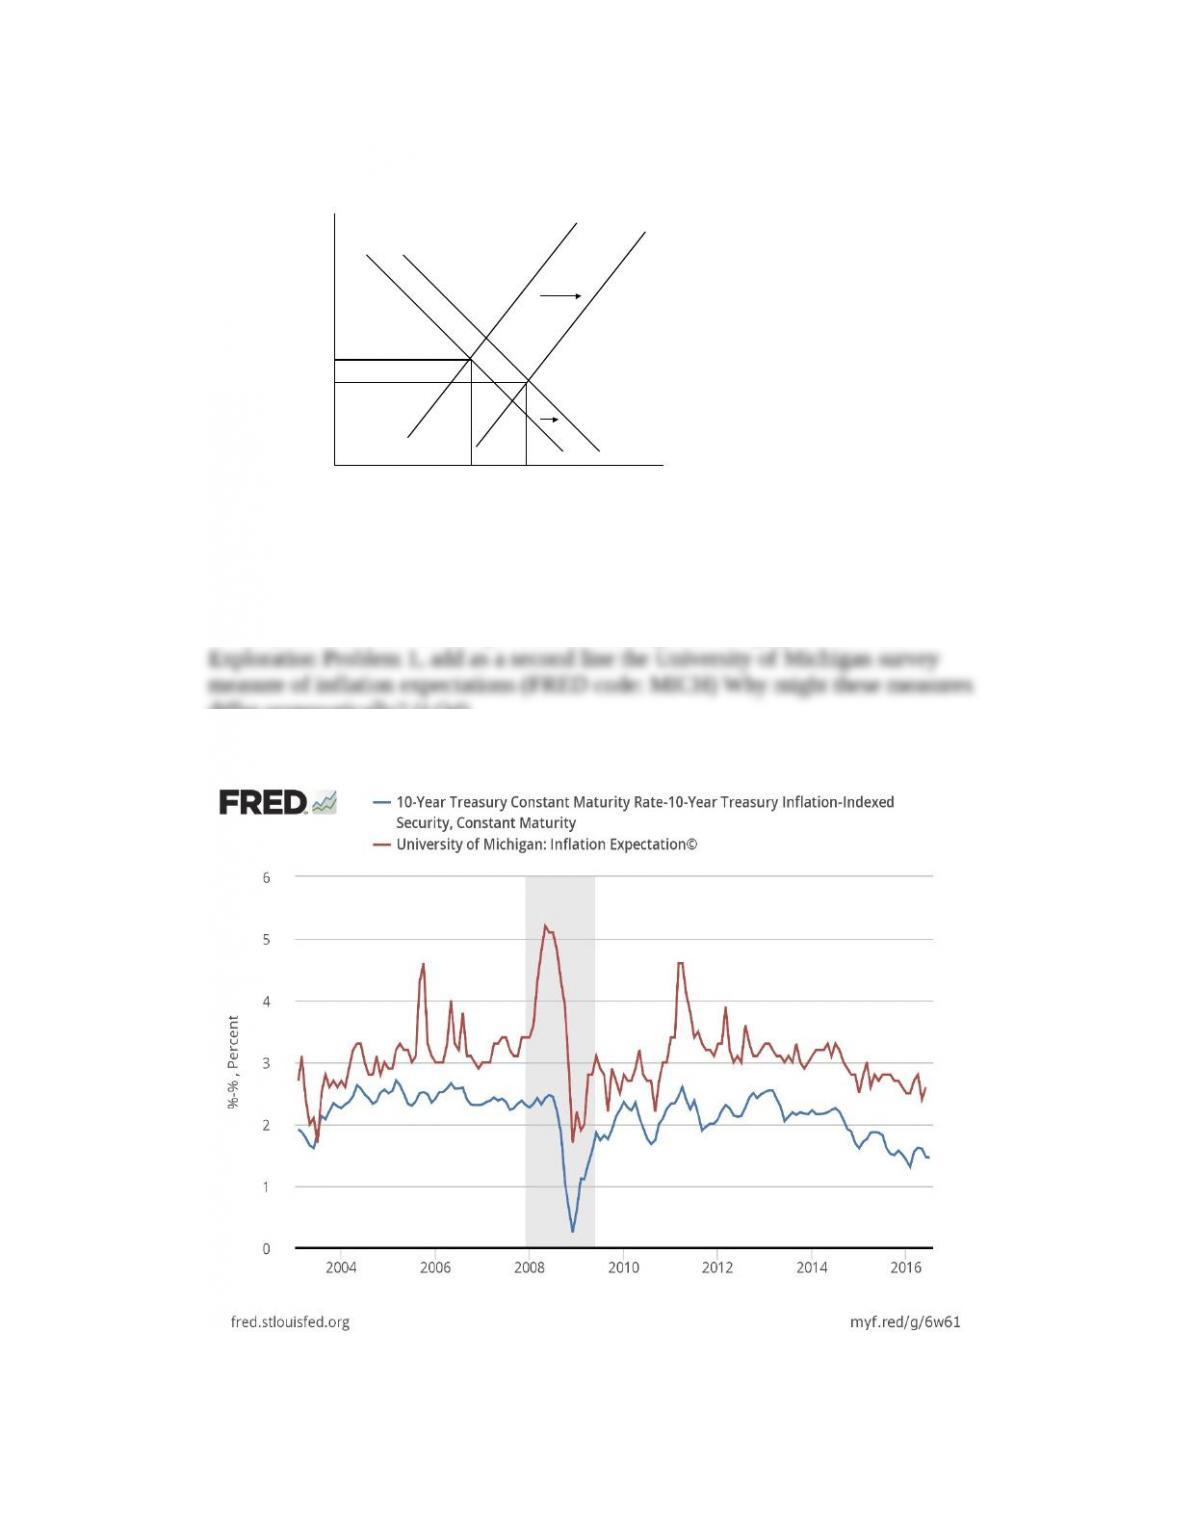
2. Compare long-run market expectations of inflation with a consumer survey measure
of one-year-ahead inflation expectations. Starting with the graph from Data
differ systematically? (LO4)
Answer: The indicated data plot is:
Price of Bonds
Quantity of Bonds
D0D1
S0
P0
P1
S1
Q0Q1
We should not expect that one-year ahead consumer inflation expectations match
10-year-ahead investor inflation expectations, but they are broadly correlated.
electronics) for which inflation may be lower. In contrast, TIPS compensate investors
for changes in the CPI that includes all these prices.
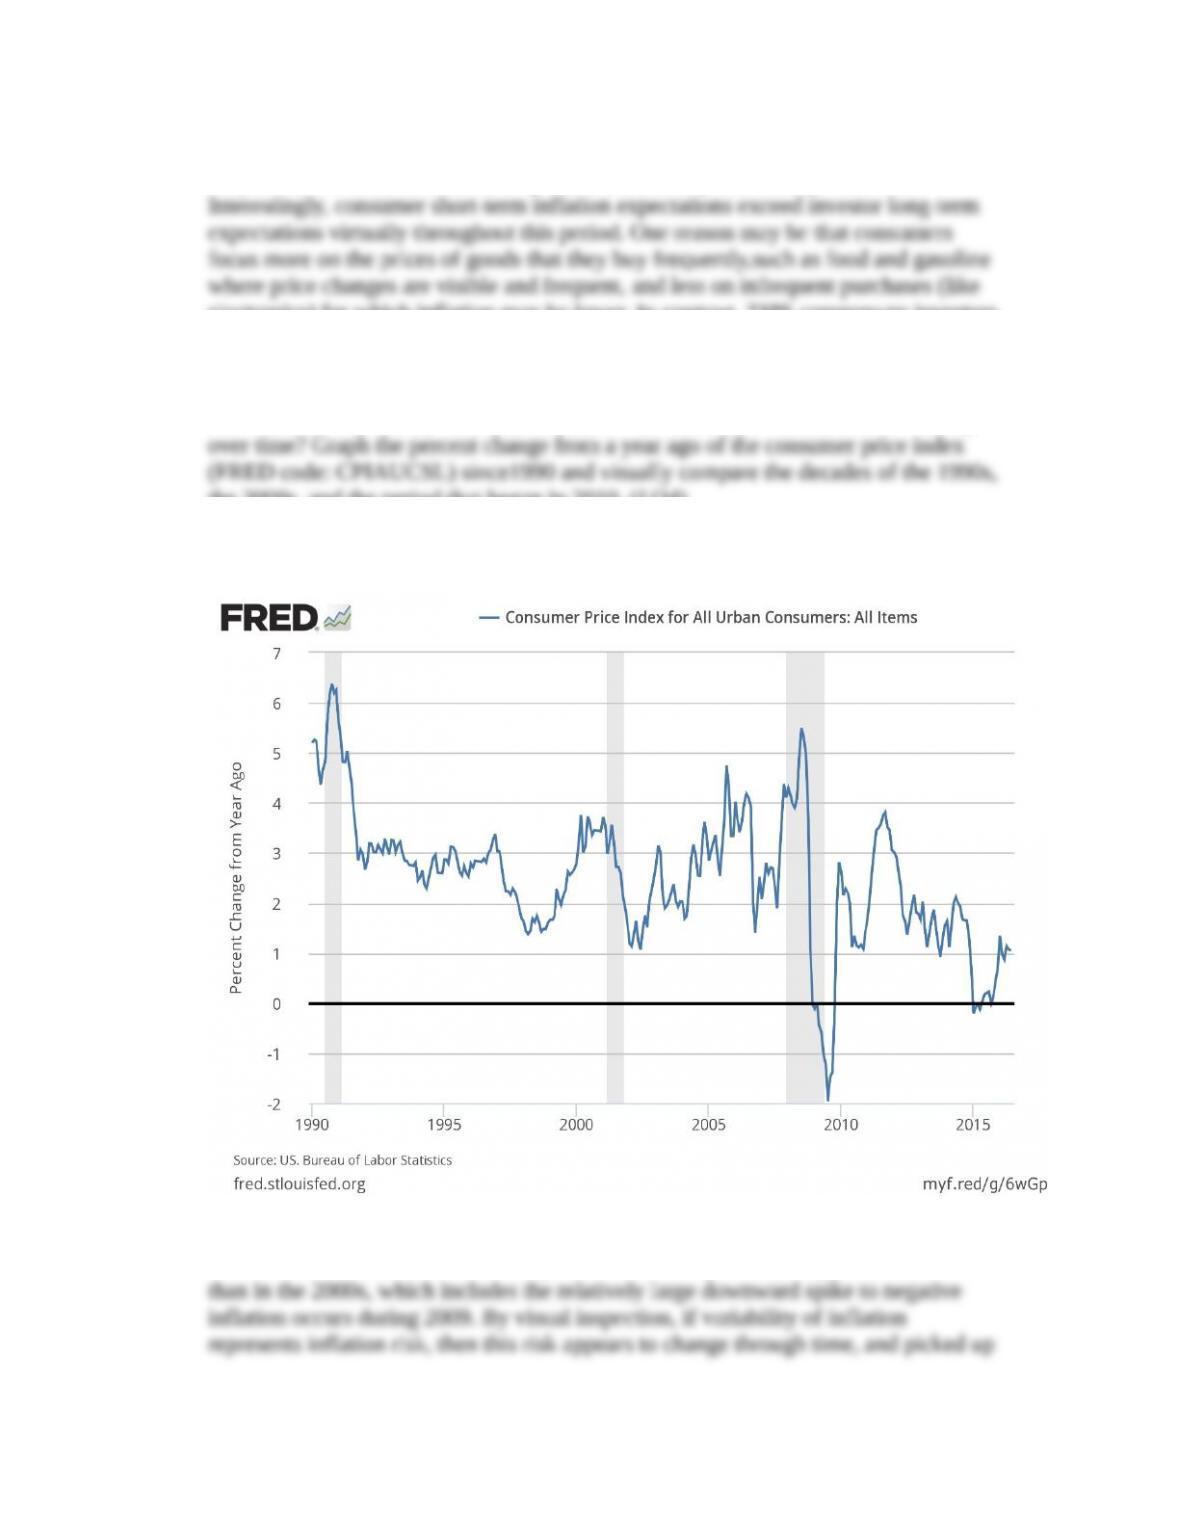
3. How does the variability of annual inflation – an indicator of inflation risk – change
the 2000s, and the period that began in 2010. (LO4)
Answer: The data plot is:
After inflation declines to around 3 percent in the early 1990s, it appears less variable

temporarily during the financial crisis of 2007-2009. Even ignoring the Great
Recession, inflation variability since 2000 appears higher than in the 1990s.
4. Download the data from the graph you produced in Data Exploration Problem 3.
Problem 3. (LO4)
Answer: The standard deviation from 1990 through 1999 is 1.13. From 2000 through
2009, it is 1.42, but this masks a lower standard deviation of 0.84 from 2000 through
the visual assessment in Data Exploration Problem 3.
5. Economists sometimes exclude food and energy prices from the “headline” consumer
price index and use the resulting “core” price measure to assess inflation prospects.
For the period since 1990, plot on one graph the percent change from a year ago of
the consumer price index (FRED code: CPIAUCSL) and the percent change from a
year ago of the consumer price index excluding food and energy (FRED code:
Answer: The data plot is:
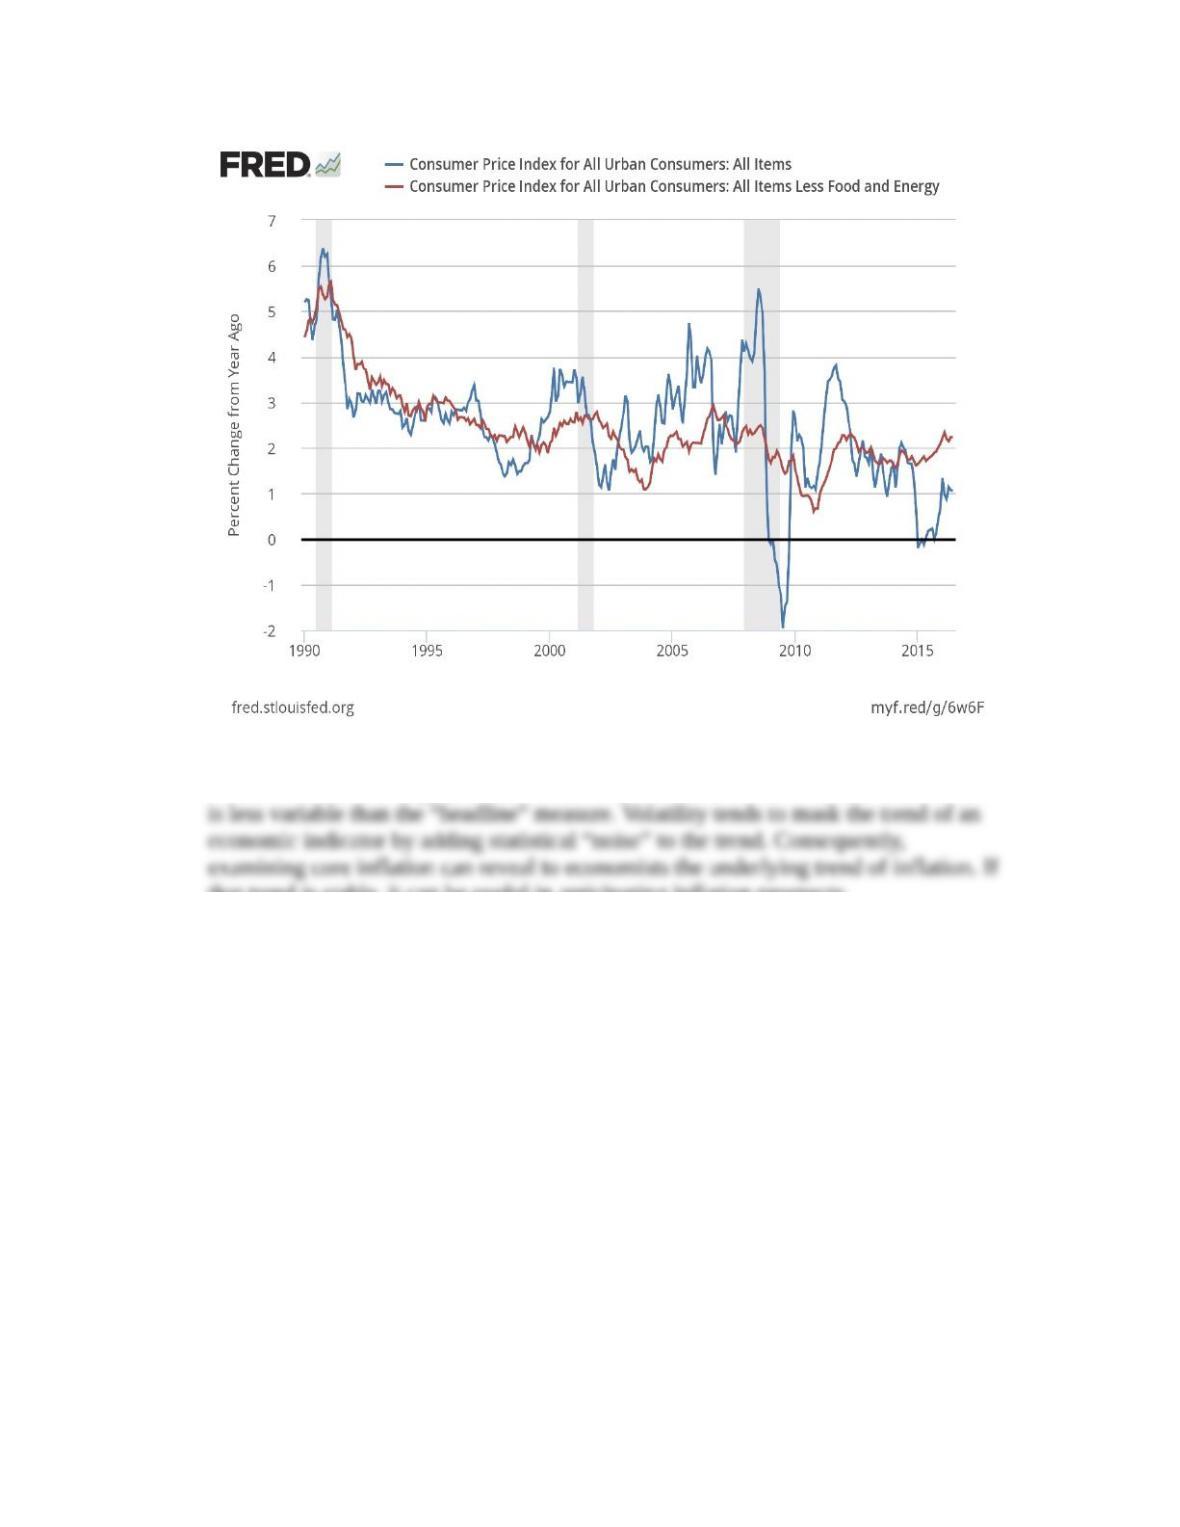
Because food and energy prices are relatively volatile, the “core” measure of inflation
that trend is stable, it can be useful in anticipating inflation prospects.
* indicates more difficult problems