If you borrow an additional $1,000, the expected value = 0.5($1,600-$1,000) +
1800−¿
¿
0 .5¿
√
¿
If you borrowed $2,000 to invest a total of $3,000, the expected value =
0.5($2,400-$2,000) + 0.5($4,200-$2,000) = $1,300 or 30%. You have tripled the
outcome, the payoff would be $800 ×5 – $4,000 – just enough to repay the loan. You
would lose all of your own $1,000.
10. Consider two possible investments whose payoffs are completely independent of one
investments? Explain your answer. (LO5)
Answer: Yes. Even though the investments have the same standard deviation, by
spreading your $1,000 across both of them, you reduce your risk. Intuitively, you are
Mathematically, the variance of the payoffs is halved.
11. *Suppose, as in Problem 17, that there were ten independent investments available
investments rather than two? (LO5)
Answer: Yes. The gains from spreading would be larger if you spread the $1000
inversely related to the number of independent investments,, n.
12. You are considering three investments, each with the same expected value and each
with two possible payoffs. The investments are sold only in increments of $500. You
investment strategy will minimize your risk? (LO5)
Answer: You should put $500 into each of B and C. Because one pays off when the
investment but would not eliminate it.
13. In which of the following cases would you be more likely to decide whether to take
on the risk involved by looking at a measure of the value at risk? (LO2)
a) You are unemployed and are considering investing your life savings of
$1,000 investment in stock of a well-established, stable company.
Explain your reasoning.
Answer: You should be more concerned about the value at risk – a measure of the
investment lost all its value, the outcome would not be catastrophic.
21. You have the option to invest in either country A or country B but not both. You carry
out some research and conclude that the two countries are similar in every way except
Which country would choose to invest in and why? (LO5)
Answer: You should invest in country B as the benefits from diversification are
lower.
22. In June 2016, the United Kingdom (U.K.) held a referendum on whether the country
should remain a member of the European Union (EU). A decision to leave the EU
business owner in the United Kingdom around this time. (LO3, LO4, LO5)
a. Ahead of the vote, as what kind of risk would you classify the possibility of a vote
for Brexit? Why?
b. Do you think a strategy to reduce this risk through hedging or spreading risk
Answer:
a. The prospect that the U.K. would vote to leave the European Union and suffer a
b. Hedging and spreading risk are strategies that can be employed to manage
idiosyncratic risks, but not systematic risk. Given the economy-wide
23. Consider again the U.K. referendum on membership of the European Union (EU)
referred to in question 22, but this time from the perspective of an international
even benefit from a Brexit vote. (LO3, LO5)
a. Why might you demand a relatively higher return on U.K. investments ahead of
the vote?
b. What strategy might you employ to reduce the risk associated with your U.K.
investments?
Answer:
a. Core principle 2 tells us that risk requires compensation. A higher return
vote.
b. While the vote on Brexit represented a systematic risk from the perspective of the
U.K. economy, from a global perspective it could be viewed as more of an
correlated) also could help reduce risk.
Data Exploration
1. Plot the percentage change from a year ago of the Wilshire 5000 stock index at a
monthly frequency (FRED code: WILL5000PR). Visually, has the risk of the Wilshire
5000 index changed over time? (LO2)
Answer: Visual examination of the plot below does not show any obvious change in
the risk.
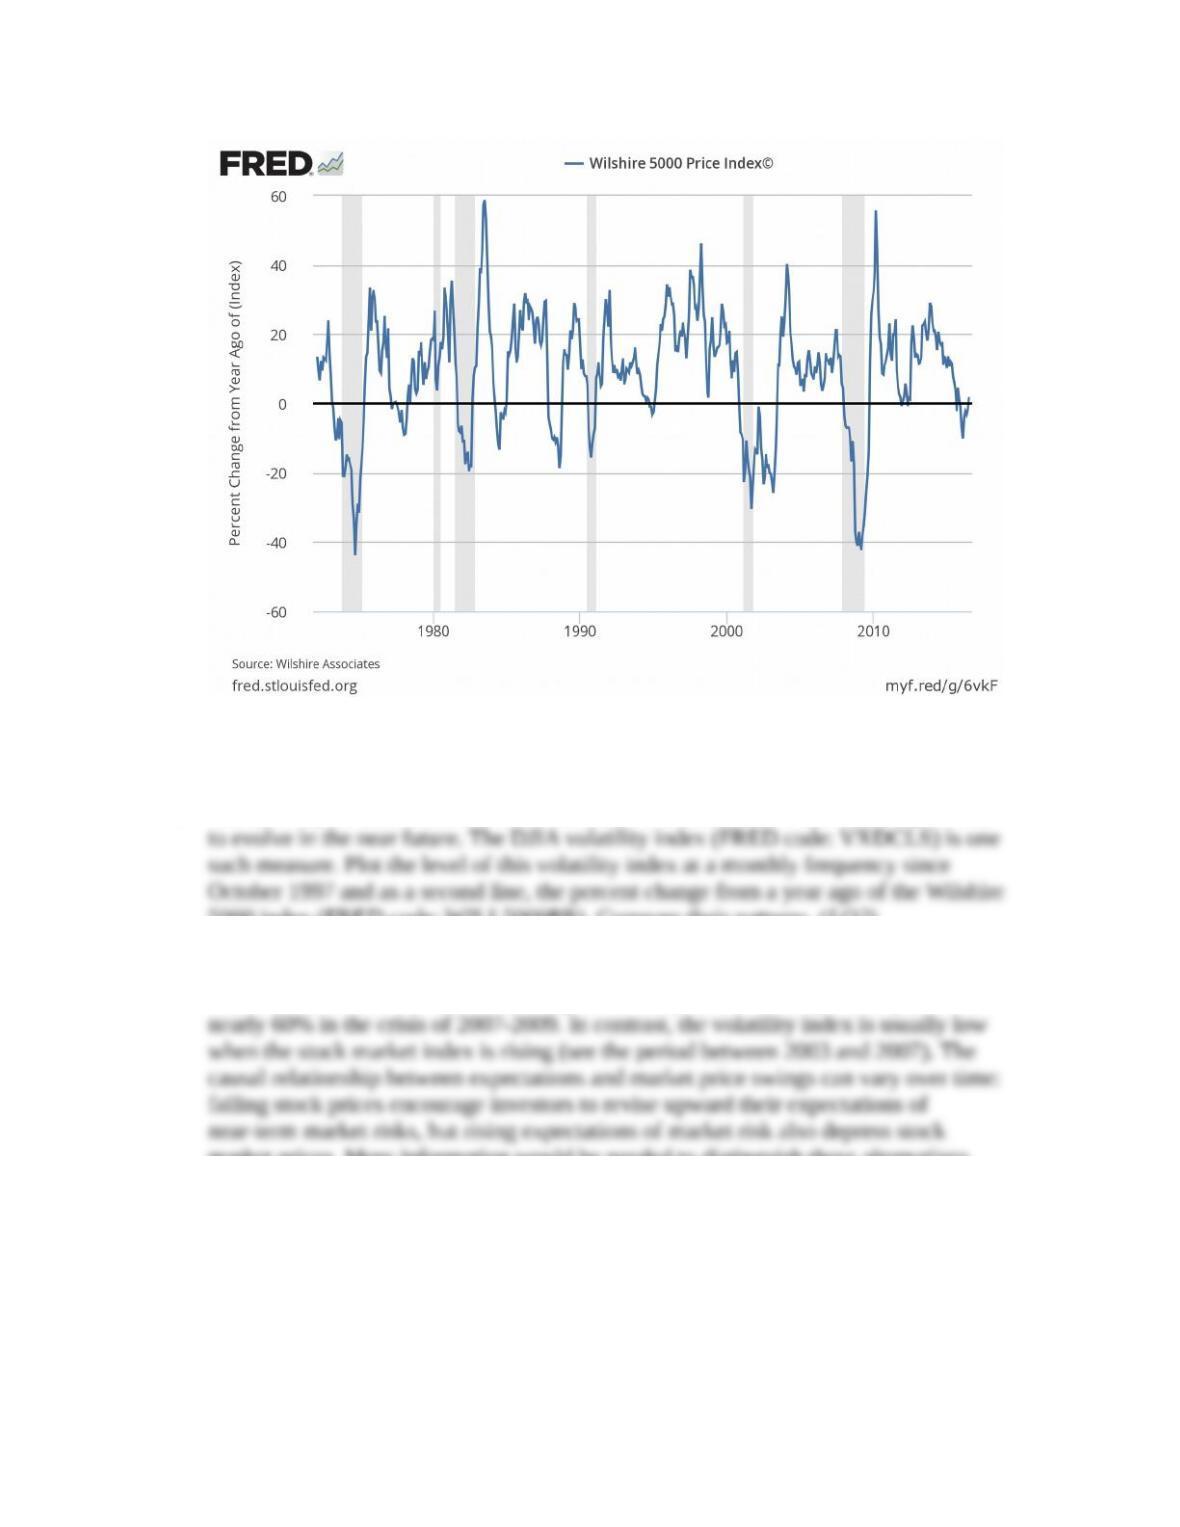
Wilshire Associates, Wilshire 5000 Price Index© [WILL5000PR], retrieved from FRED, Federal Reserve Bank of
St. Louis; https://fred.stlouisfed.org/series/WILL5000PR.
2. Another way to understand stock market risk is to examine how investors expect risk
5000 index (FRED code: WILL5000PR). Compare their patterns. (LO2)
Answer: The plot shows several spikes in the DJIA volatility index, usually in periods
when the Wilshire 5000 index is falling. For example, the volatility index peaked at
market prices. More information would be needed to distinguish these alternatives.
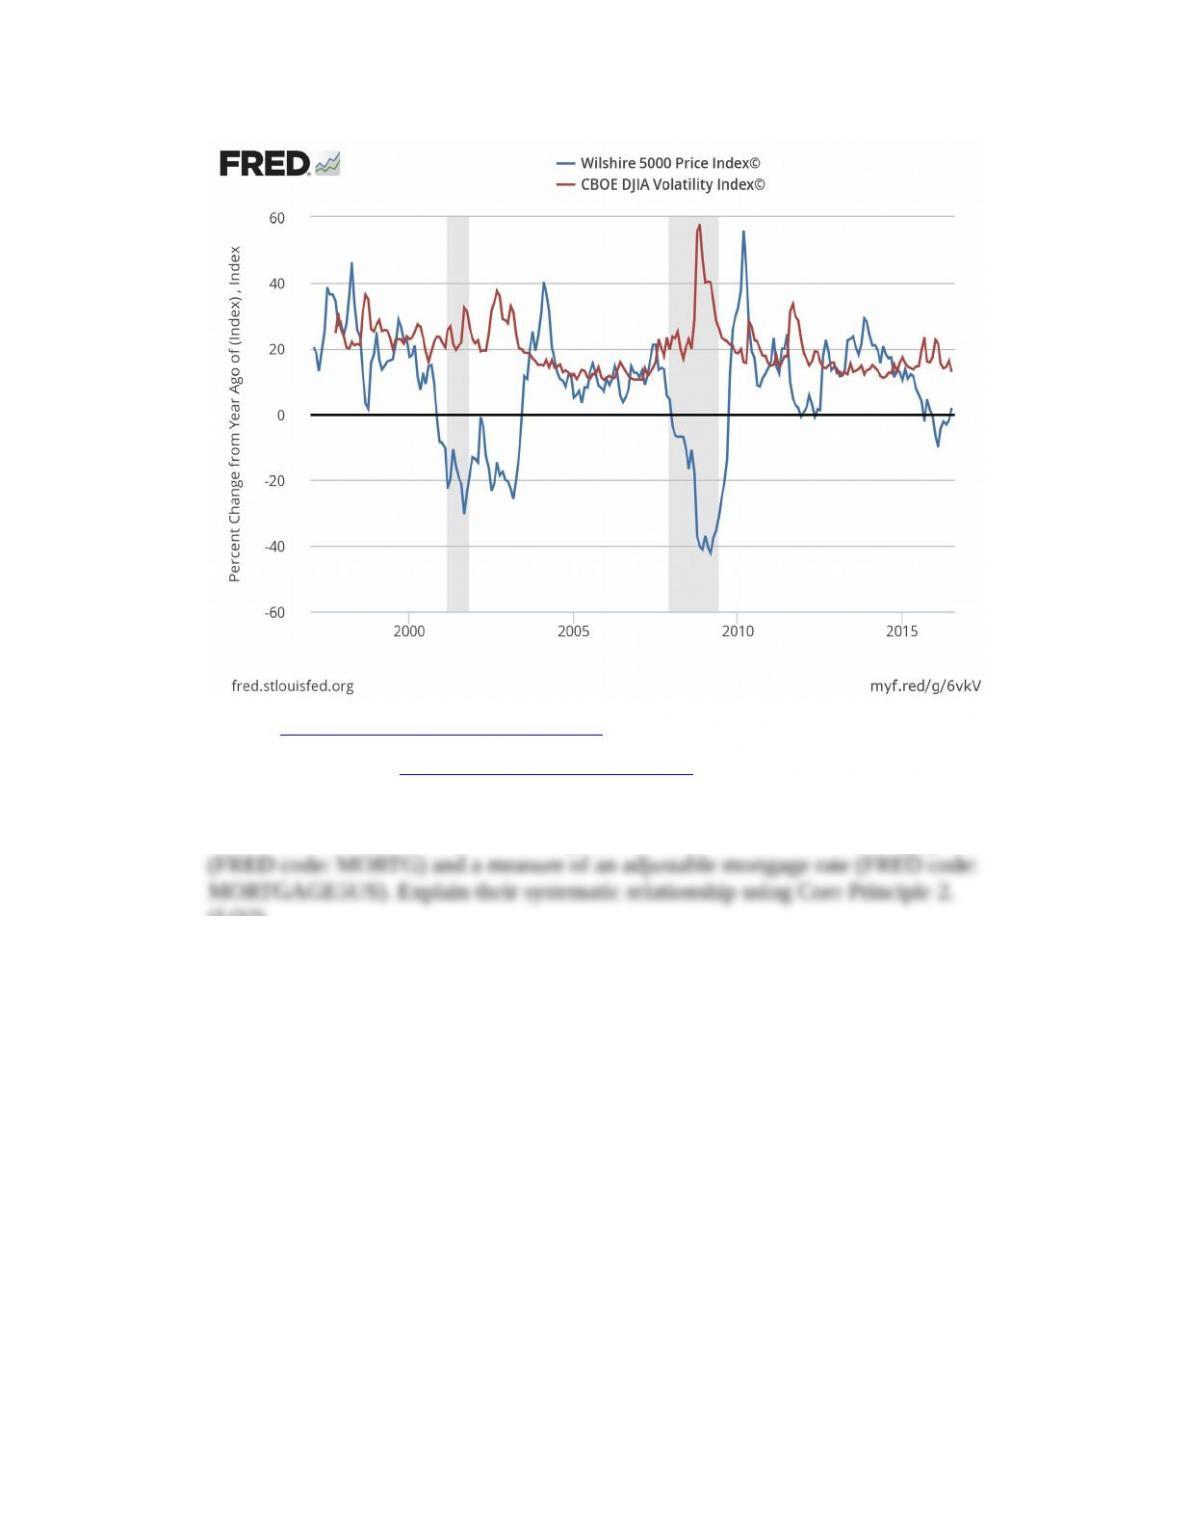
Wilshire Associates, Wilshire 5000 Price Index© [WILL5000PR], retrieved from FRED, Federal Reserve Bank of
St. Louis; https://fred.stlouisfed.org/series/WILL5000PR.
Chicago Board Options Exchange, CBOE DJIA Volatility Index© [VXDCLS], retrieved from FRED, Federal
Reserve Bank of St. Louis; https://fred.stlouisfed.org/series/VXDCLS.
3. For the period since 2005, plot on one graph the 30-year conventional mortgage rate
(LO2)
Answer: The plots of the 30-year and adjustable rates are:
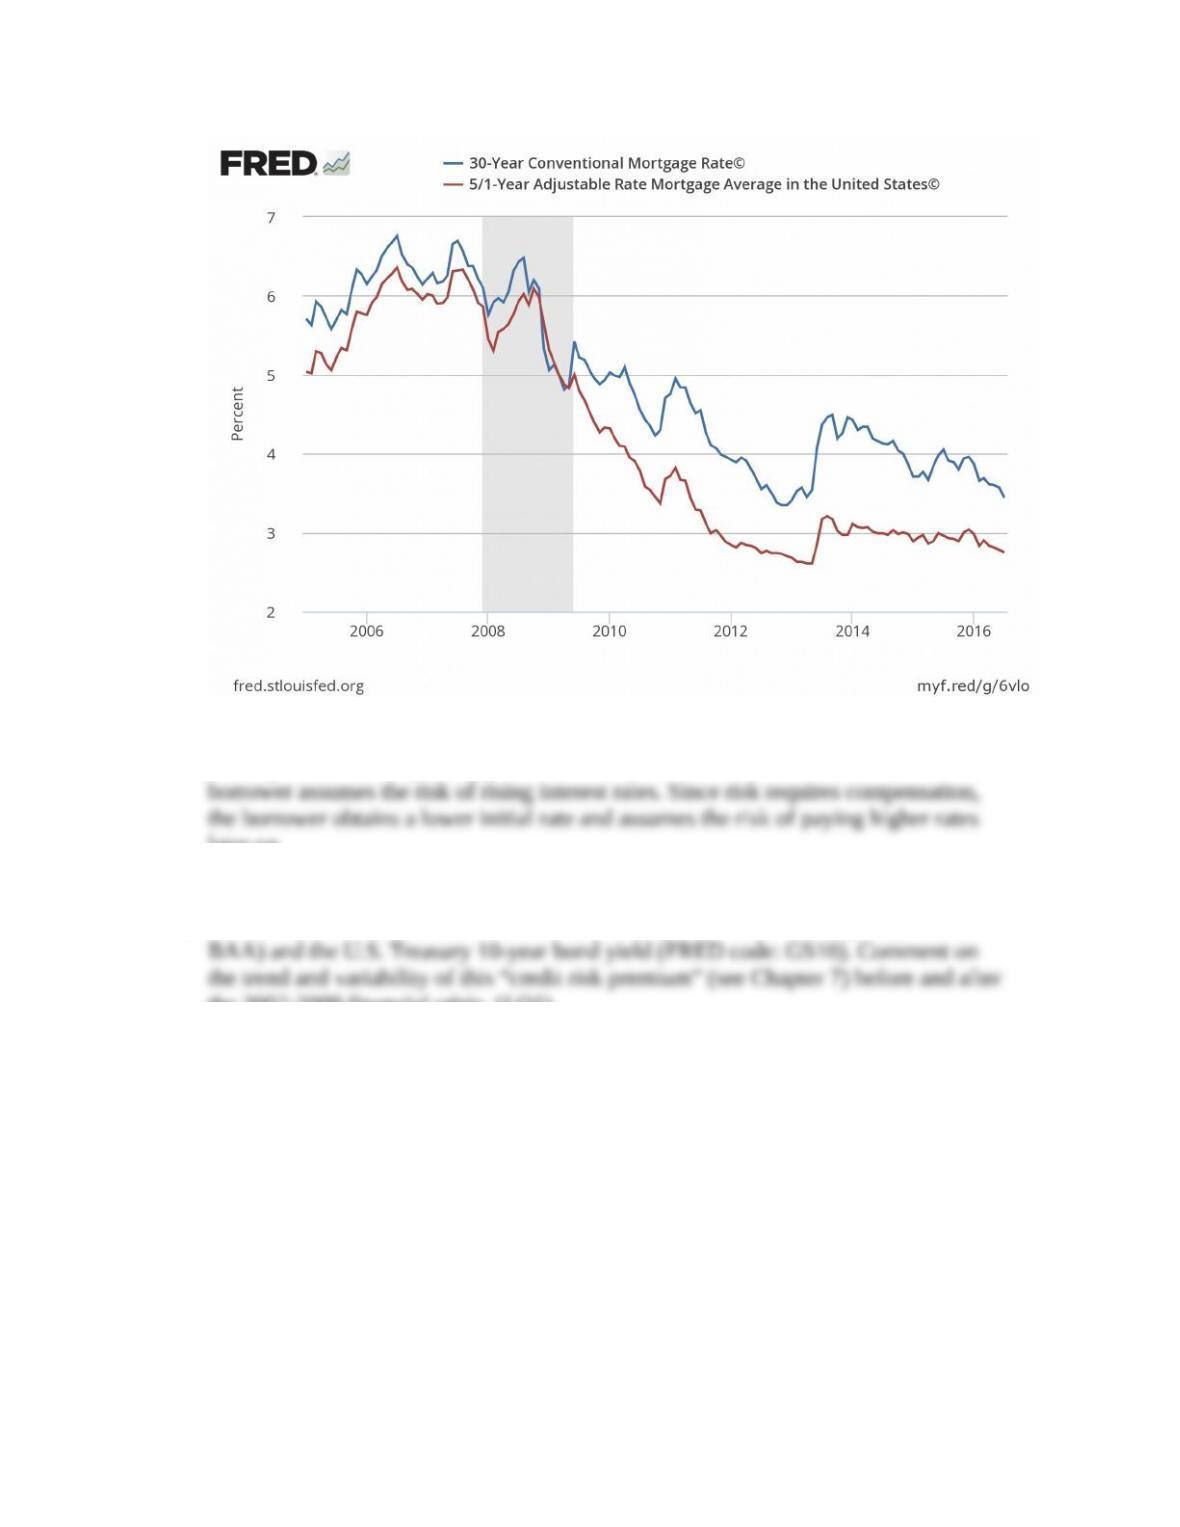
The adjustable rate is generally below the 30-year conventional rate since the
later on.
4. Plot the difference since 1979 between the Moody’s Baa bond index (FRED code:
the 2007-2009 financial crisis. (LO1)
Answer: The data plot is:
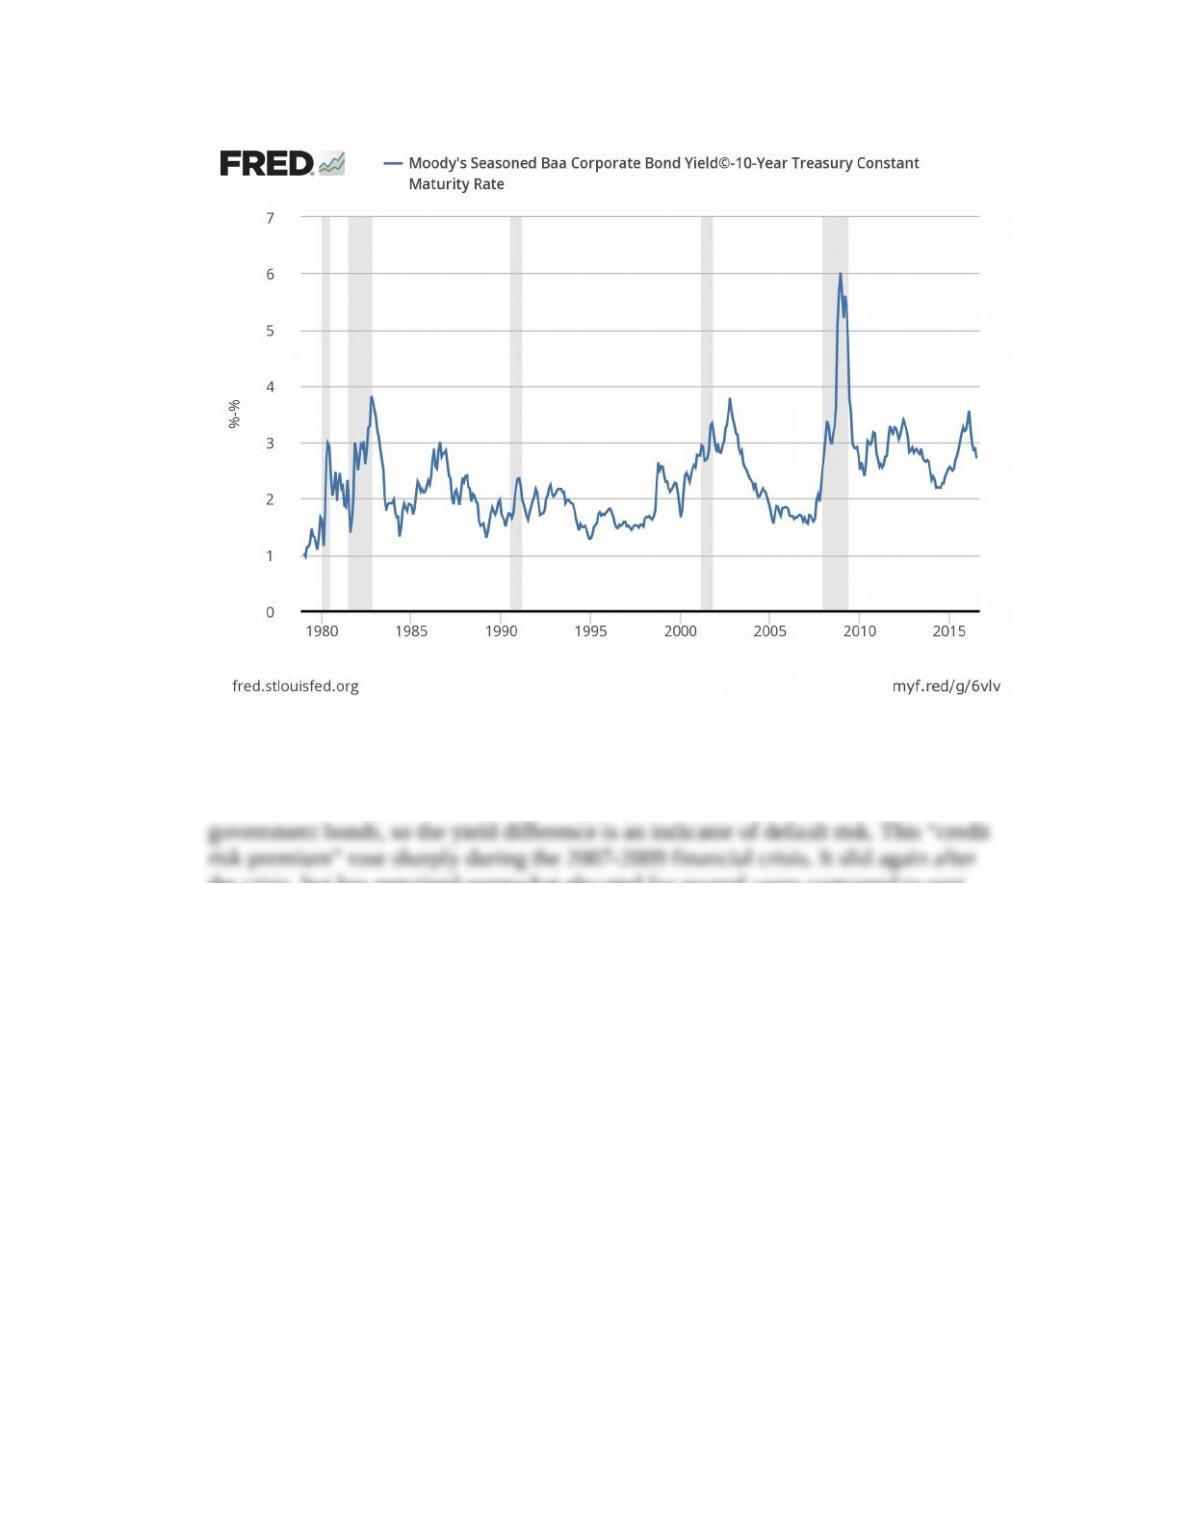
Moody’s Seasoned Baa Corporate Bond Yield©, copyright, 2016, Moody’s Investor Services, retrieved from
FRED, Federal Reserve Bank of St. Louis; https://fred.stlouisfed.org/series/DBAA.
Baa bonds are corporate issues with a higher probability of default than for
the crisis, but has remained somewhat elevated for several years compared to past
periods of economic expansion.
* indicates more difficult problems