1. *Suppose there is an unexpected slowdown in the rate of productivity growth in
the economy so that forecasters consistently overestimate the growth rate of GDP.
If the central bank bases its policy decisions on the consensus forecast, what
would be the likely consequences for inflation assuming it maintains its existing
inflation target? (LO2)
Answer: Suppose, for example, the consensus forecast was for positive
productivity growth while actual productivity growth was zero, resulting in no
change to the position of the LRAS curve. Thinking the LRAS curve was shifting
2. Suppose the policy interest rate controlled by the central bank and the inflation
rate were both zero. Explain in terms of the aggregate demand–aggregate supply
framework how the economy could fall into a deflationary spiral if it were hit by a
negative aggregate demand shock. (LO2)
Answer: A negative aggregate demand shock shifts the aggregate demand curve to
the left, leading in the short run to output falling below potential output. In the
absence of a policy response, this will eventually put downward pressure on
prices. Starting with a situation where the nominal interest rate and the inflation
rate are both zero, there cannot be a conventional monetary policy response to the
3. *Use the aggregate demand–aggregate supply framework to show how a boom in
equity prices might affect inflation and output in the short run. Describe the
long-run impact on inflation and output: (a) if the central bank implicitly allows
its inflation target to rise and (b) if it retains its original inflation target. (LO2)
Answer: The boom in equity prices would increase consumer wealth, boosting
consumption. It would make financing cheaper for firms, boosting investment.

If the central bank does not take offsetting action to counter the demand curve
shift, it is implicitly raising its inflation target. In this case, the SRAS curve would
If the central bank maintained its original inflation target, monetary policy would
tighten sufficiently to offset the initial shift in aggregate demand to AD’, returning
4. Compare the impact of a given change in monetary policy in two economies that
are similar in every way except that in Economy A the financial system has a large
shadow banking system providing many alternatives to bank financing, while in
Economy B bank loans account for almost all of the financing in the economy.
(LO1)
Answer: Given the reliance on bank loans in Economy B, the bank-lending
5. Suppose that the anemic growth in the U.S. economy following the financial crisis
of 2007–2009 was a result of “secular stagnation.” Use the Fisher equation to
explain why raising the central bank’s inflation target could help boost economic
growth in circumstances where nominal interest rates are close to the effective
lower bound. (LO2)
Inflation
Output
LRAS
SRAS
AD
Y*
πT
AD’
B
C
A
SRAS’
Answer: The Fisher equation links the nominal interest rate, the real interest rate
and expected inflation according to the equation
6. If the anemic growth experienced in the U.S. economy since the financial crisis
primarily reflects slower growth of the labor force and slowing technological
innovation, can monetary policy be used to address the problem? (LO2)
Answer: No. For the most part, these factors (which influence aggregate supply)
are not driven by aggregate demand. In the context of the AD/AS model,
7. In which of the following economies do you think the bank lending channel
would play a more important role, everything else being equal:
a) an economy dominated by large, financially sophisticated firms
b) an economy consisting of a large number of small firms.
Explain your choice. (LO1)
Answer: The bank lending channel is likely to play a more important role in b).
Data Exploration
1. In conducting monetary policy, the European Central Bank (ECB) must balance
the needs of euro-area countries with differing economic conditions. Plot since
1990 the yield spread between government bonds in Italy (FRED code: INTGS-
BITM193N) and Germany (FRED code: INTGSBDEM193N), along with the
yield spread between government bonds in Spain (FRED code: INTGS-
BESM193N) and Germany. Discuss the yield spreads after 2008 and explain how
they reflect policy challenges for the ECB. (LO2)
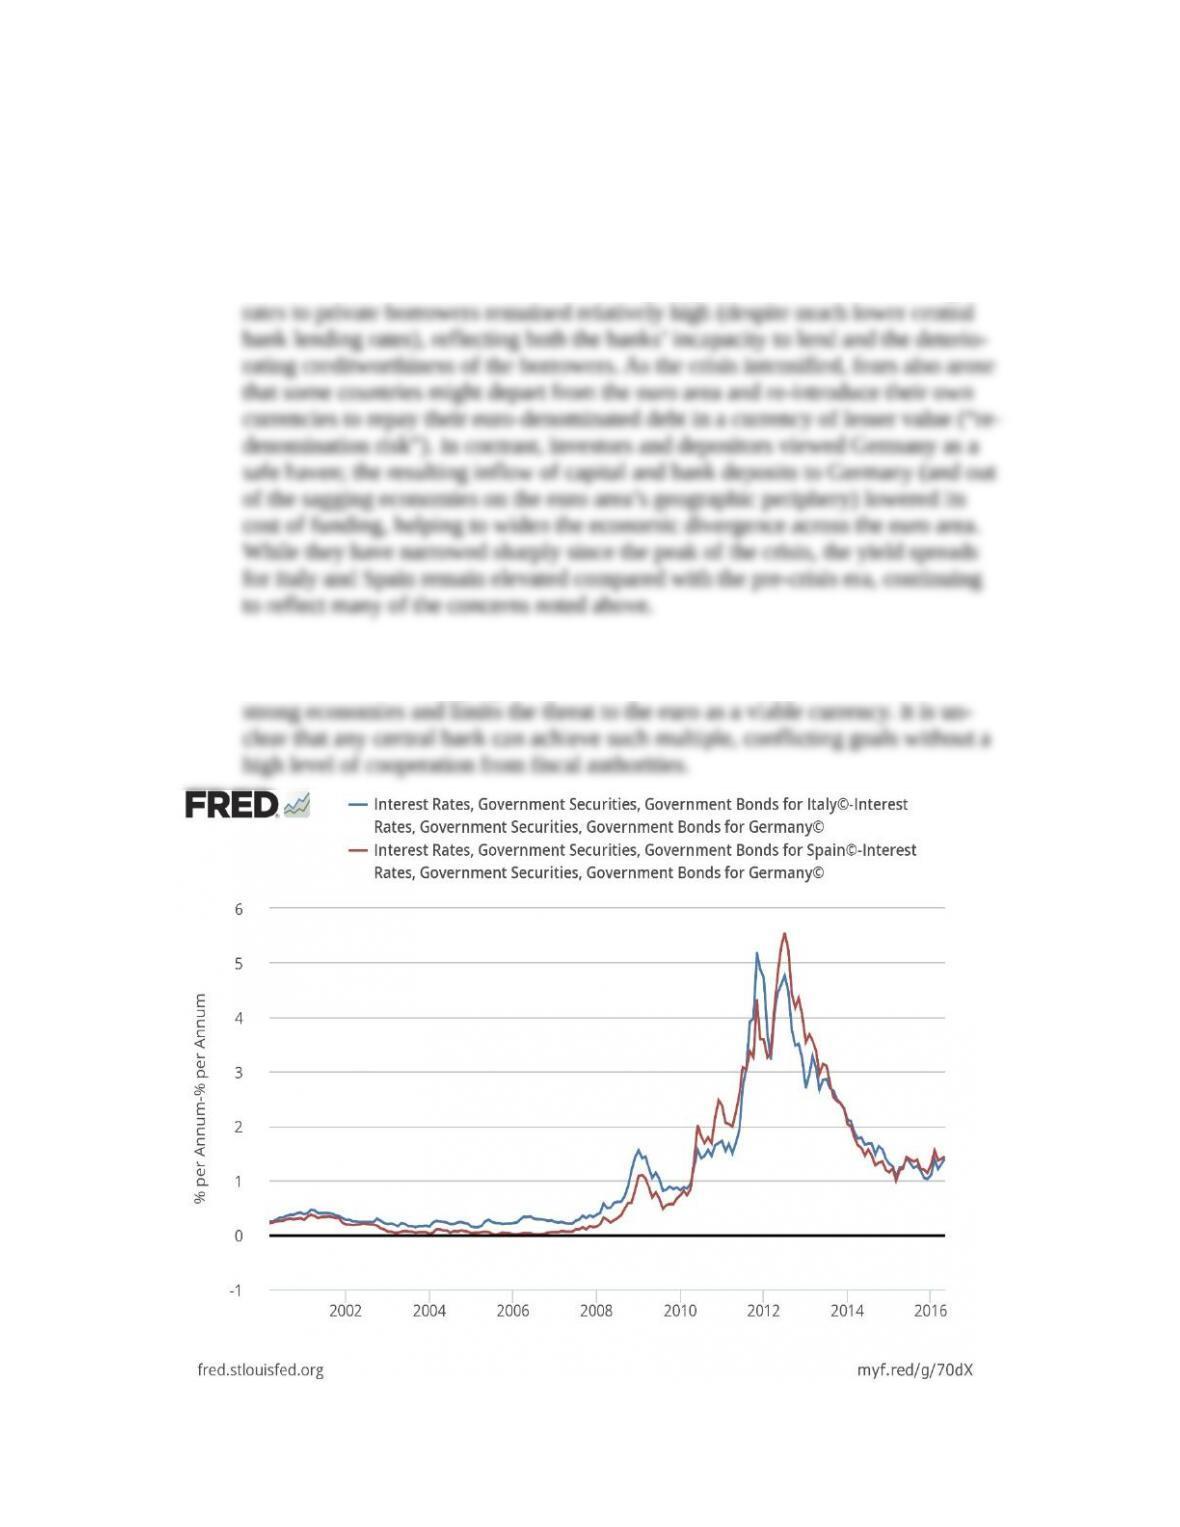
Answer: The data are plotted below. Prior to the euro-area financial crisis, the
yields on government bonds were nearly identical across the countries of the euro
area. During the crisis, however, concerns emerged about the risks of default on
the part of some governments (including Greece, Ireland, Italy, Portugal, and
Spain) and about the solvency of their banking systems as their economies de-
clined. In these countries, even as the ECB policy rate declined, bank lending
The challenge for the ECB is to maintain price stability while designing a policy
that addresses the diverging economic and financial conditions in both weak and
International Monetary Fund, Interest Rates, Government Securities, Government Bonds for Germany© [INTGSB-
DEM193N], retrieved from FRED, Federal Reserve Bank of St. Louis; https://fred.stlouisfed.org/series/INTGSB-
DEM193N.
International Monetary Fund, Interest Rates, Government Securities, Government Bonds for Italy© [INTGSBIT-
M193N], retrieved from FRED, Federal Reserve Bank of St. Louis; https://fred.stlouisfed.org/series/INTGSBIT-
M193N.
International Monetary Fund, Interest Rates, Government Securities, Government Bonds for Spain© [INTGS-
BESM193N], retrieved from FRED, Federal Reserve Bank of St. Louis; https://fred.stlouisfed.org/series/INTGS-
BESM193N.
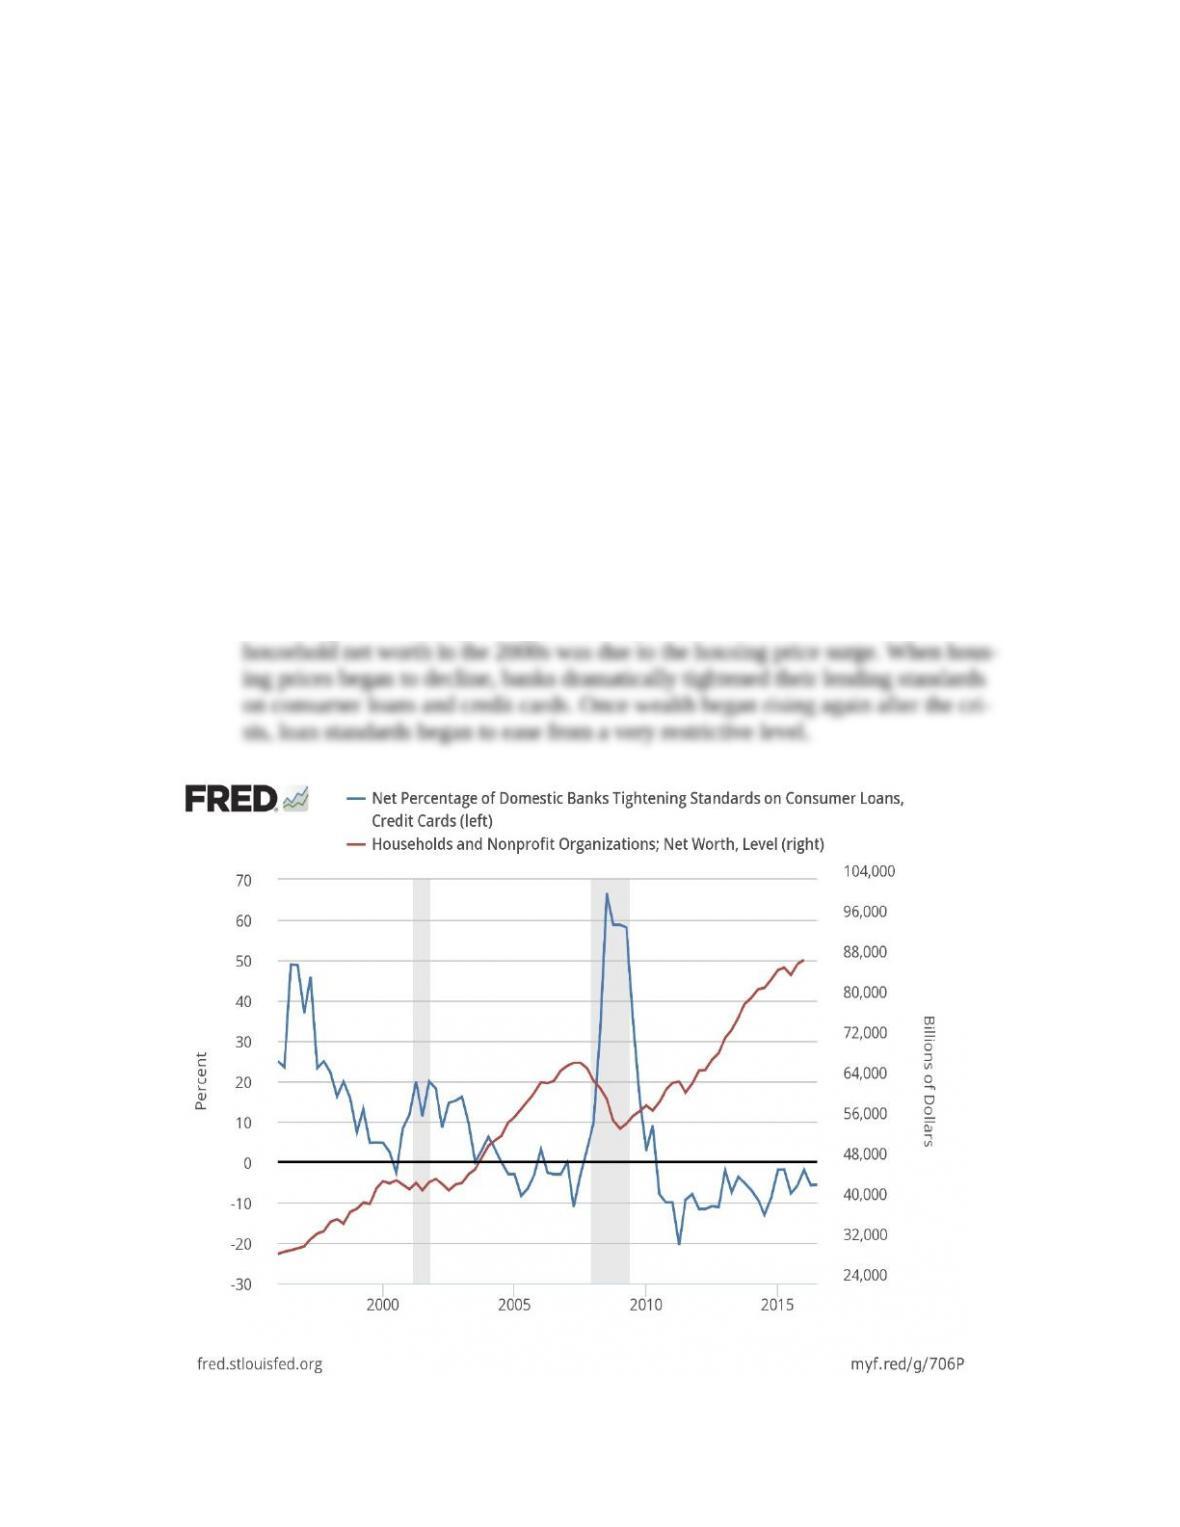
2. How important is the balance sheet channel of monetary policy? Plot since 1996
the net tightening of credit standards for consumer and credit card loans (FRED
code: DRTSCLCC) and (on the right scale) household net worth (FRED code:
TNWBSHNO). Do banks adjust lending conditions when household balance
sheets improve or deteriorate? (LO1)
Answer: Prior to the onset of the financial crisis of 2007-2009, rising net worth
generally was associated with a loosening of lending standards. From the lender’s
perspective, higher net worth means that a borrower is more creditworthy and that
borrowing to increase spending is less risky. However, much of the increase in
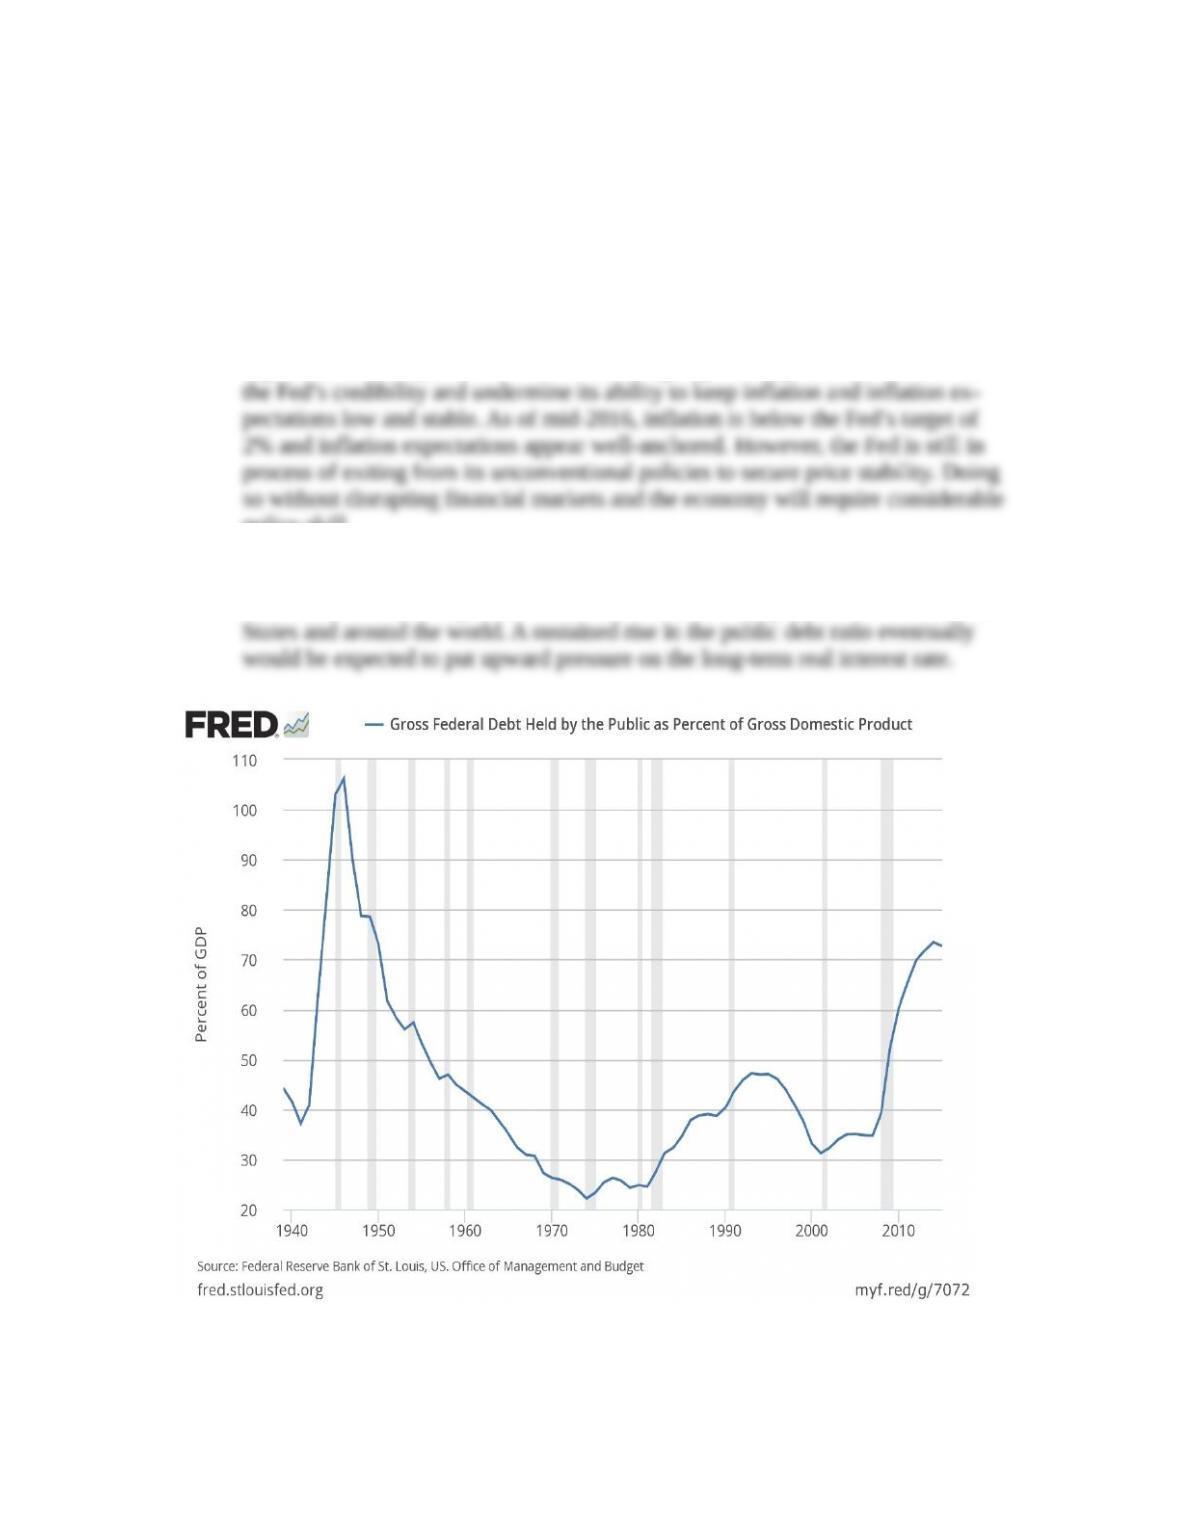
3. Among the challenges facing central banks around the world is the elevated level
of public debt. Plot U.S. federal debt held by the public as a percent of gross do-
mestic product (FRED code: FYPUGDA188S) and discuss the problems that gov-
ernment debt could pose for the Federal Reserve in the future. (LO2)
Answer: The data are plotted below. The key issue is whether the Federal Reserve
will come under political pressure to monetize the debt. As an independent central
bank, the Fed can resist this pressure up to a point, but Congress and the President
together can modify the Fed’s charter. Bowing to political pressure would harm
policy skill.
Separately, the long-term real interest rate, which is determined by economic fun-
damentals rather than by the Federal Reserve, is unusually low both in the United
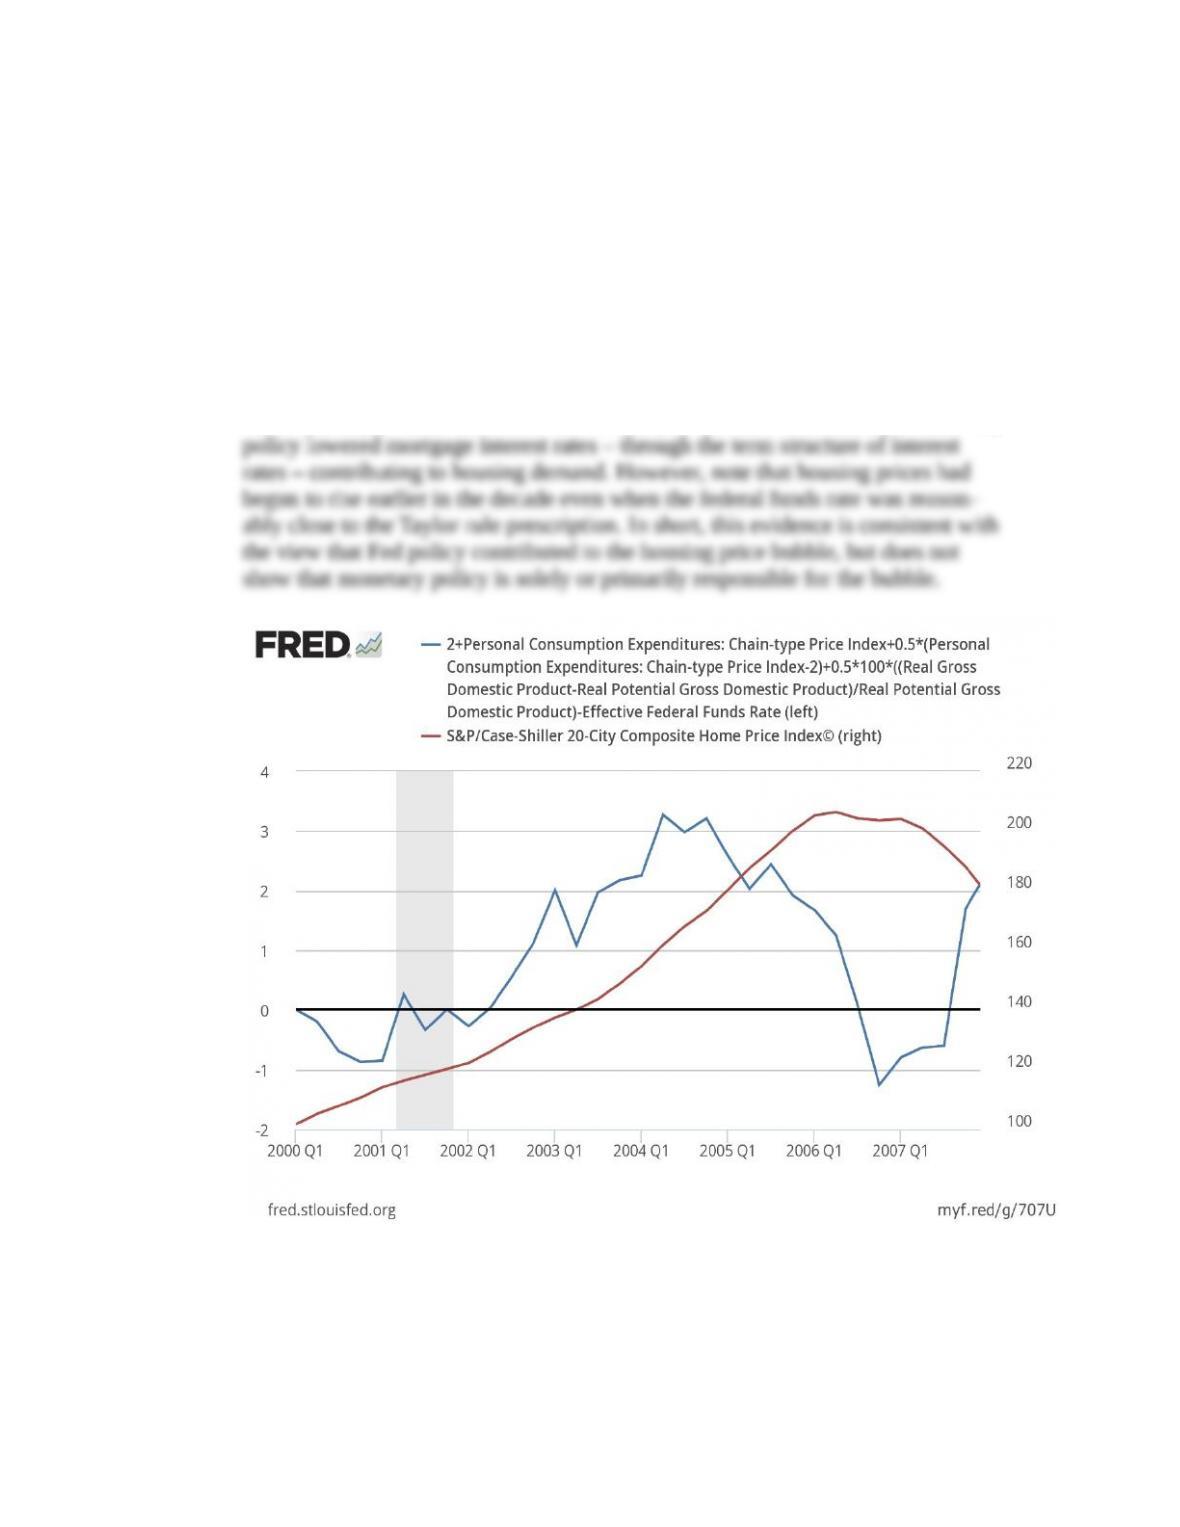
4. *Some critics argue that the Federal Reserve stoked the housing price bubble after
2000 by keeping monetary policy too stimulative. To investigate, first plot from
2000 to 2007 on a quarterly basis the Taylor rule gap – the difference between the
Taylor rule as described in Chapter 18, Data Exploration Problem 1, and the fed-
eral funds rate. Add to this plot on the right scale an index of U.S. housing prices
(FRED code: SPCS20RSA). Does the evidence support the critics’ claim? What
other evidence might be sought? (LO1)
Answer: The data, plotted below, shows that U.S. urban housing prices more than
doubled in this period. It also shows that the FOMC set the federal funds rate well
below the Taylor Rule after 2002 for several years. This accommodative monetary
S&P Dow Jones Indices LLC, S&P/Case-Shiller 20-City Composite Home Price Index© [SPCS20RSA], re-
trieved from FRED, Federal Reserve Bank of St. Louis; https://fred.stlouisfed.org/series/SPCS20RSA.
*Indicates more difficult problems