1. For each of the following economies, select the term—inflation, deflation, or
disinflation—that best describes what the economy is experiencing. (LO1)
March April May
Annual percent change in the
consumer price index
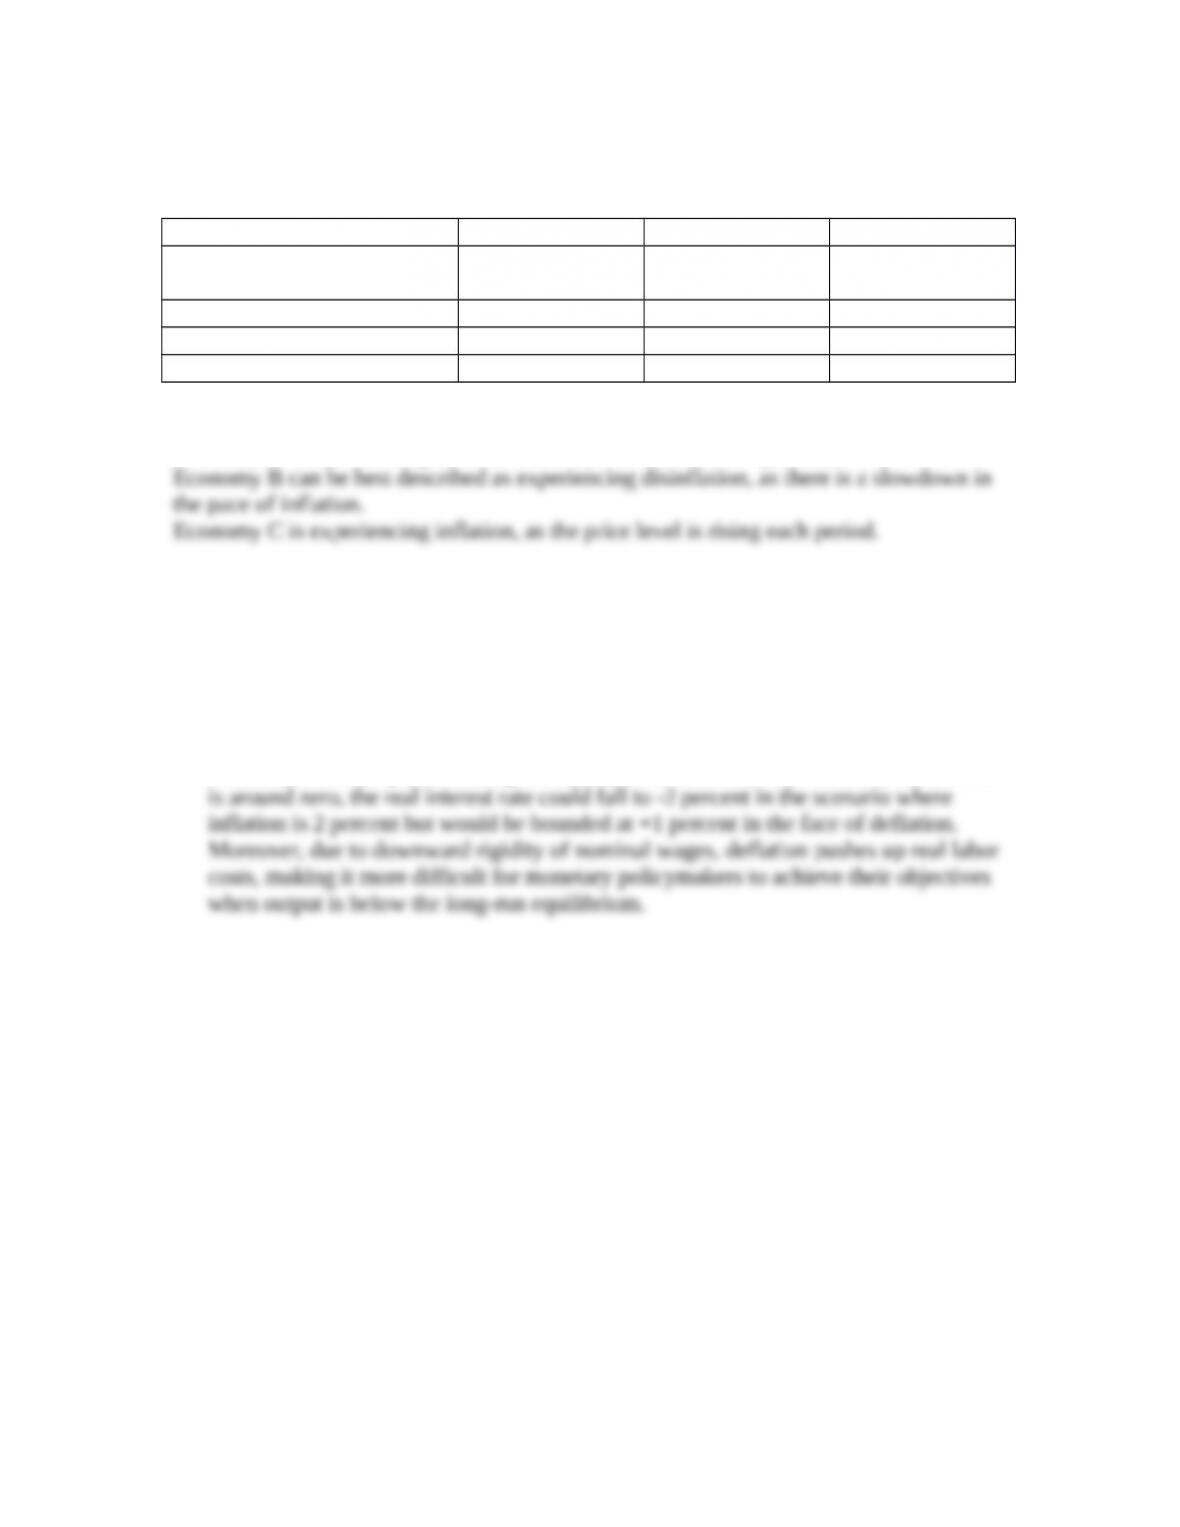
Economy A -1.5% -1.5% -1.5%
Economy B 3.2% 2.3% 0.8%
Economy C 1.5% 1.5% 1.5%
Answer:
Economy A is experiencing deflation, as the price level is falling each period.
2. As a monetary policymaker, would you be more concerned if the aggregate price
level were persistently rising by 2 percent or persistently falling by 1 percent?
Explain your answer. (LO3)
Answer: The deflation scenario, where the price level is falling, should be of more
concern, as conventional monetary policy tools are less effective in the face of
deflation. For example, assuming the effective lower bound on nominal interest rates
Data Exploration
1. Are long-term inflation expectations “well anchored?” Using monthly data since
2003, plot a measure of long-term inflation expectations based on the difference
between the yields on a five-year Treasury bond (FRED code: GS5) and a five-year
Treasury Inflation Protected Securities (TIPS) bond (FRED code: FII5). What do you
conclude? How did the financial crisis of 2007-2009 affect the measure? (LO1)
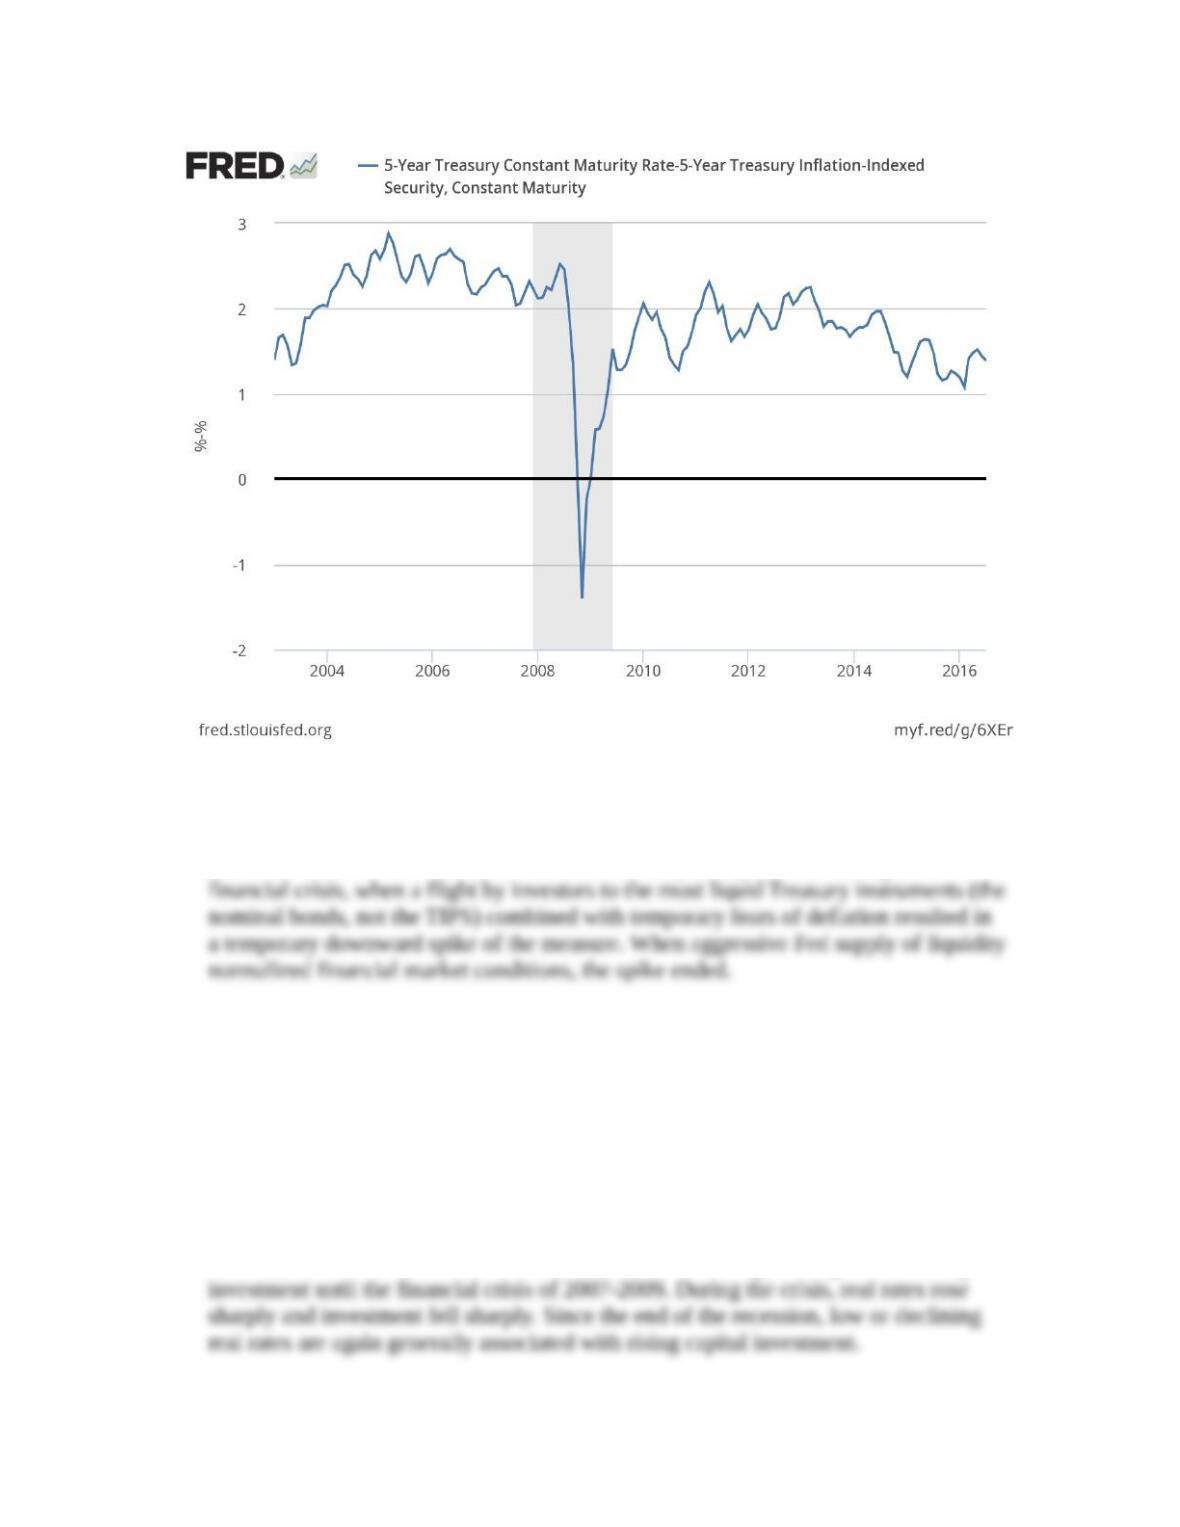
Answer: Based on this measure, long-term inflation expectations were reasonably
consistent with the Fed’s 2-percent inflation target for the decade though mid-2013,
and have drifted down a bit since that time. The key exception was during the
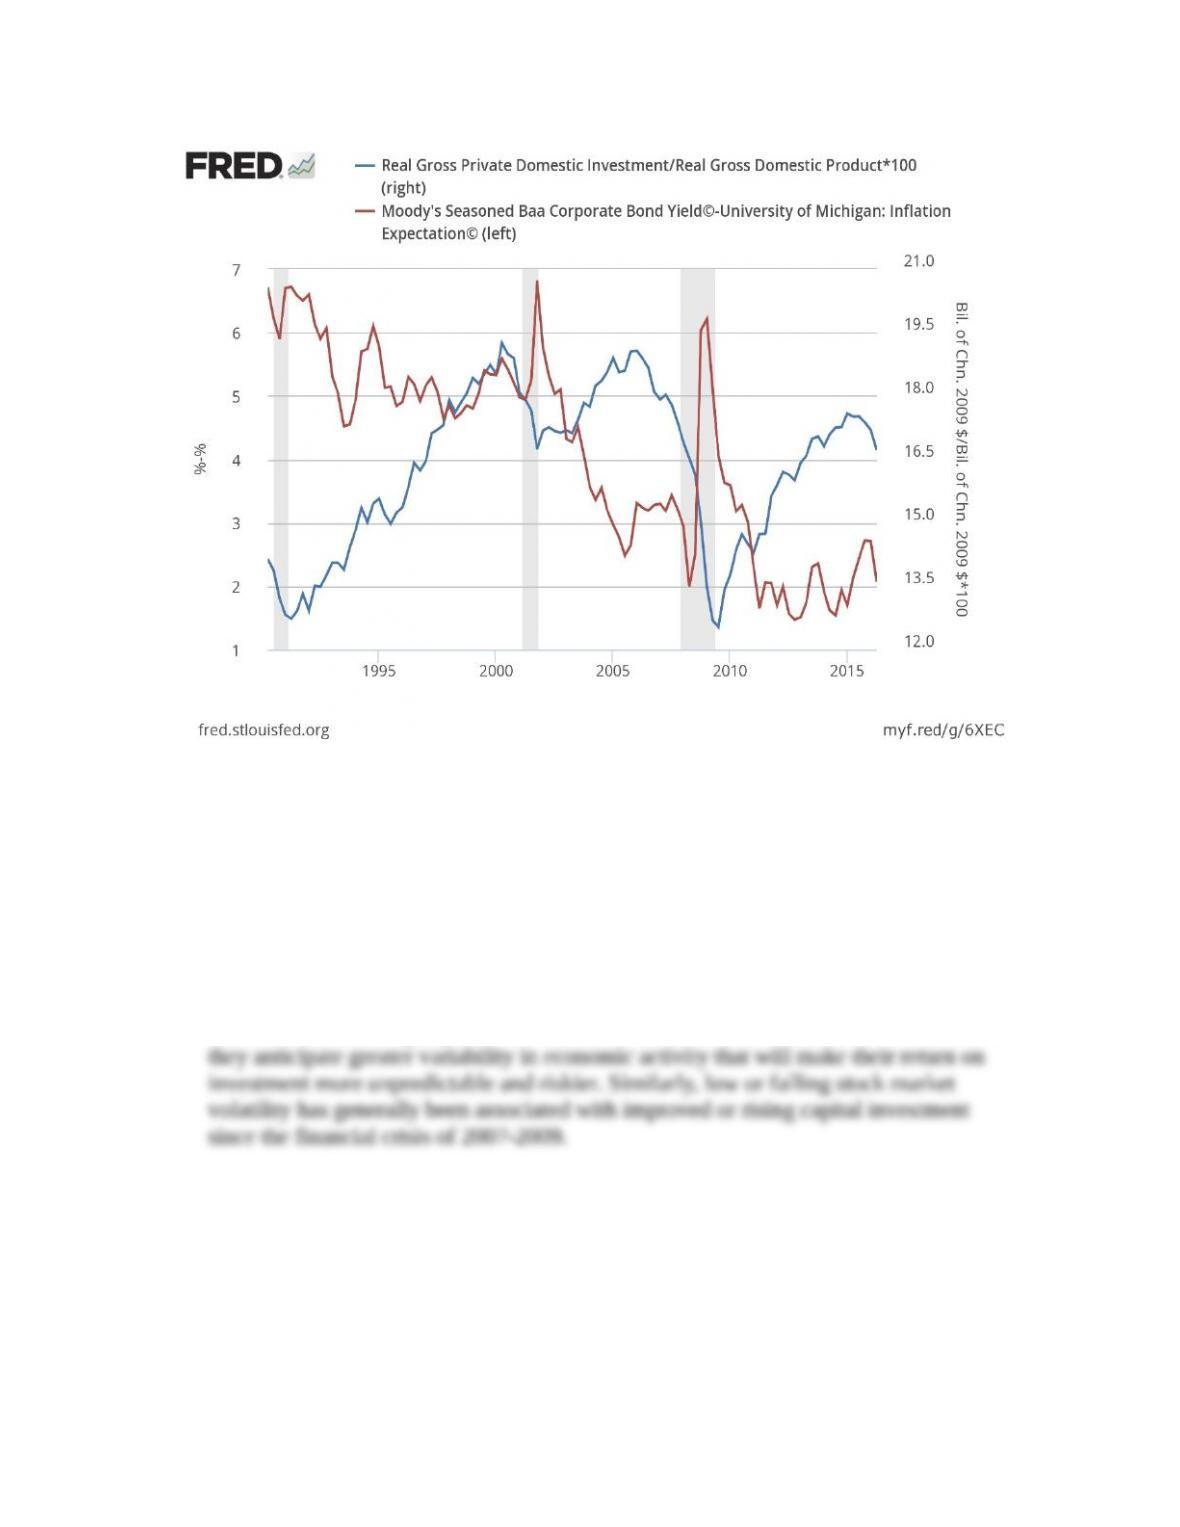
2. Is investment sensitive to the real interest rate? Plot since 1990 a measure of the real
interest rate – based on the difference between Moody’s Baa corporate rate (FRED
code: BAA) and a survey of expected inflation (FRED code: MICH) – and (on the
right scale) the share of investment (FRED code: GPDIC1) in real GDP (FRED code:
GDPC1). Explain the cyclical pattern. (LO2)
Answer: The data are plotted below, where falling real interest rates through the
1990s were associated with rising capital investment. Note that during the recession
of 2001, investment fell as the real interest rate rose. Falling rates again saw rising
Moody’s Seasoned Baa Corporate Bond Yield© [BAA], retrieved from FRED, Federal Reserve Bank of St. Louis;
https://fred.stlouisfed.org/series/BAA. University of Michigan, University of Michigan: Inflation Expectation©
[MICH], retrieved from FRED, Federal Reserve Bank of St. Louis; https://fred.stlouisfed.org/series/MICH.
3. How sensitive is private investment to risk? Plot since 2004 the share of real gross
private domestic investment (FRED code: GPDIC1) in real GDP (FRED code:
GDPC1) and (on the right scale) a measure of anticipated stock market volatility
(FRED code: VIXCLS). Explain the pattern. (LO2)
Answer: The data plot below is for a short horizon, but suggests that expectations of
rising stock market volatility (measured on the basis of stock options prices) are
associated with falling capital investment. Firms become cautious about investment if
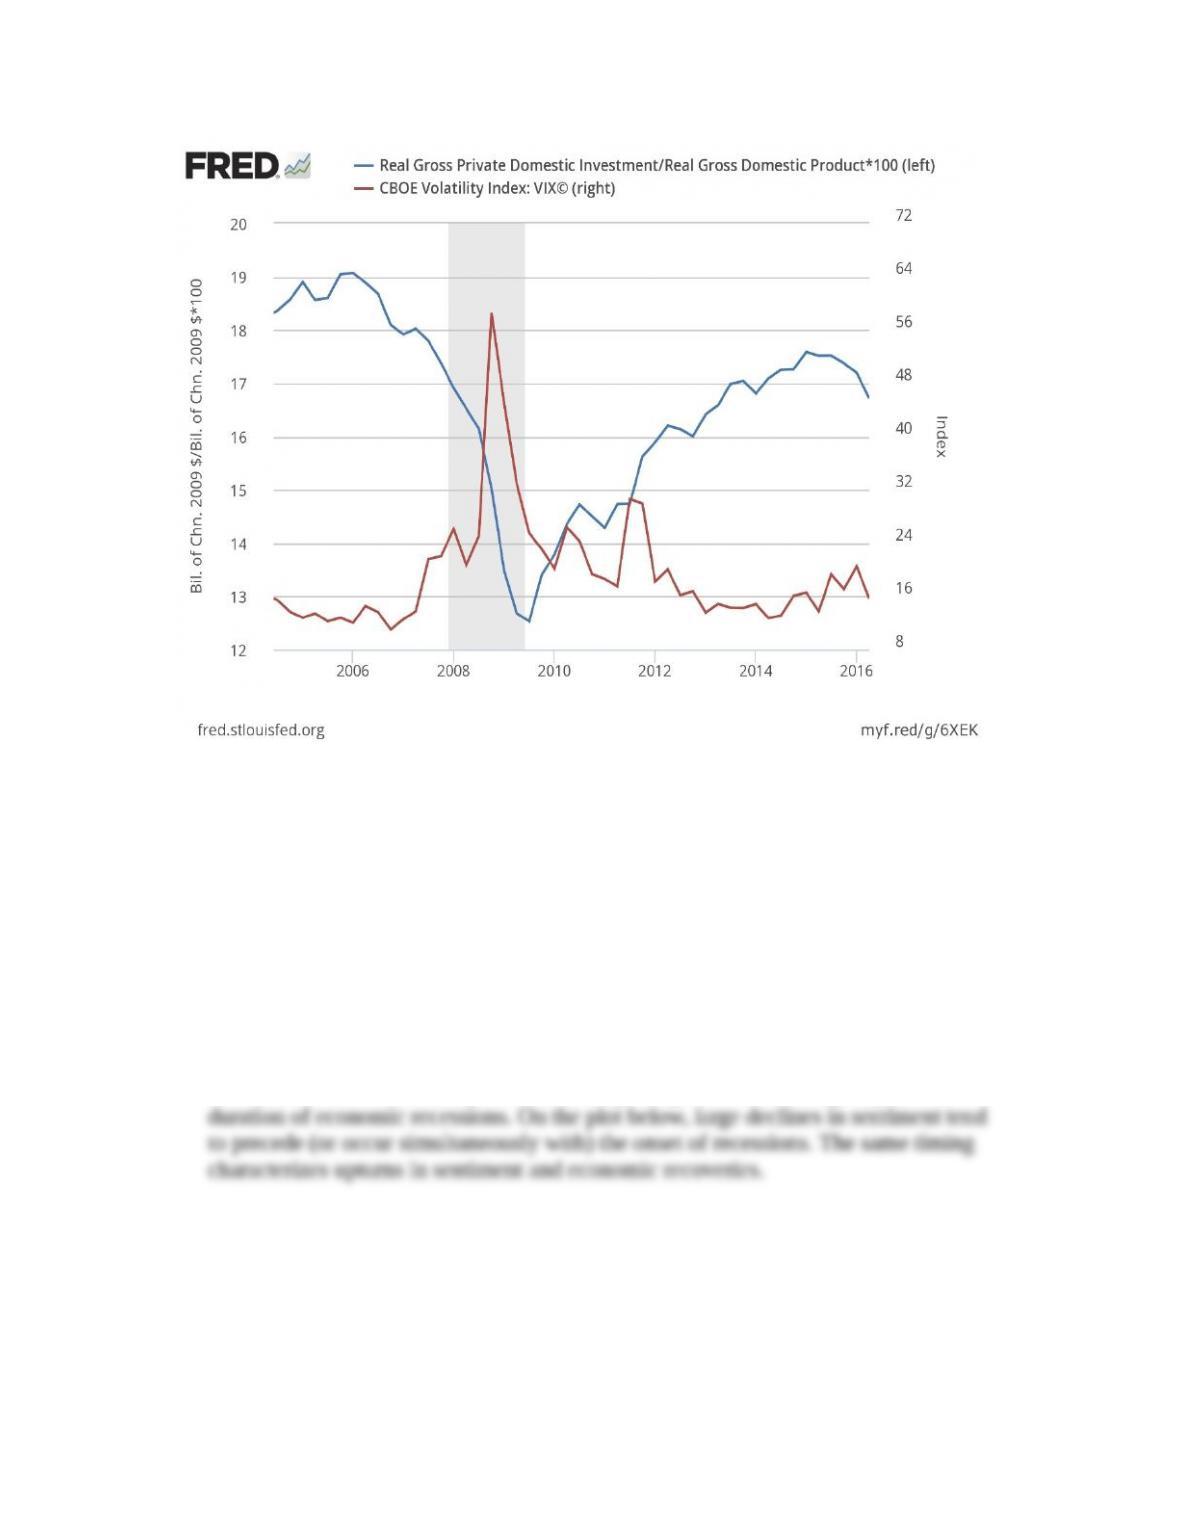
Chicago Board Options Exchange, CBOE Volatility Index: VIX© [VIXCLS], retrieved from FRED, Federal Reserve
Bank of St. Louis; https://fred.stlouisfed.org/series/VIXCLS.
4. A recession may reflect declines in aggregate demand, aggregate supply, or both. Are
swings in consumer sentiment characteristic of recessions? Plot a measure of
sentiment (FRED code: UMCSENT) and discuss its evolution during the recessions
since 1980? Explain why consumer sentiment is an important example of an
aggregate demand shock. (LO2, LO3)
Answer: Consumption is about 70 percent of U.S. GDP, so swings in household
sentiment about the economy can have a major impact on the timing, depth, and
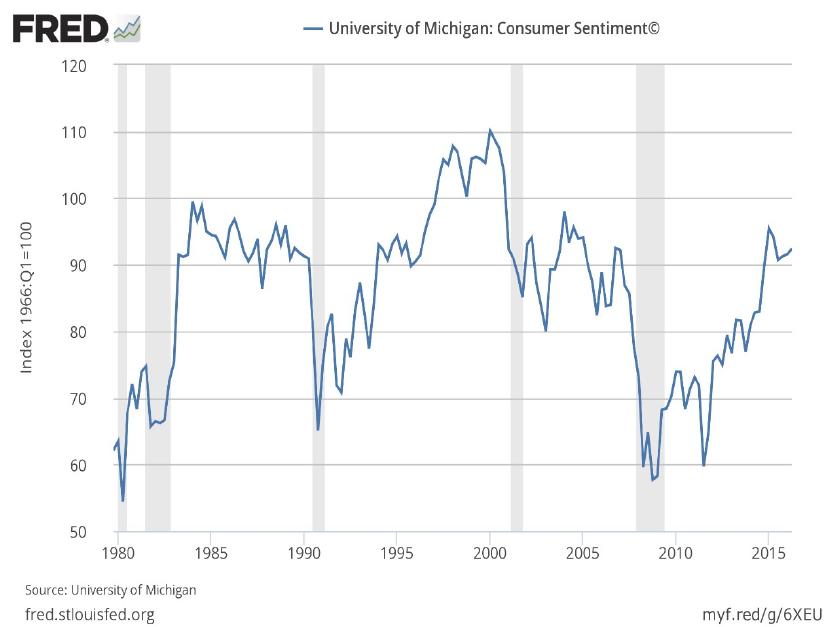
University of Michigan, University of Michigan: Consumer Sentiment© [UMCSENT], retrieved from FRED,
Federal Reserve Bank of St. Louis; https://fred.stlouisfed.org/series/UMCSENT.
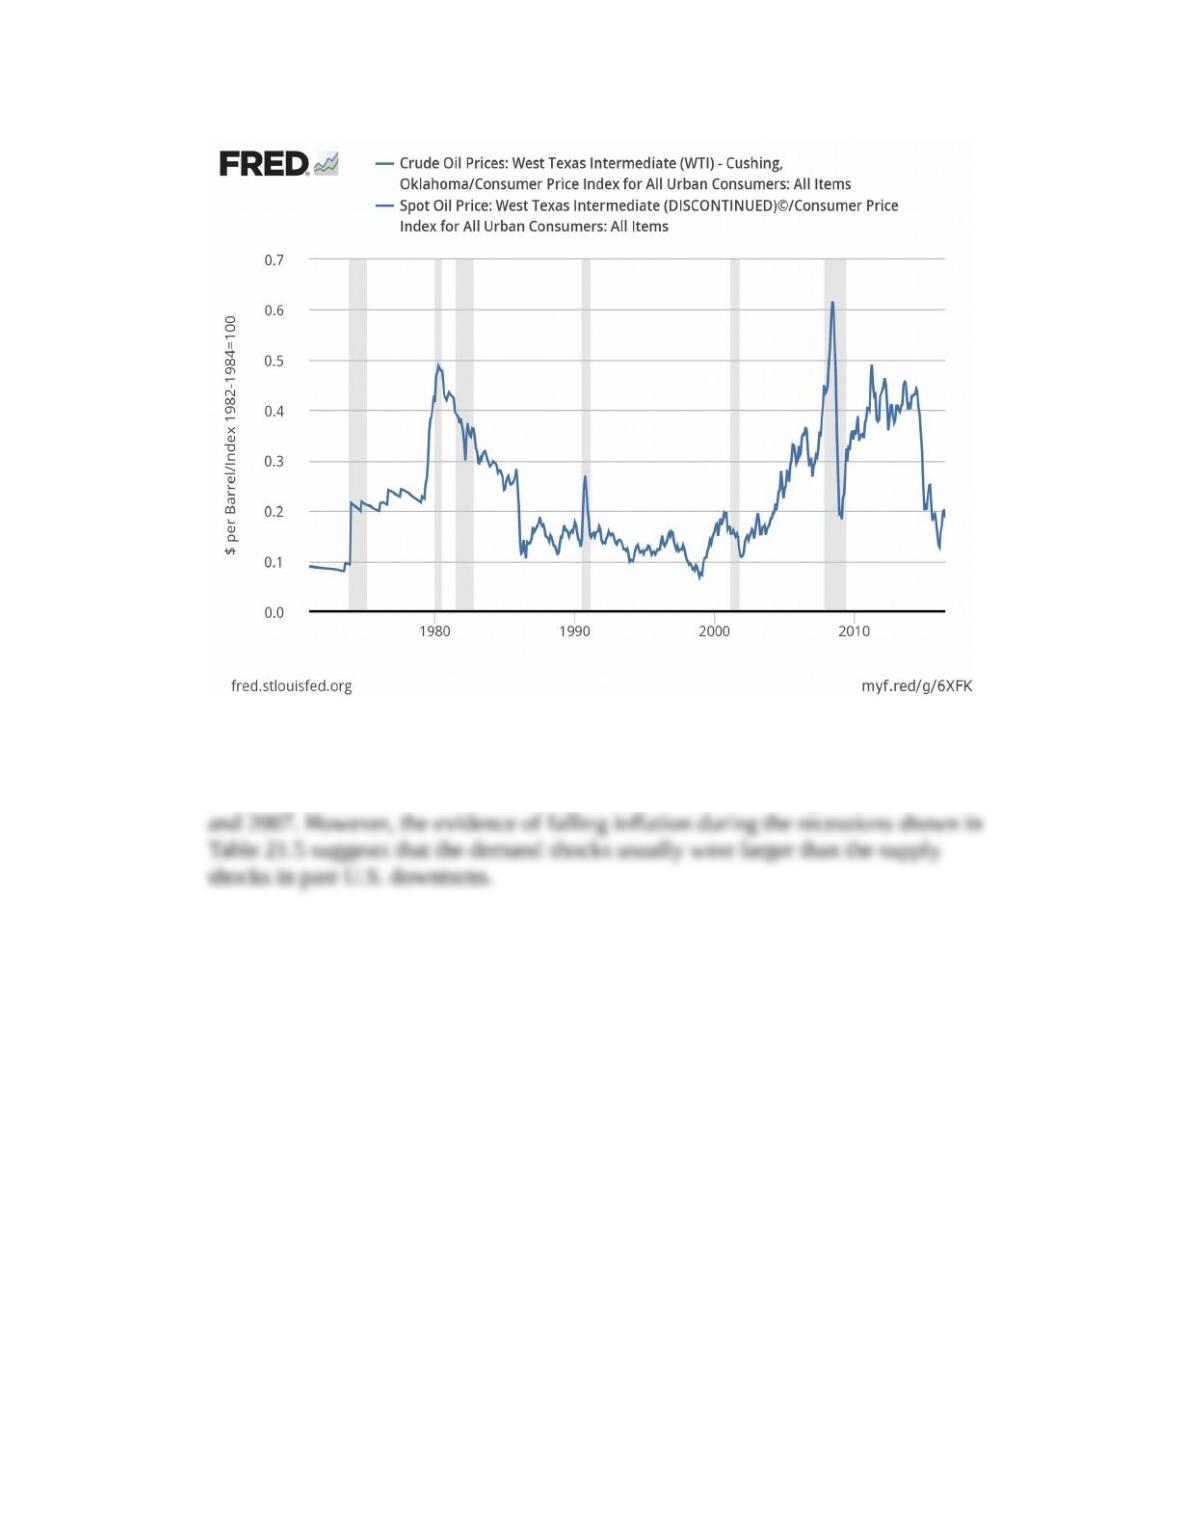
5. How often are negative supply shocks associated with recessions? Plot on a quarterly
basis since 1971 the real price of oil – measured as the ratio of the nominal spot price
of West Texas intermediate oil (FRED code: OILPRICE) to the U.S. consumer price
index (CPIAUCSL). To extend this measure, add a second line showing the ratio of
West Texas intermediate oil prices (FRED code: MCOILWTICO) to the consumer
price index (CPIAUCSL). (These series will overlap for their common period, so use
the Format option in FRED to plot then with the same color.) Identify recessions that
may have been triggered in part by an oil price shock. (LO4)
(L
O3)
Answer: Sharp increases in the real price of oil preceded several U.S. recent
recessions. The most obvious instances are the recessions that began in 1973, 1979,
Dow Jones & Company, Spot Oil Price: West Texas Intermediate (DISCONTINUED)© [OILPRICE], retrieved
from FRED, Federal Reserve Bank of St. Louis; https://fred.stlouisfed.org/series/OILPRICE.
* indicates more difficult problems