1. Which of the following factors would increase the portfolio demand for money?
Explain your choices. (LO3)
a. A new website allows you to liquidate your stock holdings quickly and
cheaply.
Answer: Both options (b) and (c) would increase the portfolio demand for money. If
future interest rates are expected to rise, bond prices will drop, leading to a capital
alternative assets and so reduce the portfolio demand for money.
2. *Suppose a central bank is trying to decide whether to target money growth.
Proponents of the move are confident that the new policy would be successful as,
under the existing policy regime, they observed a stable statistical relationship
between money growth and inflation. What warning might you issue to the central
bank when they ask your advice? (LO1)
Answer: You should warn the central bank that altering its policy may alter people’s
future, which include what the public expects the central bank to do.
3. If “inflation is always and everywhere a monetary phenomenon,” why did the huge
expansions of central bank money by the Federal Reserve, the ECB, and the Bank of
Japan between 2007 and 2015 not result in high inflation in those economies? (LO1)
Answer: The massive expansion of central bank money (currency plus reserves) did
not translate into high growth rates in the broad monetary aggregates that are most
tightly linked to inflation. The financial crisis altered the behavior of banks, whose
drastically in these economies as banks became unwilling or unable to convert
reserves into credit.
4. Why might the ECB place somewhat greater emphasis than the Federal Reserve on
money growth rates in discussing monetary policy? (LO4)
Answer: The usefulness of money growth as a policy guide depends on the stability
of money demand (or velocity). In its early years, the ECB was more confident than
financial and economic conditions affecting inflation and economic growth.
Data Exploration
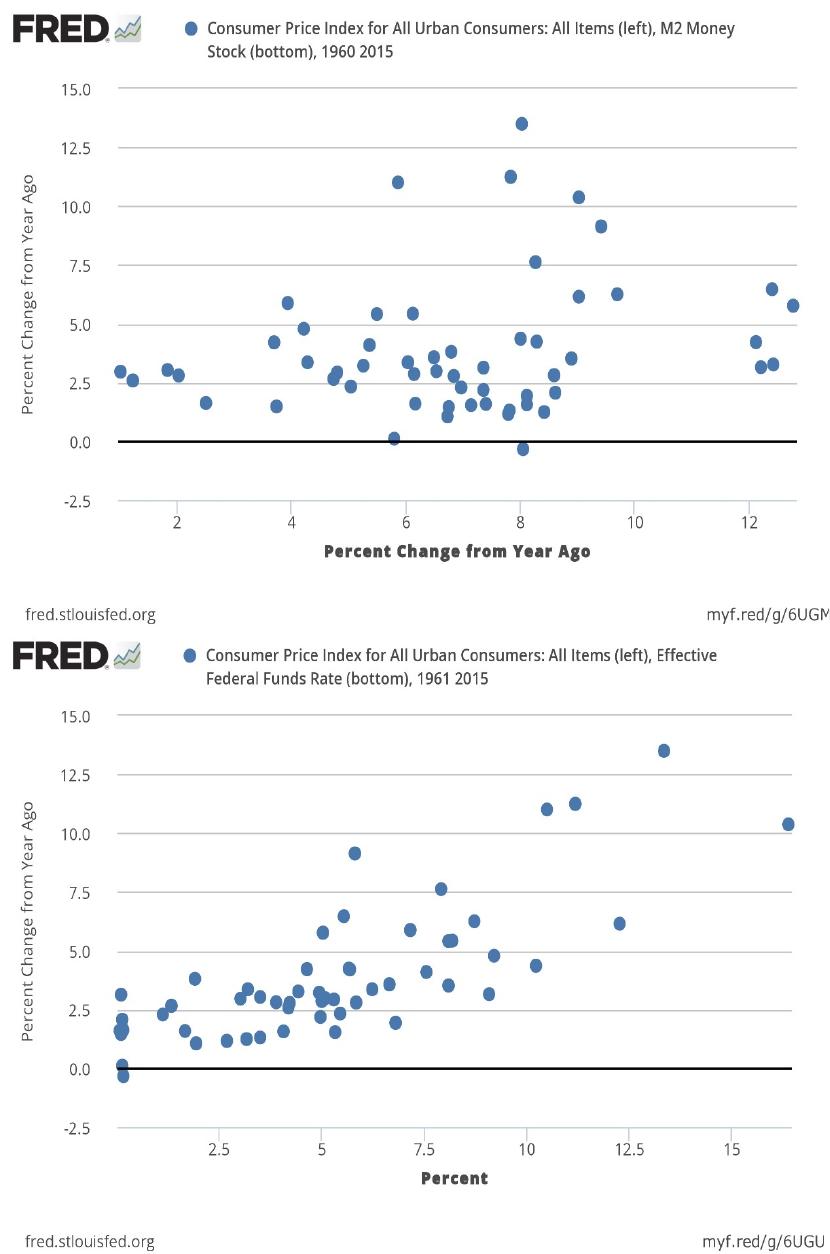
1. A scatter plot can reveal a relationship between two indicators. Construct a scatter
plot of annual data beginning in 1959 for inflation and money growth. Measure these
as the percent change from a year ago of consumer prices (FRED code: CPIAUCSL)
and M2 (FRED code: M2SL), respectively. Then, display a second scatter plot of
annual data beginning in 1959 for inflation (measured as before) and the federal funds
rate (FRED code: FEDFUNDS). Which indicator is more closely linked to inflation:
money growth or the interest rate? Does that tell us which policy instrument is the
better? (LO2)
Answer: The scatter plots are below. The federal funds rate appears more closely
linked to inflation. However, this information is insufficient to determine the correct
monetary policy tool. Correlation is not necessarily causation, so while the interest
rate may be more highly correlated with inflation than M2 growth, the reason may be
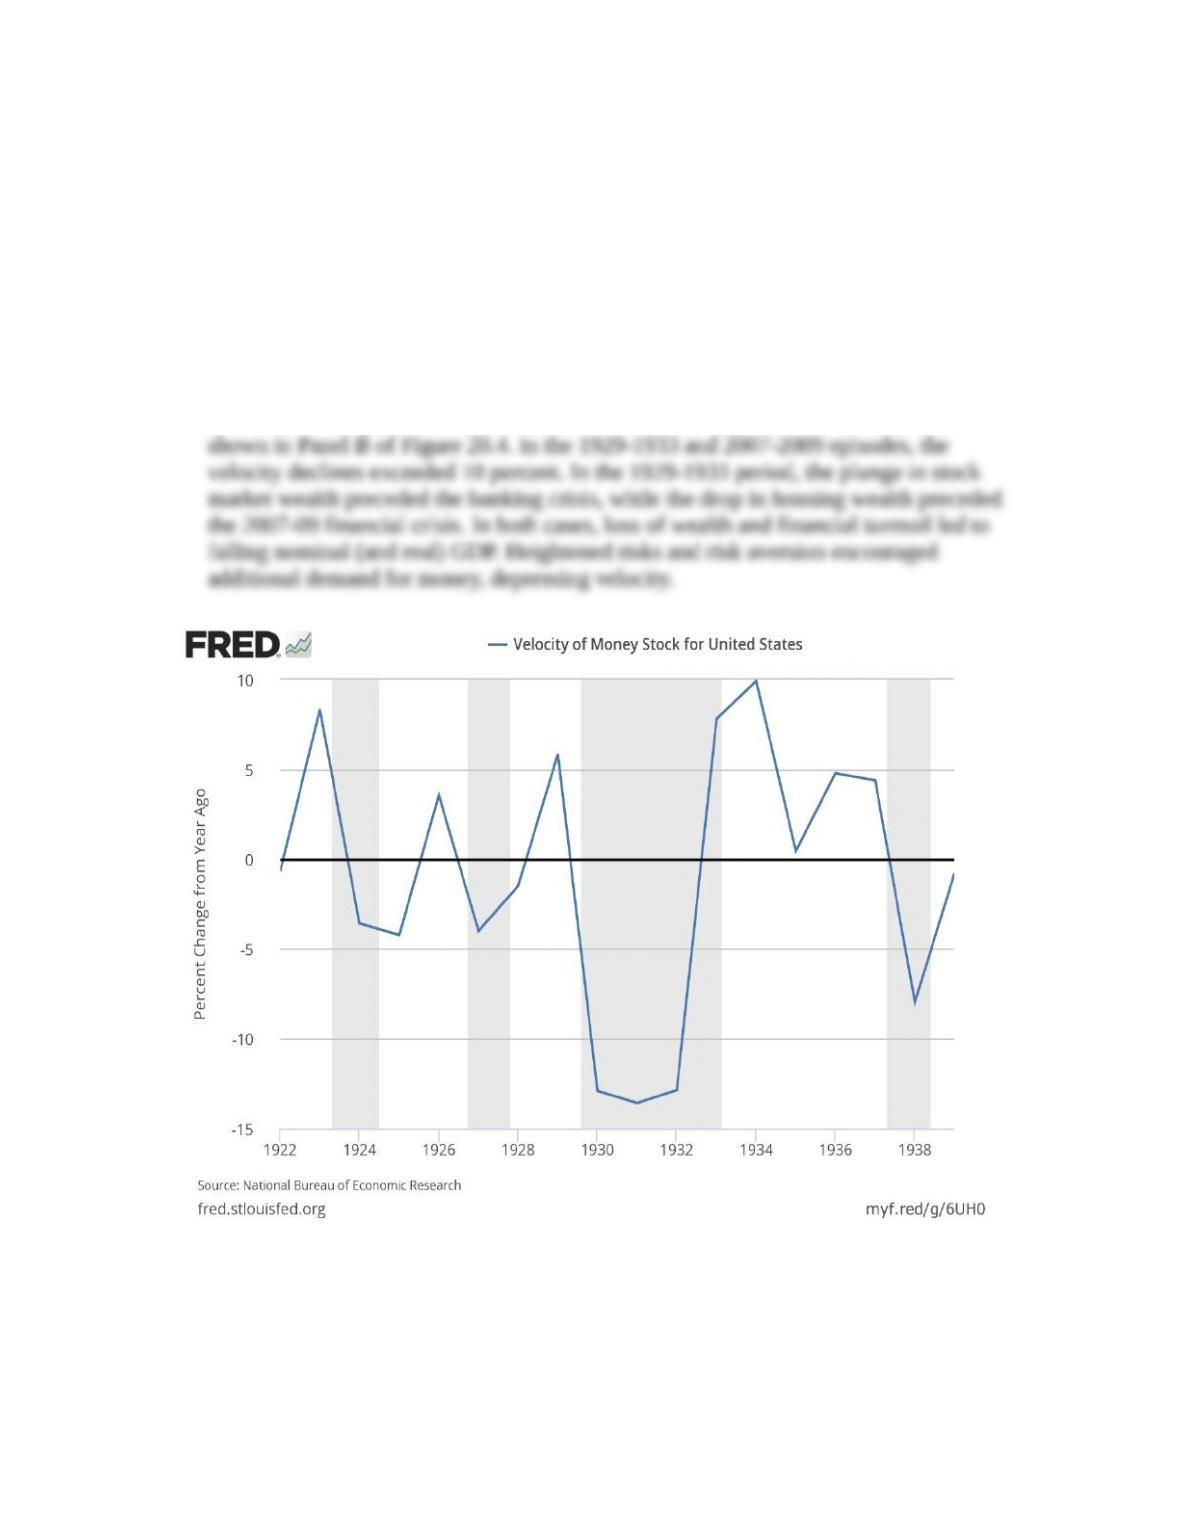
2. Plot the percent change from a year ago of the velocity of money (FRED code:
A14187USA163NNBR) between 1922 and 1939. Compare the typical scales of the
velocity declines during the recessions of this “interwar” period and the velocity
declines during the recessions shown in Panel B of Figure 20.4. Were the 1929-33 and
2007-2009 periods special? What role might wealth have played in these two
episodes? (LO3)
Answer: The data plot for the interwar period is below. Aside from the Great
Depression and the 2007-2009 financial crisis, the declines in velocity during
recessions averaged about 5 percent in both the interwar period and in the period
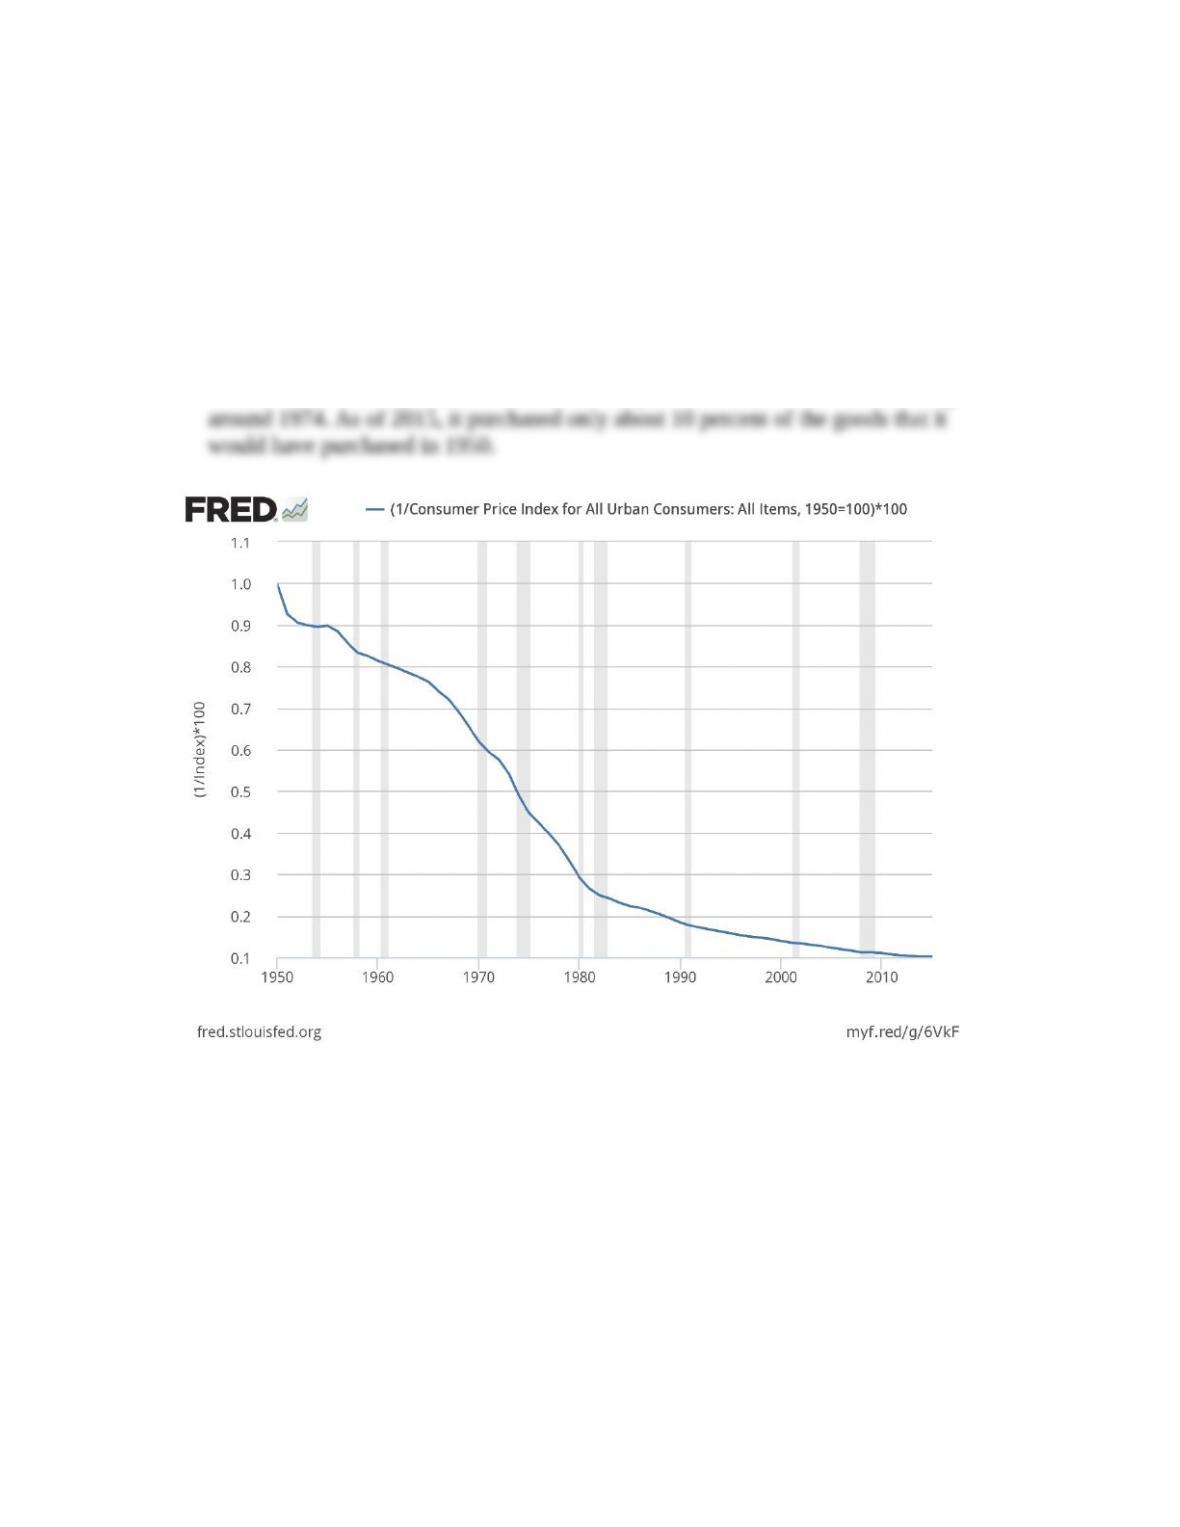
3. Plot annually since 1950 the reciprocal of the consumer price index (FRED code:
CPIAUCSL) to see how inflation erodes the purchasing power of money. To start
with an initial value of 1.0, in the Units dropdown box in FRED, select the option
“Index (Scale to value to 100 for the chosen date)” and then apply the formula
“(1/a)*100”. If a dollar bought one unit of goods and serves in 1950, as of which year
did the dollar buy only one-half unit? As of 2015, how many units of goods and
services did a dollar buy? (LO1)
Answer: The data is plotted below. The dollar purchased about one-half unit of goods
4. In Figure 20.1, which compares money growth and inflation over an extended time
period, would Mexico be above or below the 45o line? Plot since 1987 on a quarterly
basis the percent change from a year ago of the consumer price index (FRED code:
MEXCPIALLQINMEI) and M1 (FRED code: MYAGM1MXM189N) in Mexico.
Then download the data and calculate the averages of these inflation and money
growth measures. Where would Mexico appear on Figure 20.1? Were there episodes
since 1987 when Mexico was on the other side of the 45-degree line? If so, why?
(LO2)
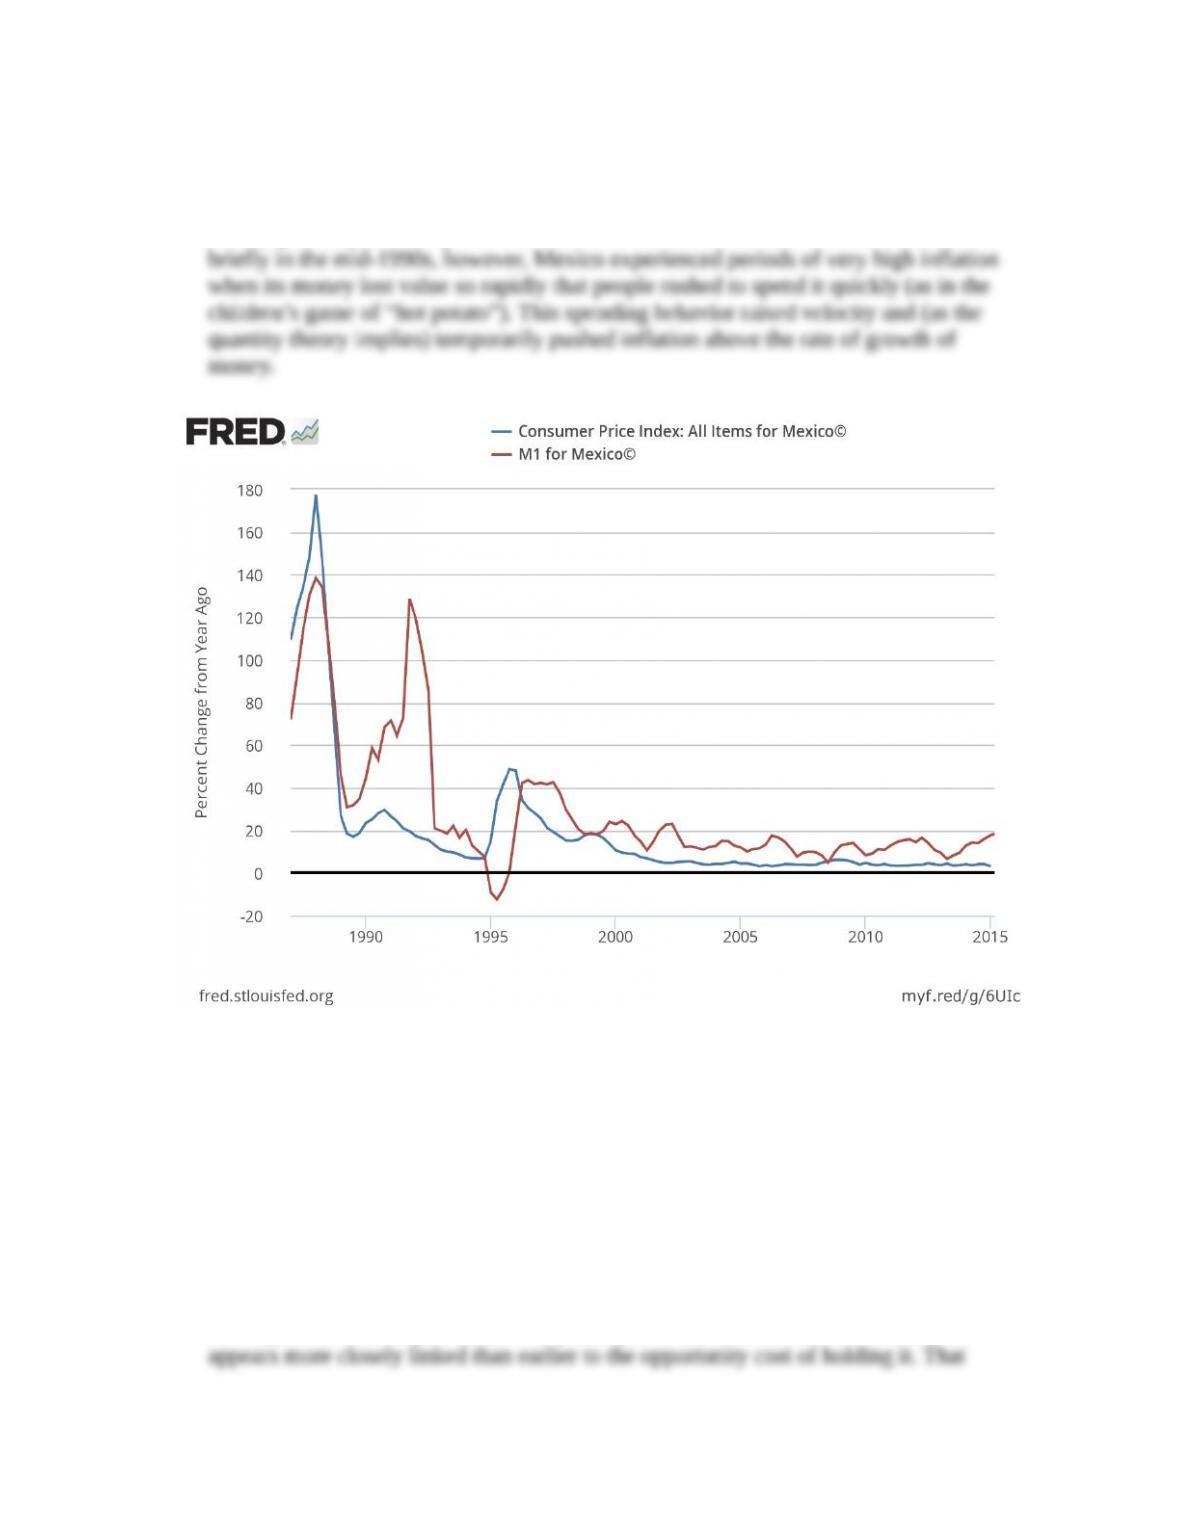
Answer: The plot appears below. The average of the annual inflation rate was 20
percent, while the average rate of annual money growth was 29 percent. So, Mexico
would appear below the 45-degree line on Figure 20.1. Inspecting the plot below,
money growth persistently exceeded inflation since the late 1990s. In the 1980s and
Organization for Economic Co-operation and Development, M1 for Mexico© [MANMM101MXQ189S], retrieved
from FRED, Federal Reserve Bank of St. Louis; https://fred.stlouisfed.org/series/MANMM101MXQ189S.
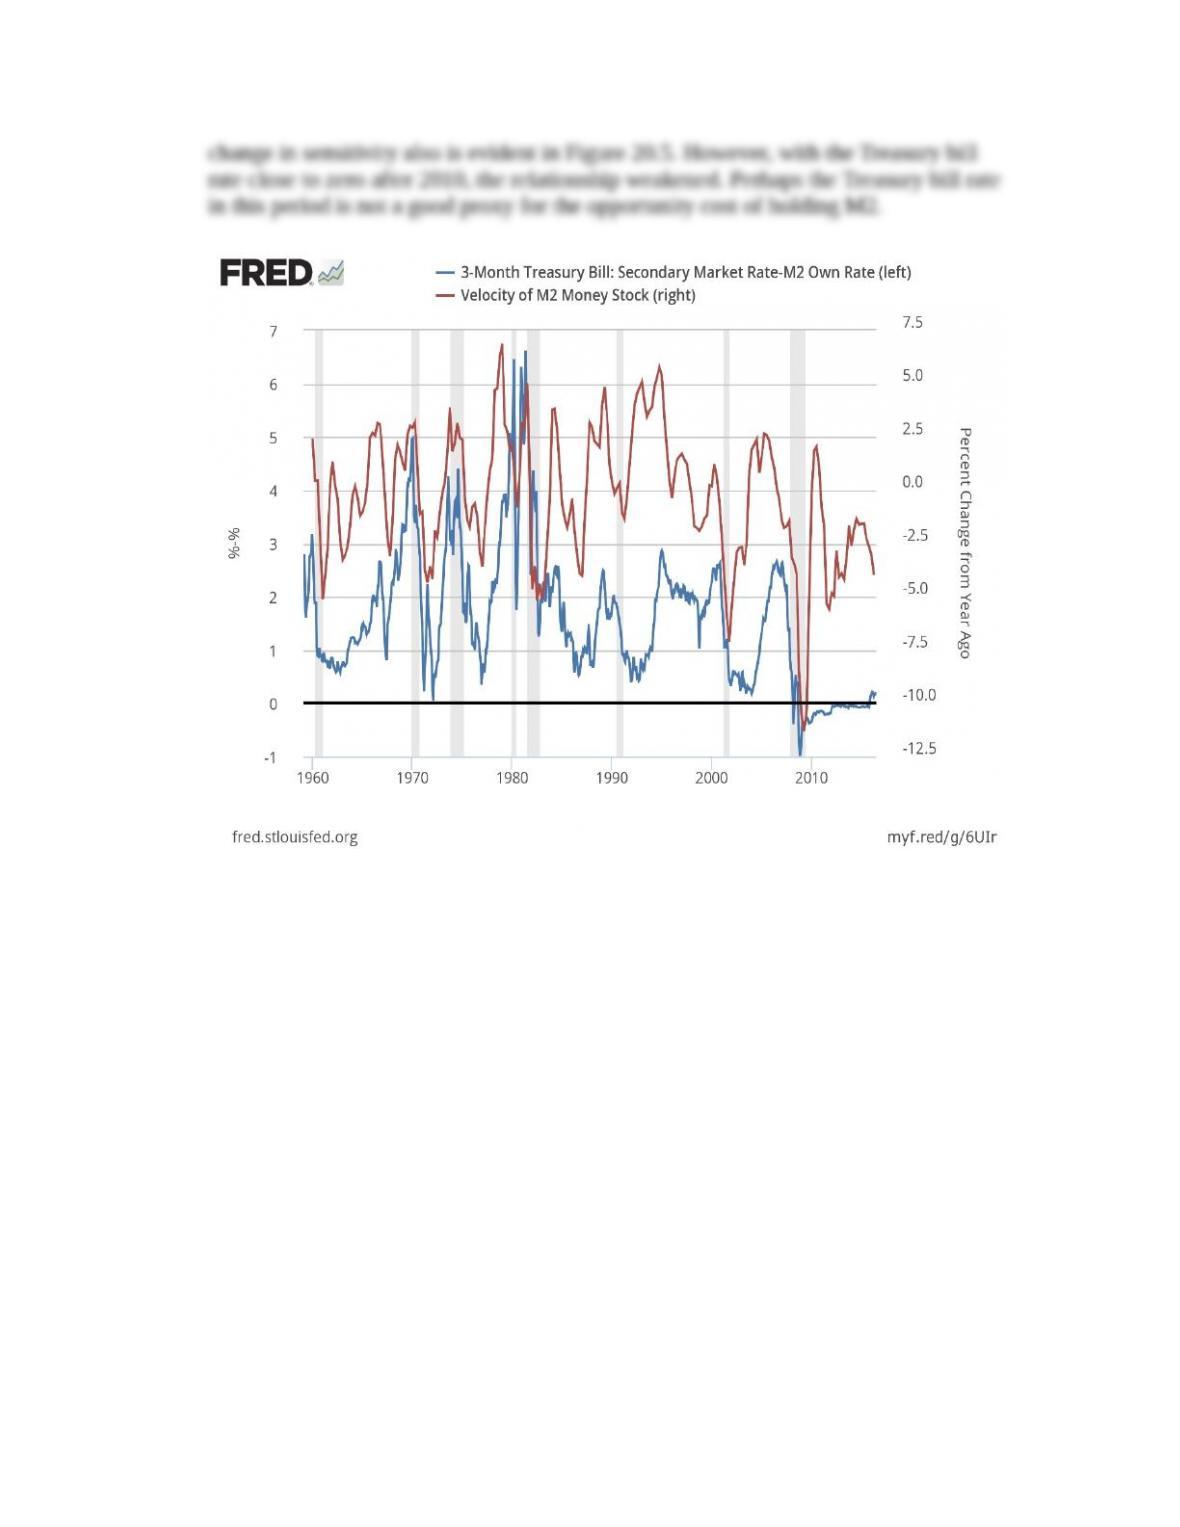
5. In theory, the velocity of money should rise with the cost of holding it. To assess the
theory, plot the opportunity cost of holding M2 – defined as the difference between
the three-month Treasury bill rate (FRED code: TB3MS) and the interest rate on M2
components (FRED code: M2OWN) – and (on the right scale) the percent change
from a year ago of M2 velocity (FRED code: M2V). What do you conclude? (LO4)
The plot appears below. The opportunity cost of holding M2 appears to rise in
advance of recessions and fall during recessions, consistent with the cycles of M2
velocity. After the early 1980s, and especially after the mid-1990s, M2 velocity
* indicates more difficult problems