4. Suppose a bank faces a gap of -20 between its interest-sensitive assets and its
interest-sensitive liabilities. What would happen to bank profits if interest rates were
to fall by 1 percentage point? You should report your answer in terms of the change
in profit per $100 in assets. (LO2)
Answer: A gap of -20 means that the bank has more interest-sensitive liabilities than
assets. When interest rates fall, therefore, its profits will rise as it gains more on
5. *Duration analysis is an alternative to gap analysis for measuring interest-rate risk.
(See footnote 9 on page 316.) The duration of an asset or liability measures how
sensitive its market value is to a change in the interest rate: the more sensitive, the
longer the duration. In Chapter 6, you saw that the longer the term of a bond, the
larger the price change for a given change in the interest rate.
Using this information and the knowledge that interest rates increases tend to hurt
banks, would you say that the average duration of a bank’s assets is longer or shorter
than that of its liabilities? (LO1)
Answer: When interest rates increase, the market value of assets such as bonds fall. If
interest rate increases hurt banks, then the average value of assets must fall by more
6. Suppose you were the manager of a bank with the following balance sheet.
Bank Balance Sheet
(in millions)
You are required to hold 10 percent of checkable deposits as reserves. If you were
faced with unexpected withdrawals of $30 million from time deposits, would you
rather:
a. Draw down $10 million of excess reserves and borrow $20 million from other
banks?
b. Draw down $10 million of excess reserves and sell securities of $20 million?
Explain your choice. (LO1)
Assets Liabilities
Reserves $30 Checkable Deposits $200
Securities $150 Time Deposits $600
Loans $820 Borrowings $100

Answer: Option (a) is preferable to option (b) because it doesn’t shrink the size of the
7. Suppose you are advising a bank on the management of its balance sheet. In light of
the financial crisis of 2007-2009, what arguments might you make to convince the
bank to hold additional capital? (LO2)
Answer: The financial crisis of 2007-2009 resulted in projected losses of nearly $1
trillion in US bank assets. In the absence of substantial government support, many
8. The financial crisis compelled banks to reduce their leverage sharply. Consider the
following two views of the balance sheet of a bank before and after the financial
crisis. Which balance sheet view is more likely to be that of the bank after the
financial crisis? Support your choice with calculations. (LO2)
Bank Balance Sheet – View 1
(in millions)
Bank Balance Sheet View 2
(in millions)
Answer: We can calculate the leverage ratio for each of the views:
Assets Liabilities
Reserves $30 Deposits $800
Securities $150 Other Borrowed Funds $90
Loans $820 Bank Capital $110
Assets Liabilities
Reserves $30 Deposits $800
Securities $150 Other Borrowed Funds $110
Loans $820 Bank Capital $90

Leverage Ratio = Total Assets / Bank Capital.
9. After a protracted period of historically low interest rates in the wake of the financial
crisis, many observers predicted that the Federal Reserve would follow its December
2015 rate tightening with a series of further interest rate increases. Based on gap
analysis, would this scenario be more likely to hurt or help your bank’s profitability,
assuming your bank’s liabilities are more interest sensitive than its assets? What steps
might your bank take to prepare for this scenario? (LO3)
Answer: Given your bank has a negative gap—i.e. more interest sensitive liabilities
than assets, it is more likely that a series of interest rate hikes would hurt profits. This
is because the additional interest the bank would have to pay on its interest sensitive
Data Exploration
1. Are U.S. banks increasing in size? Use FRED to plot since 1984 on a quarterly
basis the number of U.S. commercial banks (FRED code: USNUM) and, on the
right scale, the volume of their deposits (FRED code: DPSACBM027SBOG).
Download the data and compute the average deposit size of banks in the first
quarters of 1984 and 2016. Do these sizes accurately portray a typical commercial
bank? (LO1)
Answer: The data plot is:
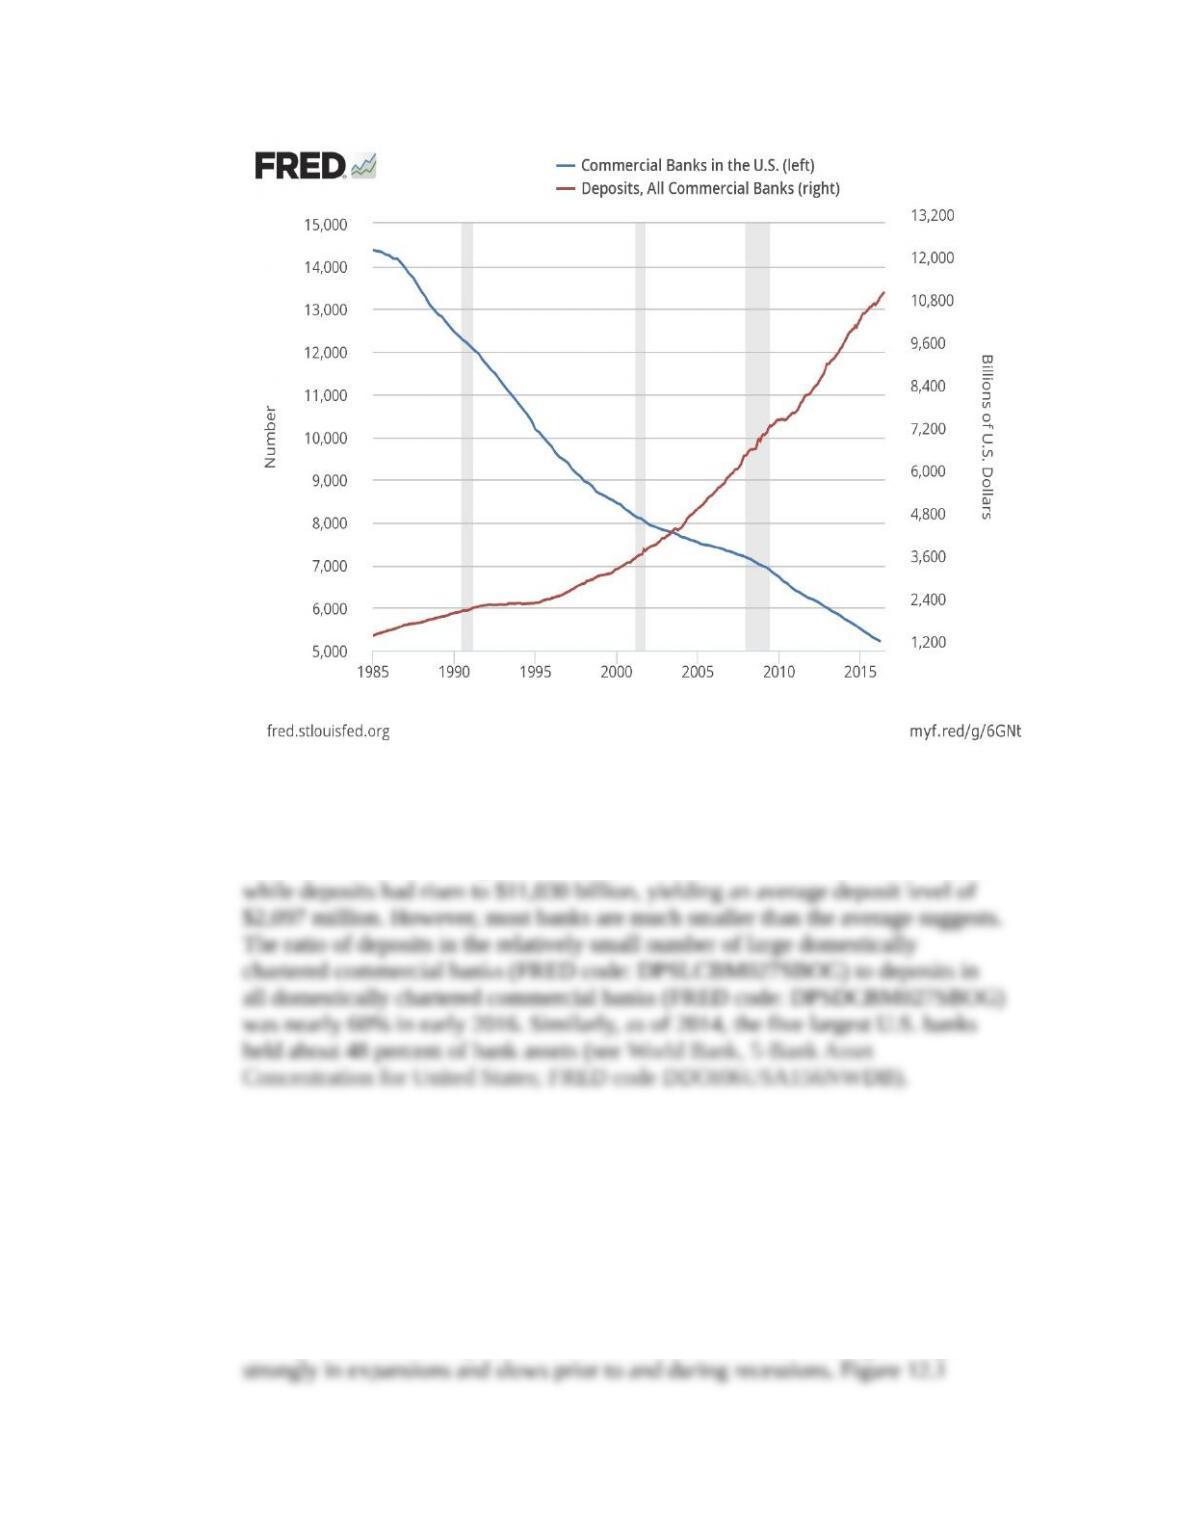
Using quarterly data, at the beginning of 1984, there were 14,400 commercial
banks and deposits of $1,489 billion, resulting in an average deposit level of about
$104 million. In the first quarter of 2016, the number of banks had fallen to 5,260
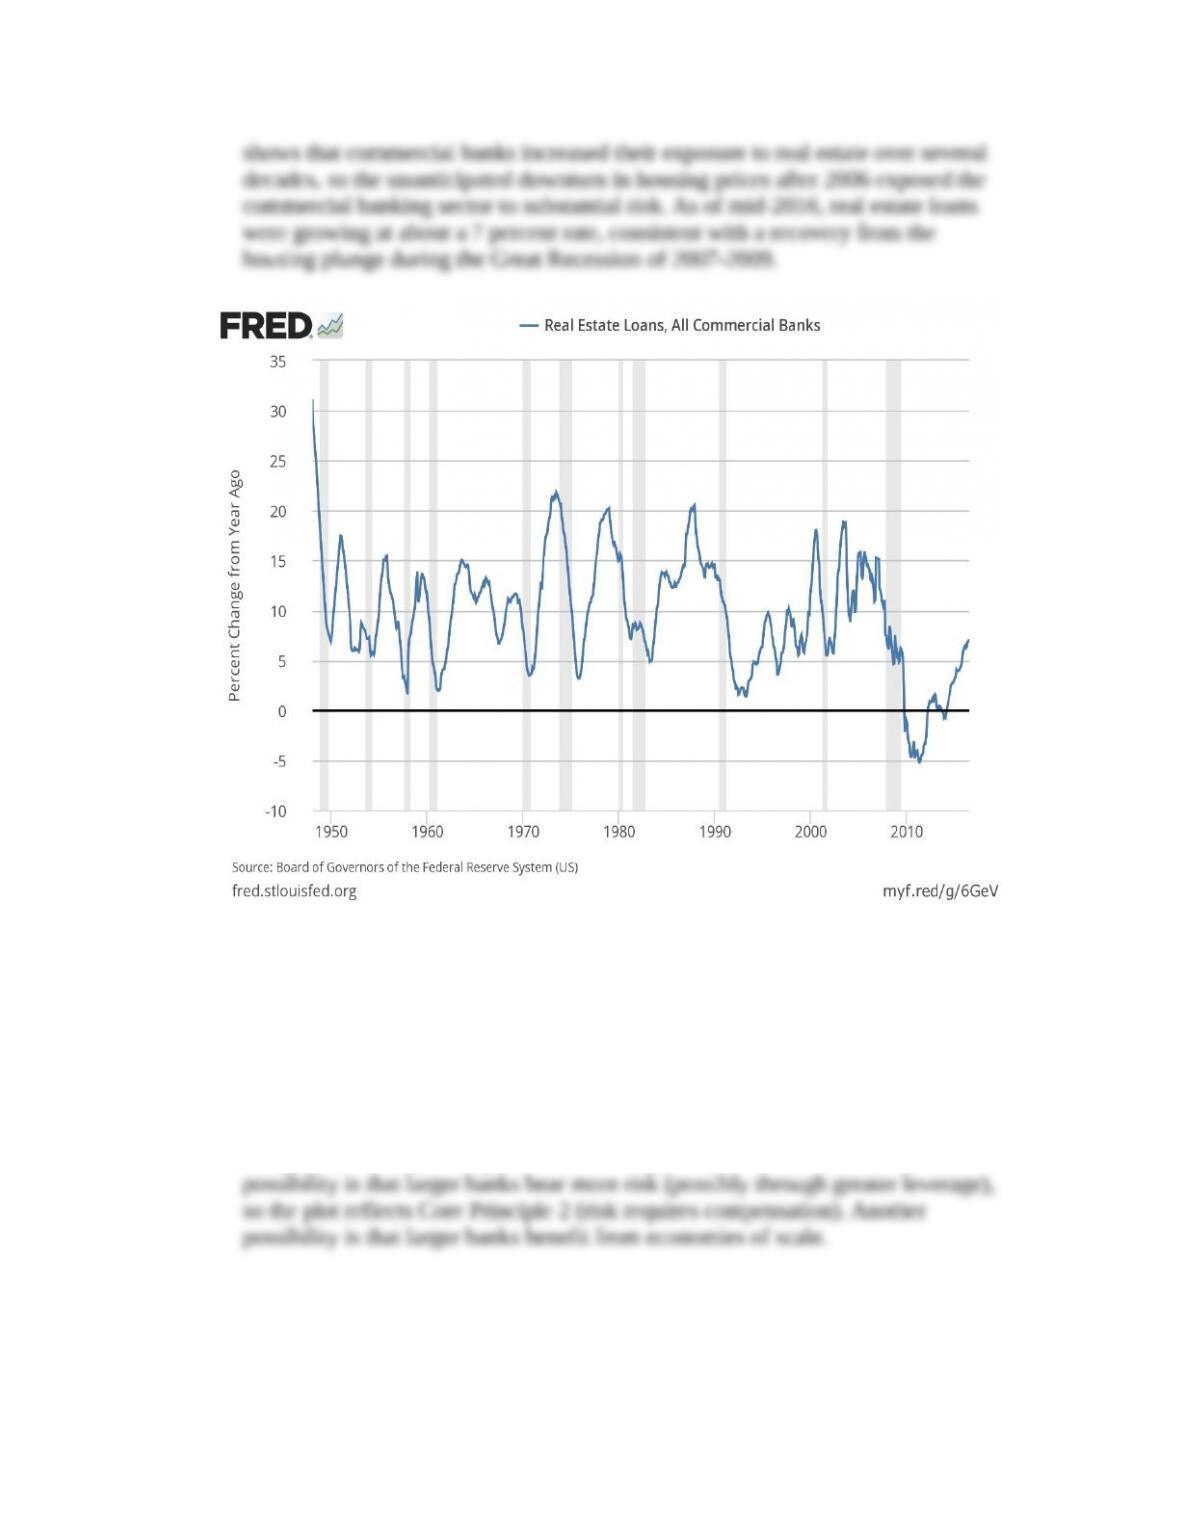
2. Commercial banks have become increasingly involved in the real estate market.
Plot the percent change from a year ago of real estate loans made by commercial
banks (FRED code: REALLN) and discuss the relationship between the booms
and busts in real estate lending and the expansions and recessions of the U.S.
economy. (LO3)
Answer: The cycles in real estate lending, plotted below, appear to coincide
closely with business expansions and recessions. Real estate lending often grows
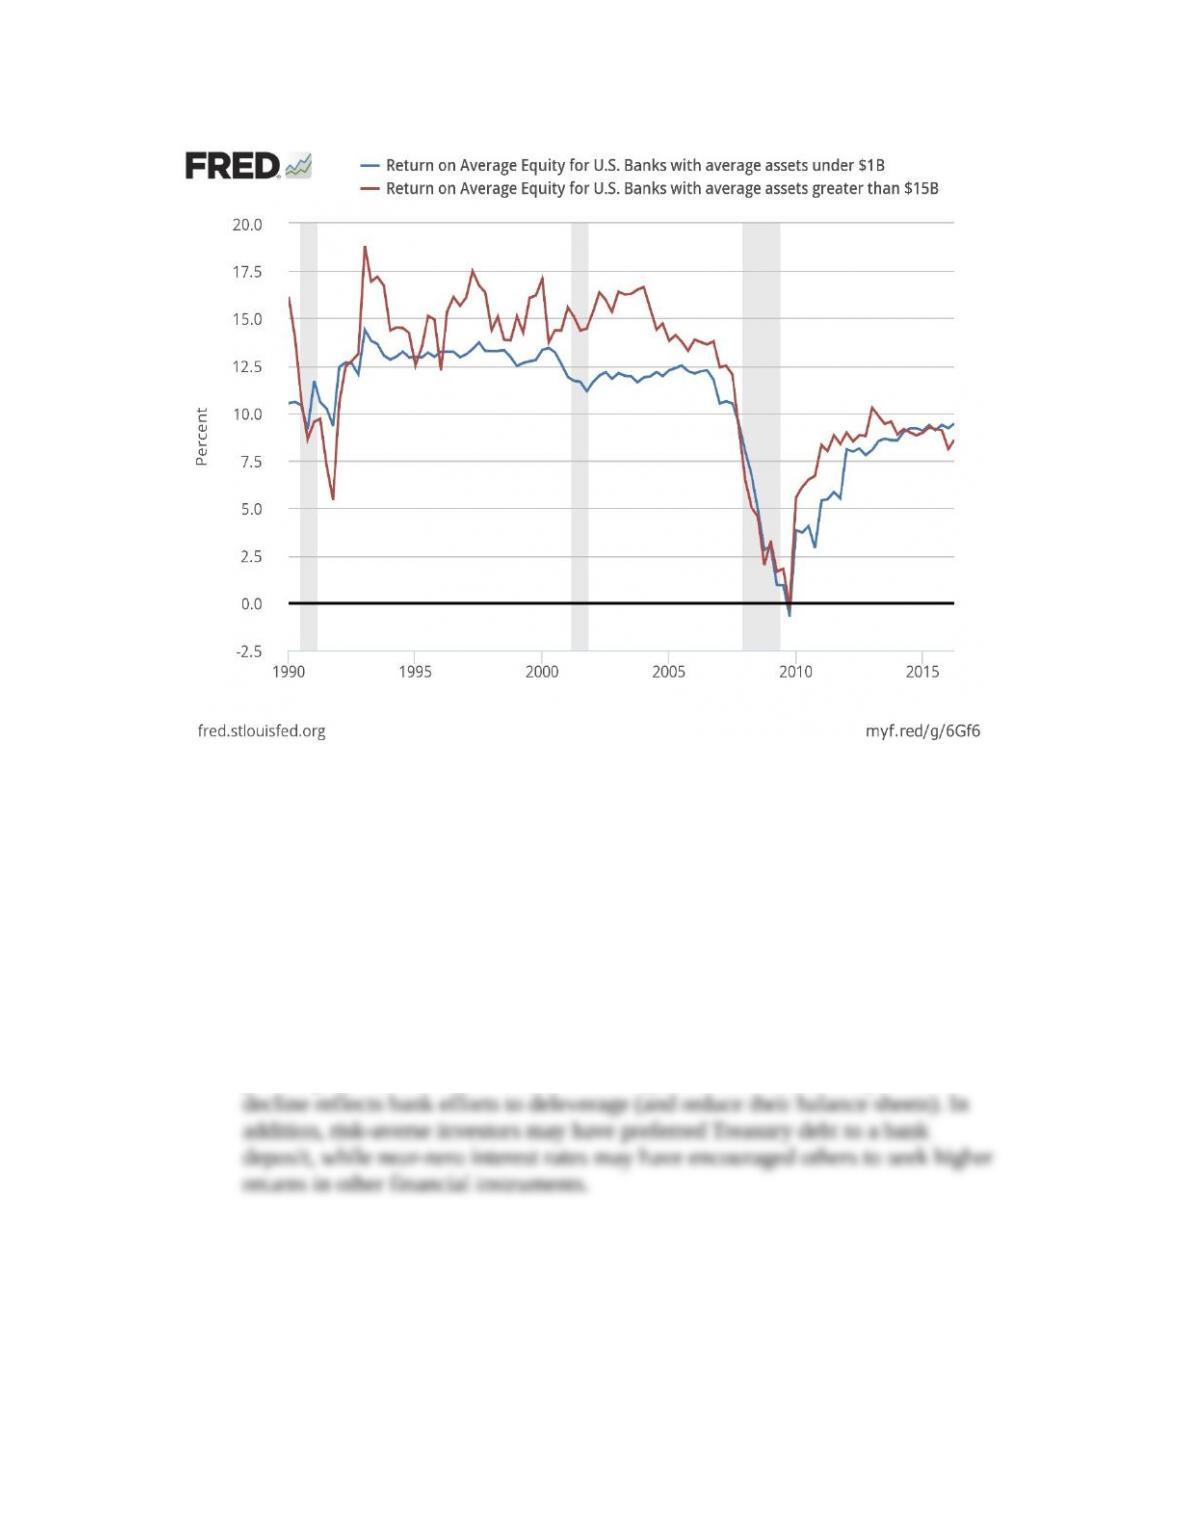
3. Plot since 1990 the return on equity of small banks (banks with assets of less than
$1 billion; FRED code: US1ROE) and large banks (banks with assets of greater
than $15 billion; FRED code: USG15ROE). How do you explain the long-run
pattern? (LO2)
Answer: As shown below, the return on equity for small banks is usually, but not
always, lower than for large banks. It also appears a bit less volatile. One
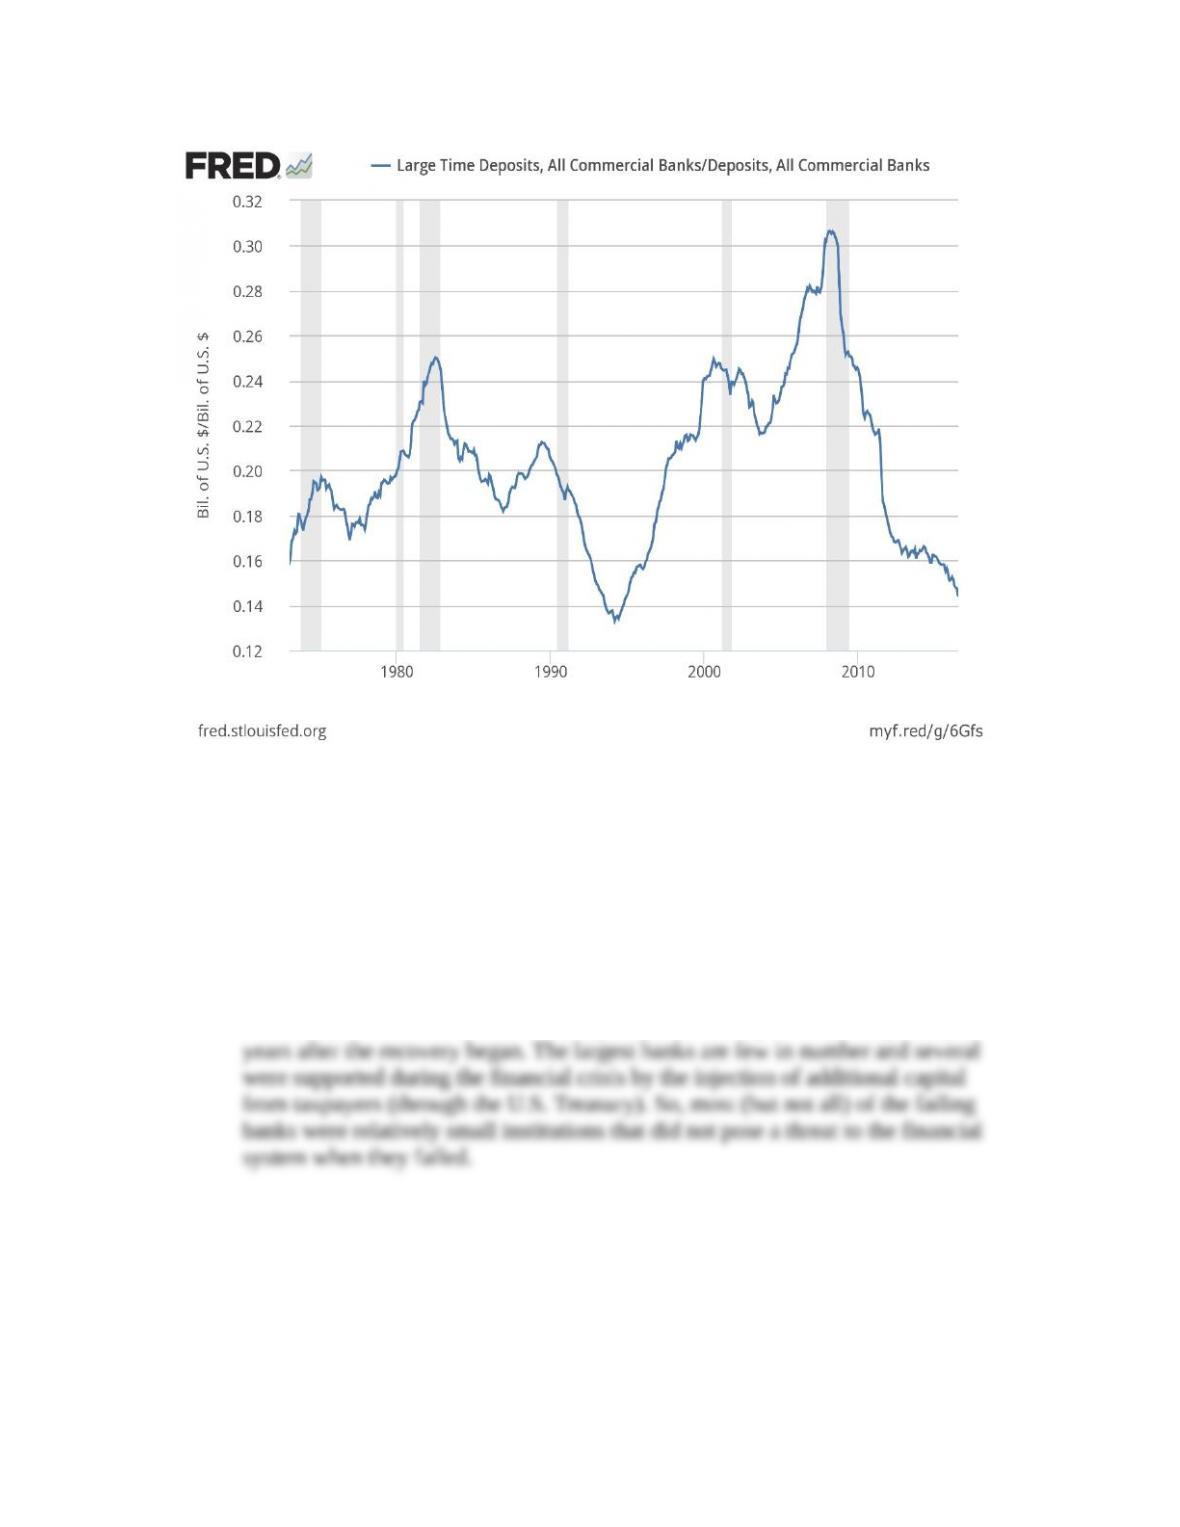
4. Banks sometimes manage liquidity risk by issuing large, marketable certificates of
deposit when other deposits decline. How important is this practice? Plot the
share of large time deposits (FRED code: LTDACBM027SBOG) in total deposits
(FRED code: DPSACBM027SBOG). Explain how this share evolved over the
long run and after 2004. (LO3)
Answer: The plot below shows that bank borrowing in the “wholesale” money
market has been cyclical. Since 2004, the importance of attracting large deposits
peaked prior to the financial crisis and then plummeted. Part of the post-crisis
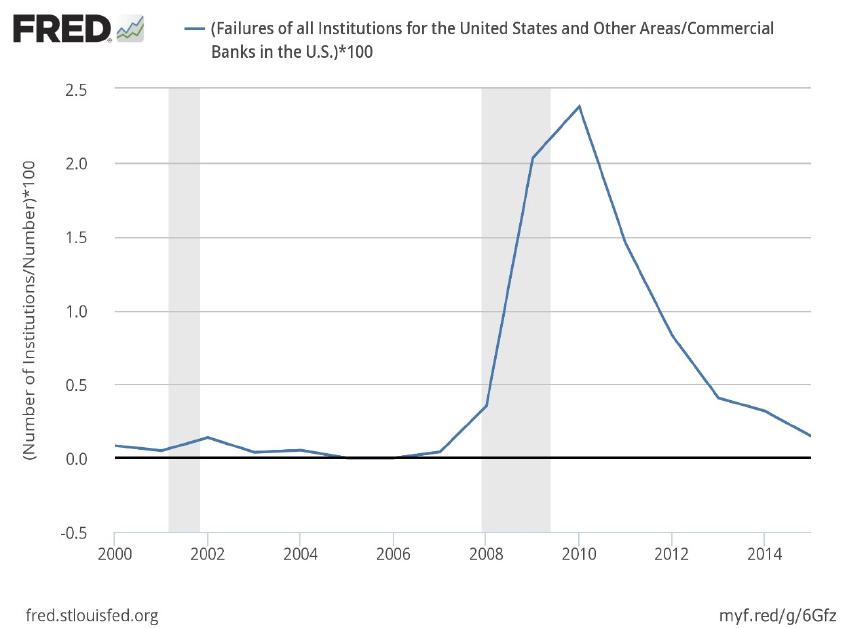
5. What share of U.S. banks fail? Plot since 2000 the fraction (in percent) of bank
failures (FRED code: BKFTTLA641N) relative to the number of banks (FRED
code: USNUM). Comment on the timing and the proportion of failures. Were
most of the failing banks large or small? (LO3)
Answer: The plot below shows that bank failures in the United States rose with a
lag as the Great Recession proceeded and peaked after the recovery began.
Moreover, failures remained elevated (compared to the pre-recession period) for
* indicates more difficult problems