Data Exploration
1. Financial intermediaries connect savers and borrowers. Examine growth in
intermediation from the following perspectives. (LO1)
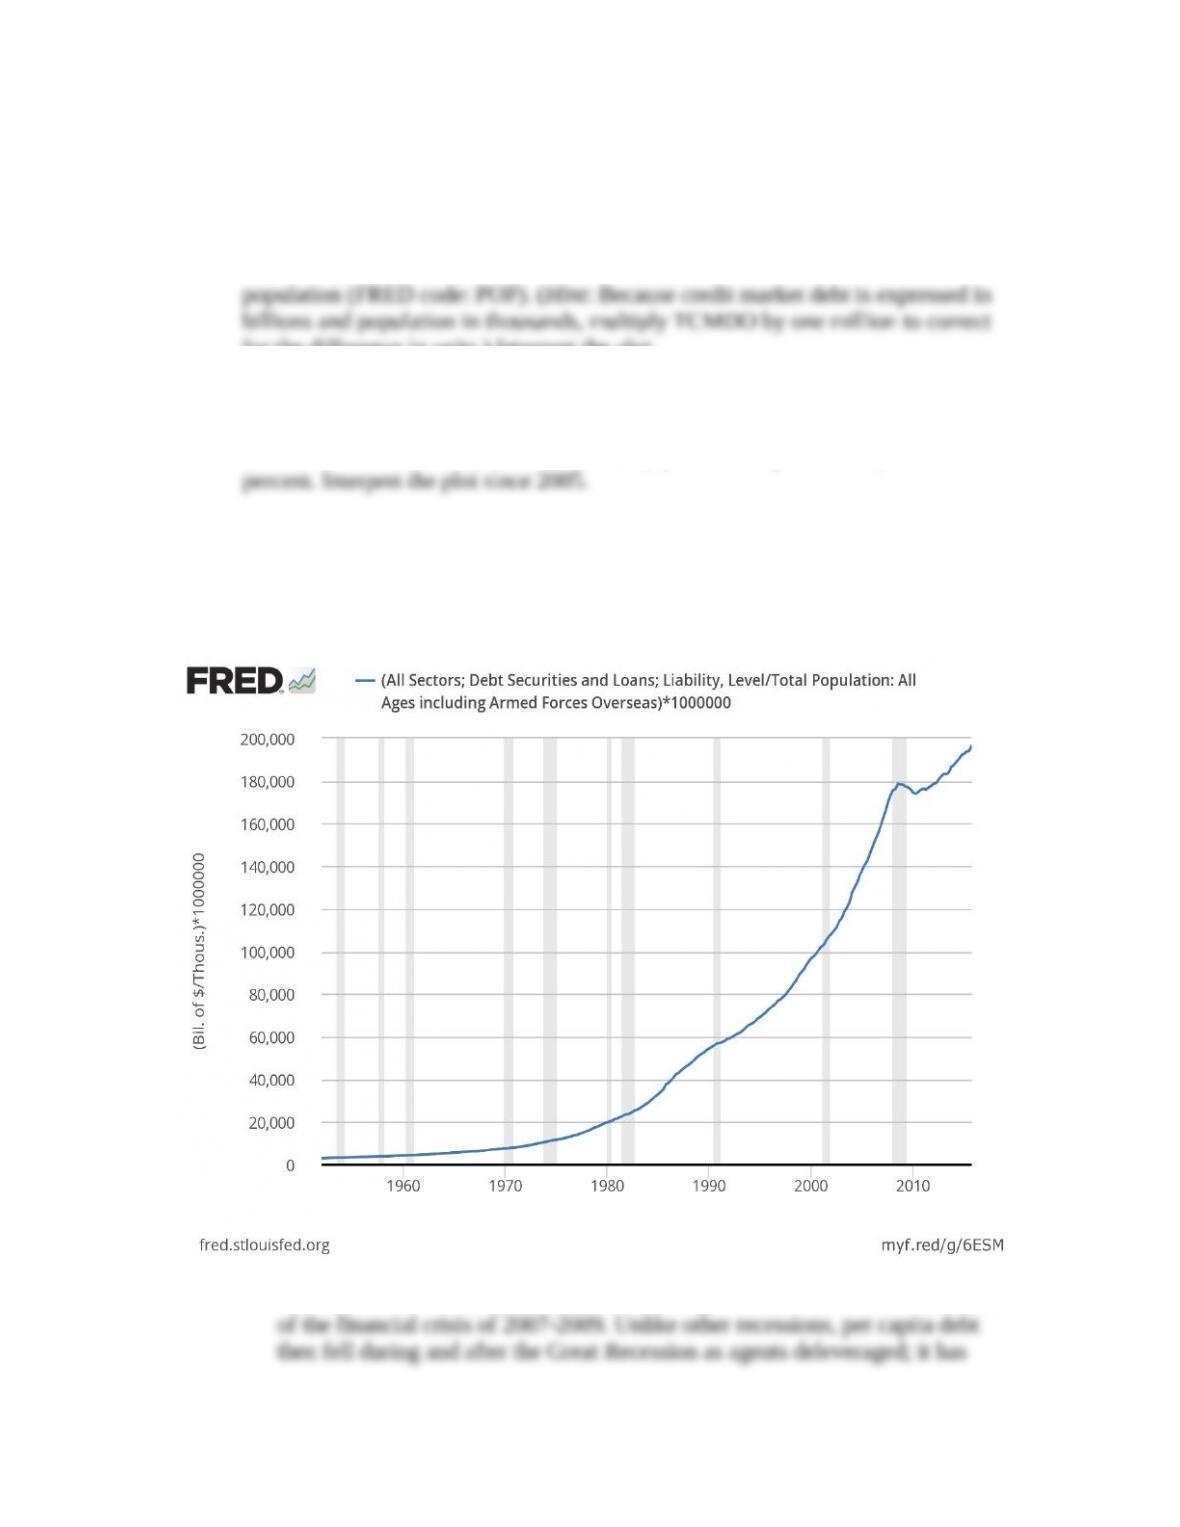
a. Plot the ratio of total credit market debt owed (FRED code: TCMDO) to
for the difference in units.) Interpret the plot.
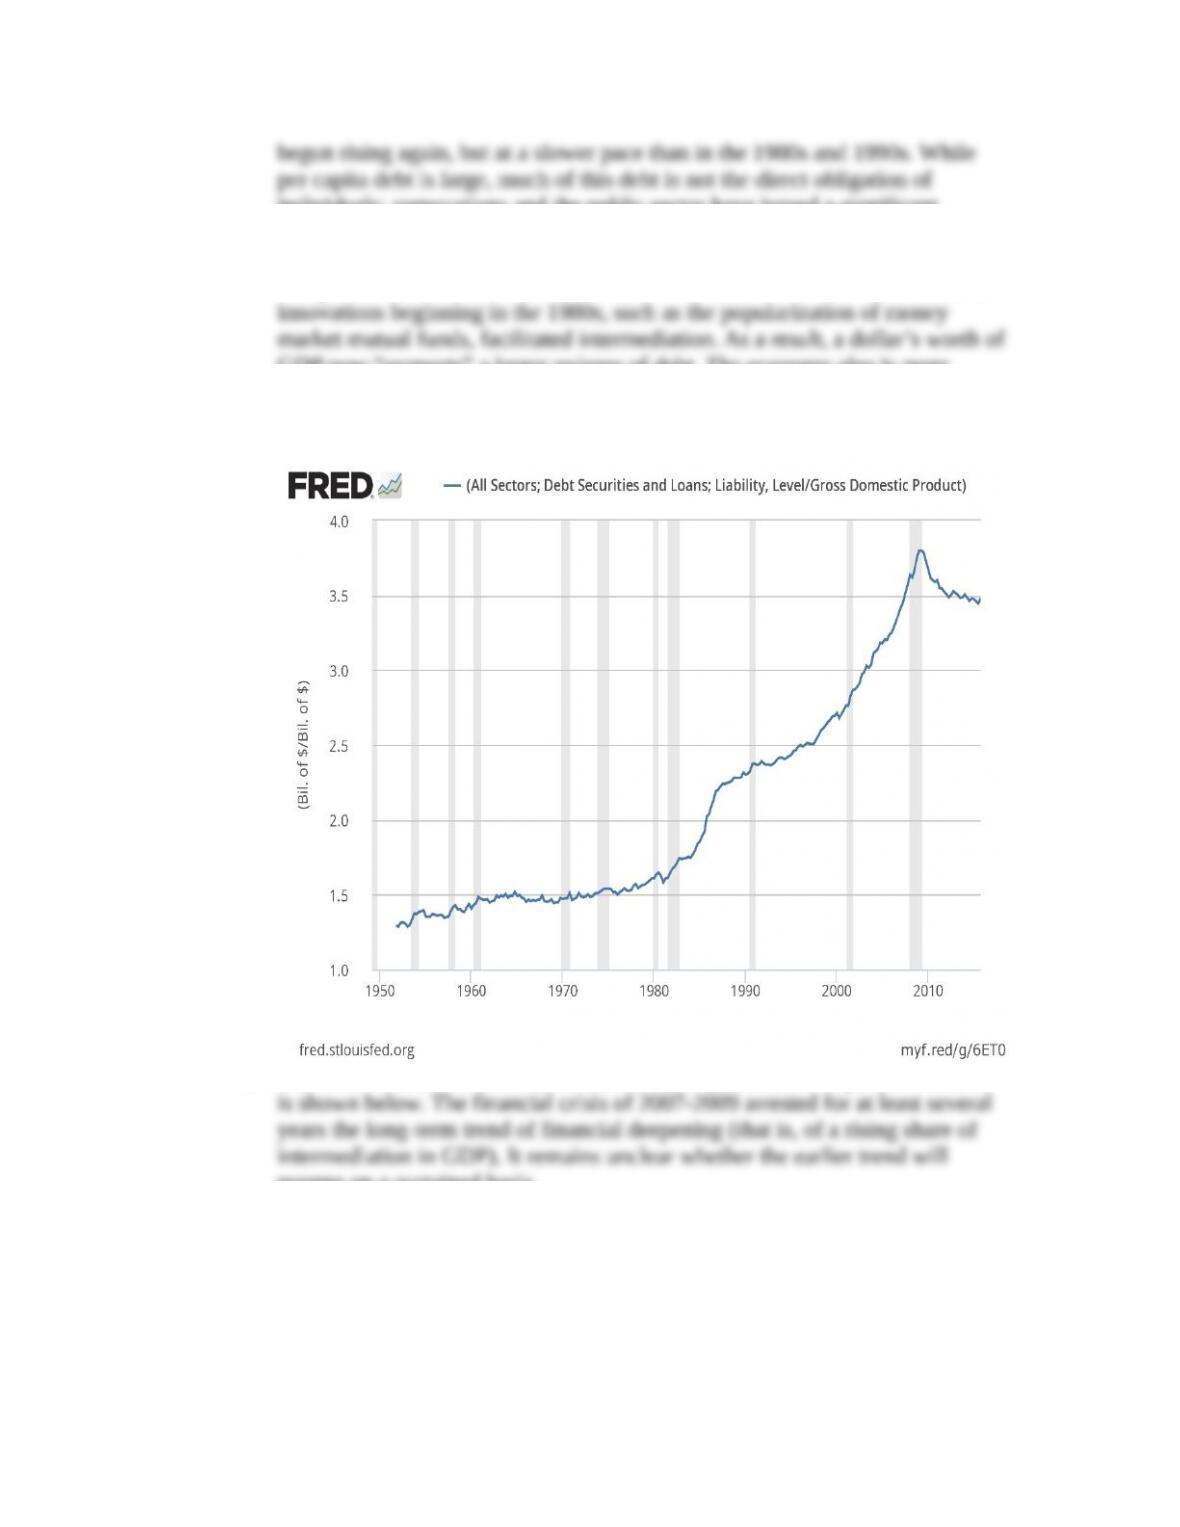
b. Plot the ratio of total credit market debt to nominal GDP (FRED code: GDP).
Interpret the plot.
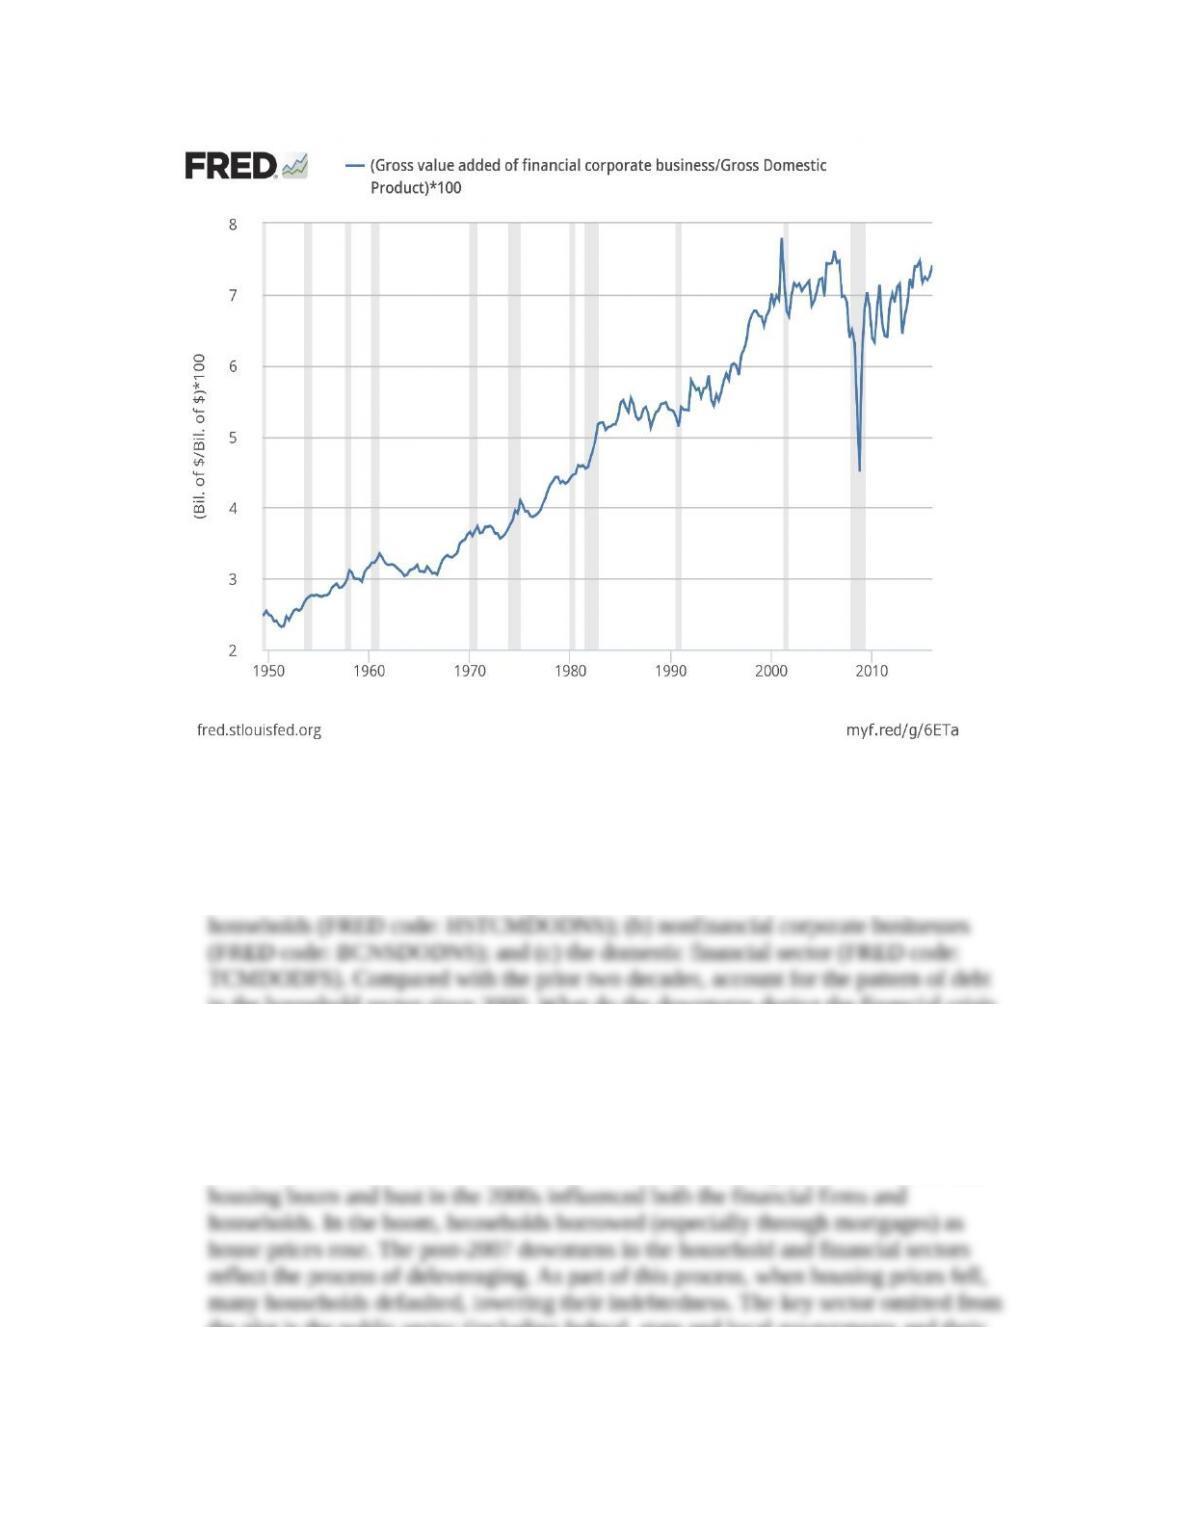
c. Plot the ratio to nominal GDP of the value added by financial corporate business
individuals; corporations and the public sector have issued a significant
portion of this debt.
b. The plot of total credit market debt relative to GDP is shown below. Financial
GDP now “supports” a larger volume of debt. The economy also is more
highly leveraged.
c. The ratio to nominal GDP of the value added by financial corporate business
resume on a sustained basis.
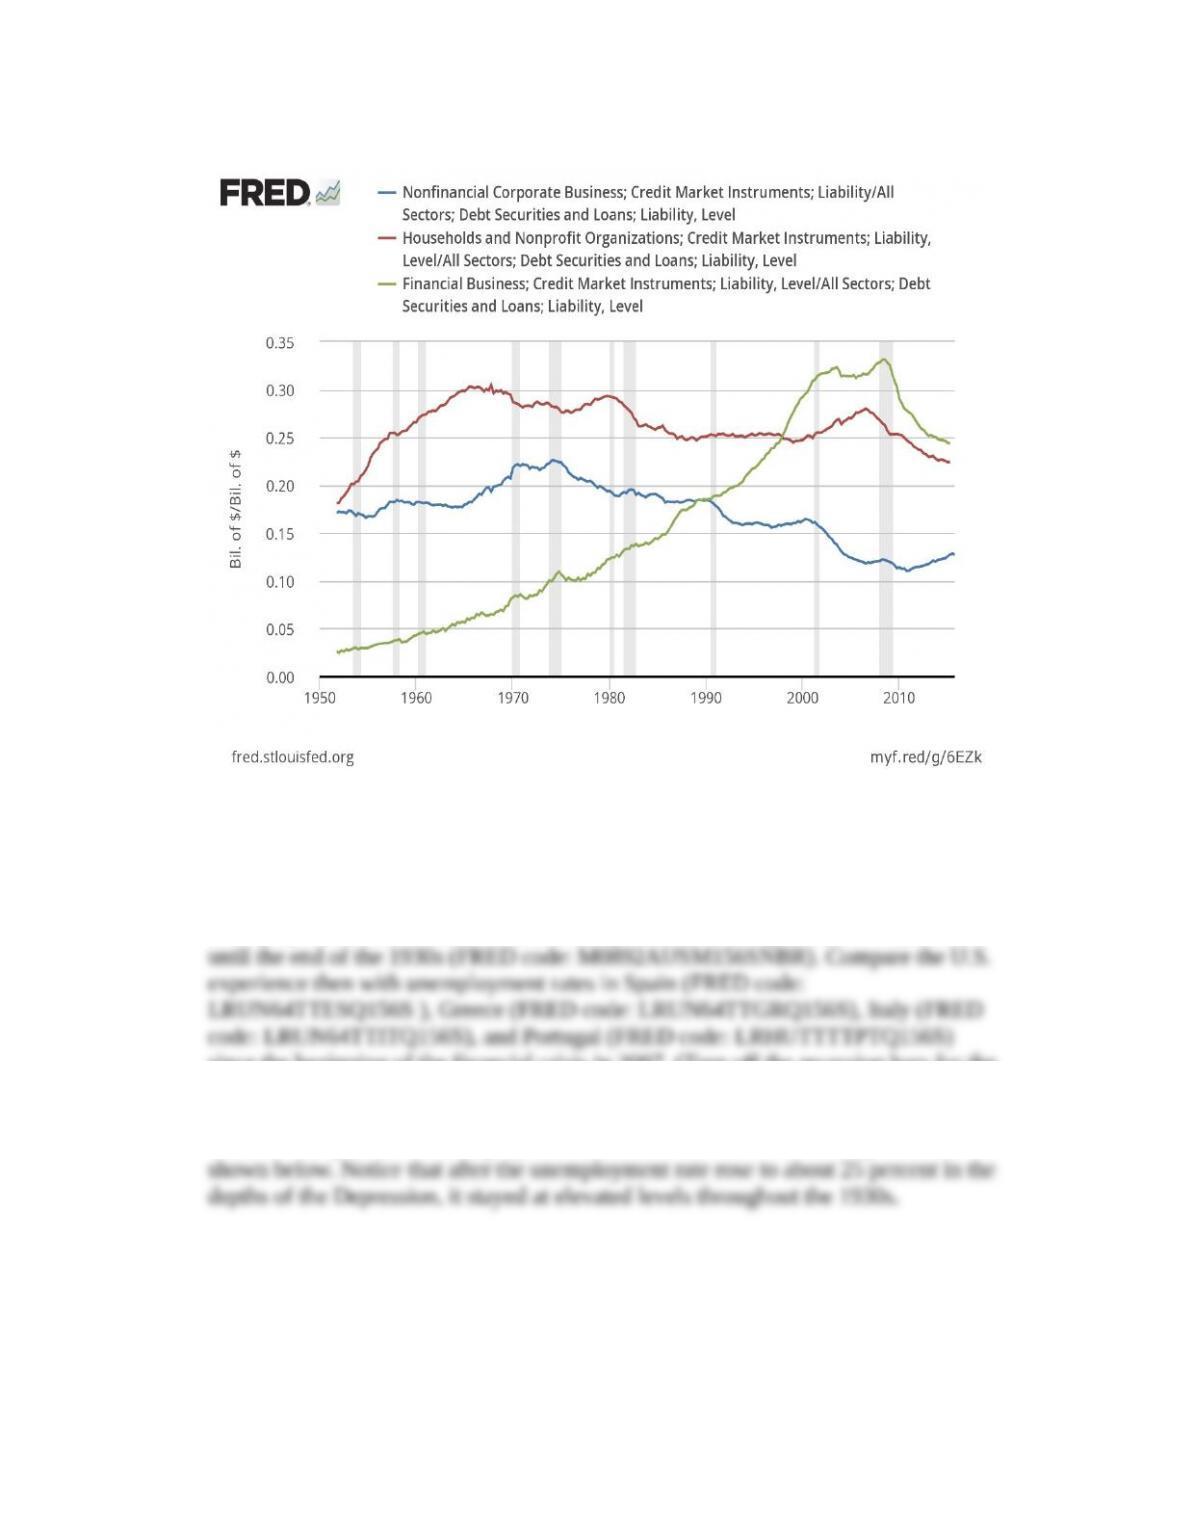
2. How has the use of credit evolved in key sectors of the economy? Plot as ratios to
total credit market debt outstanding (FRED code: TCMDO) the debt of: (a)
in the household sector since 2000. What do the downturns during the financial crisis
in the household and financial sector ratios mean in terms of leverage? What
important sector is omitted from this plot? (LO1)
Answer: The data plot for the sector ratios is below. Until the financial crisis of
2007-2009, financial firms used an increasing share of outstanding debt in support of
intermediation, while other sectors showed a mildly declining share since 1970. The
the plot is the public sector (including federal, state and local governments and their
agencies).
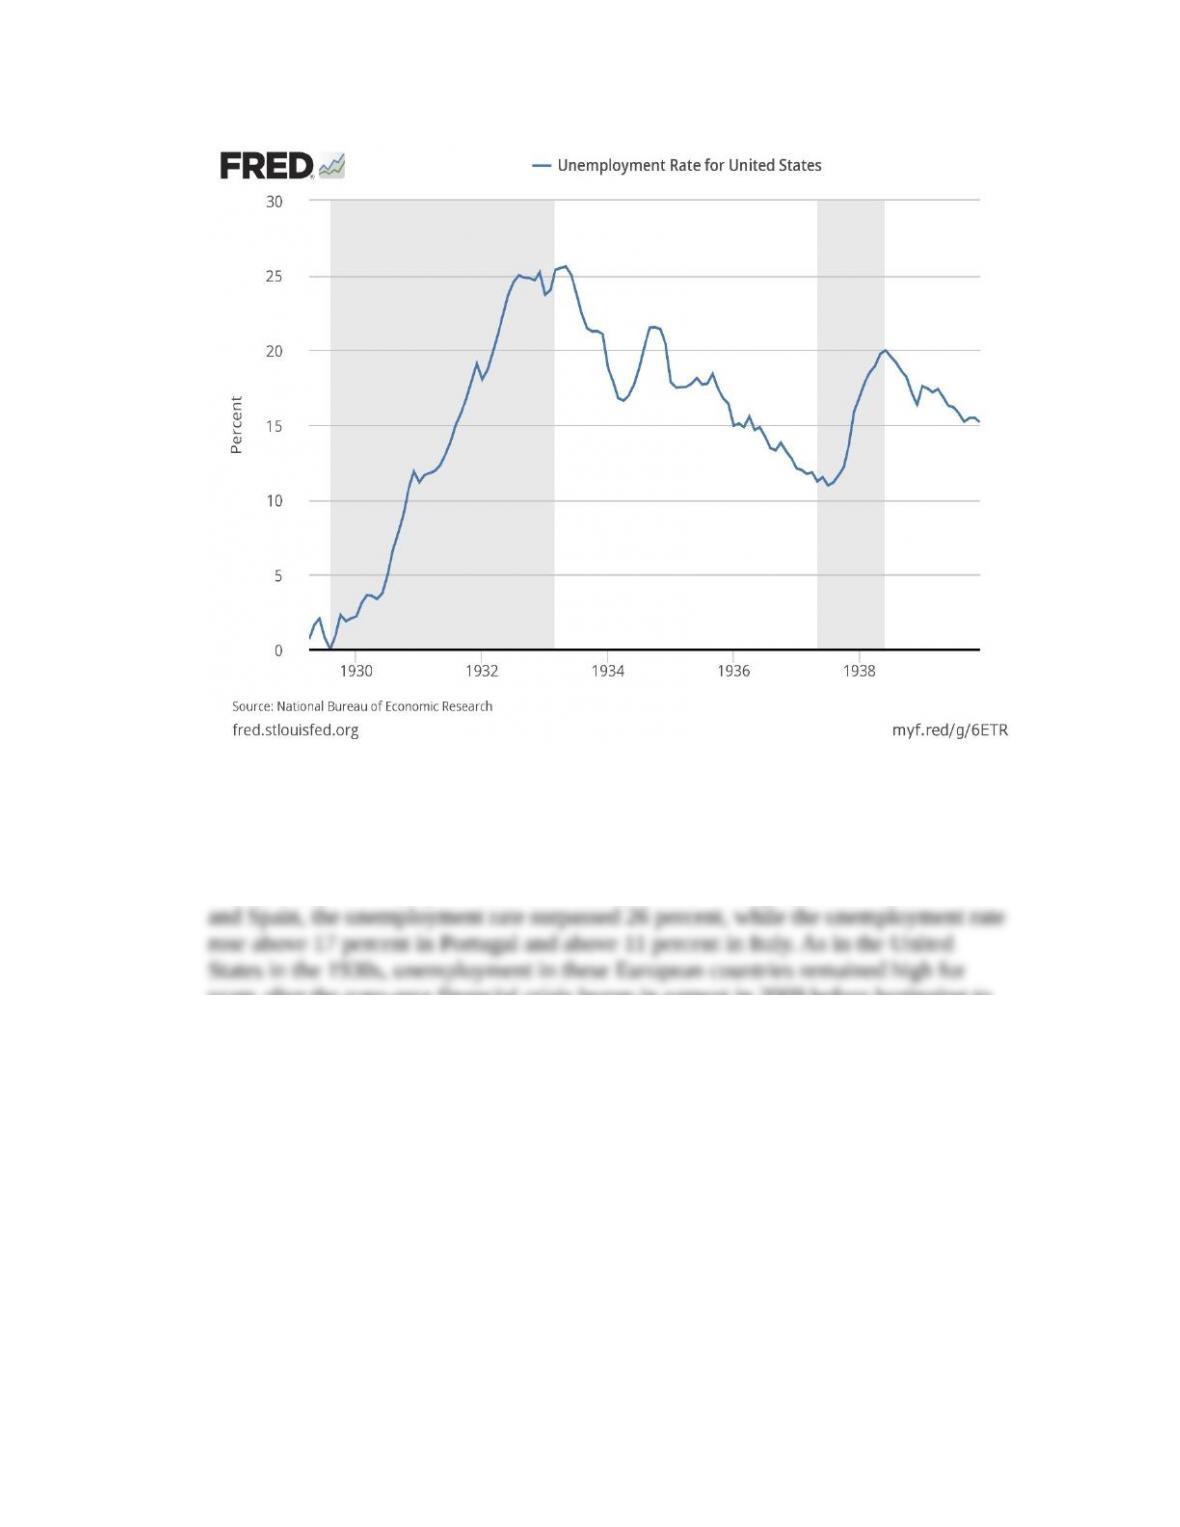
3. Financial crises are often associated with rising, and then persistently high,
unemployment rates. Plot the U.S. unemployment rate during the Great Depression
since the beginning of the financial crisis in 2007. (Turn off the recession bars for the
European data plot.) (LO3)
Answer: The plot of the unemployment rate in the U.S. in the Great Depression is
The post-2007 plot of the unemployment rate in selected European countries is shown
below. European employment conditions deteriorated through 2013: in both Greece
years after the euro-area financial crisis began in earnest in 2009 before beginning to
decline.
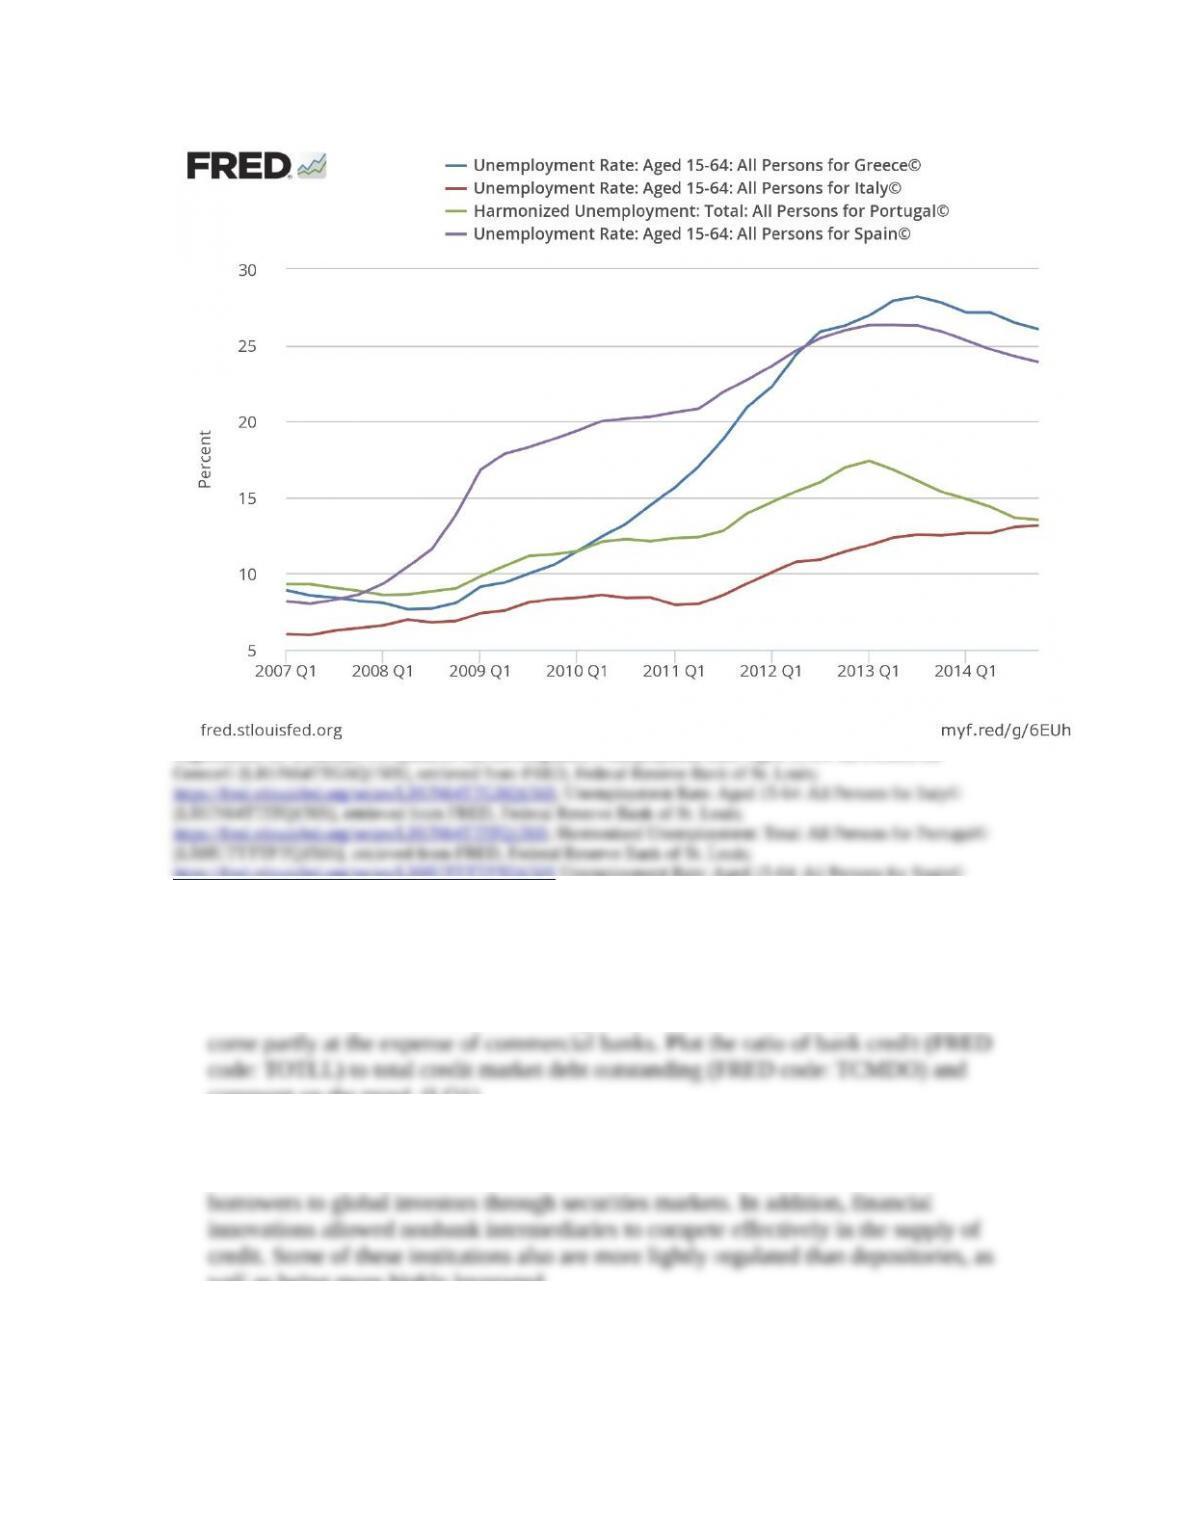
Organization for Economic Co-operation and Development, Unemployment Rate: Aged 15-64: All Persons for
https://fred.stlouisfed.org/series/LRHUTTTTPTQ156S Unemployment Rate: Aged 15-64: All Persons for Spain©
[LRUN64TTESQ156S], retrieved from FRED, Federal Reserve Bank of St. Louis;
https://fred.stlouisfed.org/series/LRUN64TTESQ156S.
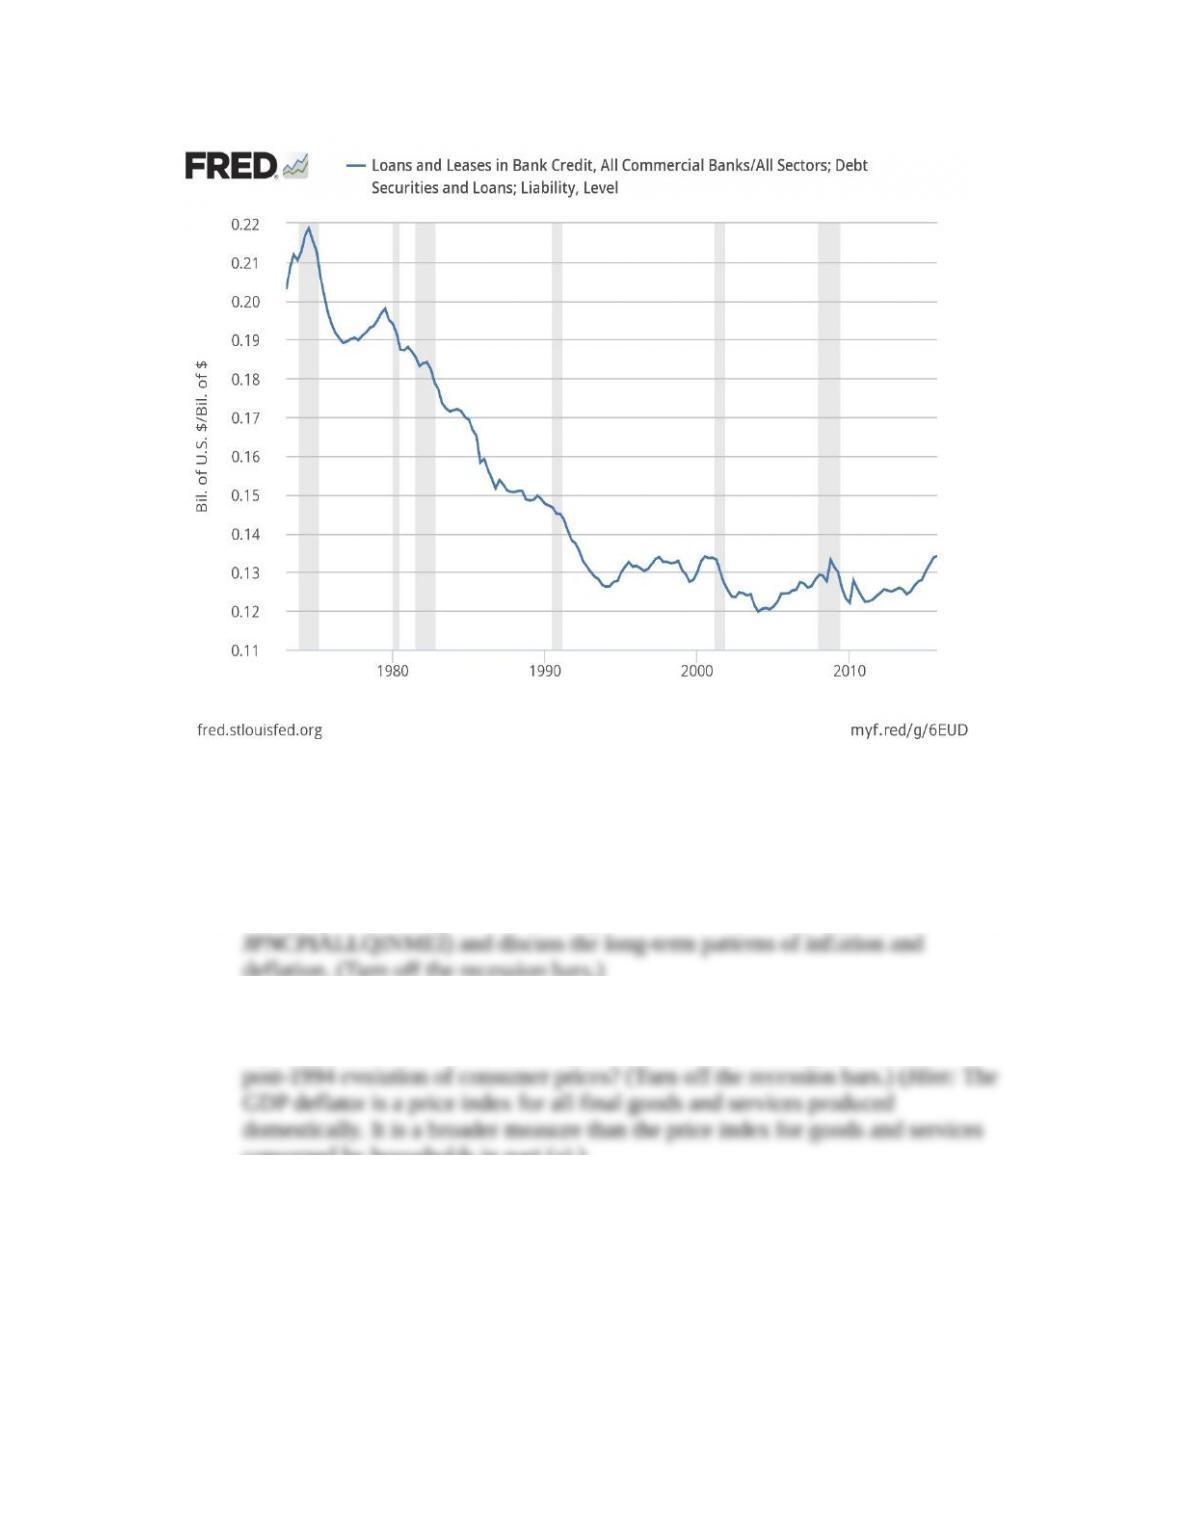
4. The rise of securities markets and the expansion of intermediation by nonbanks has
comment on the trend. (LO1)
Answer: Relative to total credit market debt, banks’ share has eroded dramatically
since the 1970s. Part of this shift reflects the increased access of nonfinancial
well as being more highly leveraged.
5. Deflation raises the real burden of repaying fixed-rate debt. Japan has recently
experienced a long deflation. (LO3)
a. Plot the percent change from a year ago of consumer prices in Japan (FRED code:
deflation. (Turn off the recession bars.)
b. Plot on a new graph the percent change from a year ago of the GDP deflator in
Japan (FRED code: JPNGDPDEFQISMEI). How does it compare with the
consumed by households in part (a).)
c. Why might deflation become self-perpetuating?
Answer:
a. The plot of inflation based on consumer prices in Japan appears below. Japan
experienced moderate to high consumer price inflation in the 1960s and
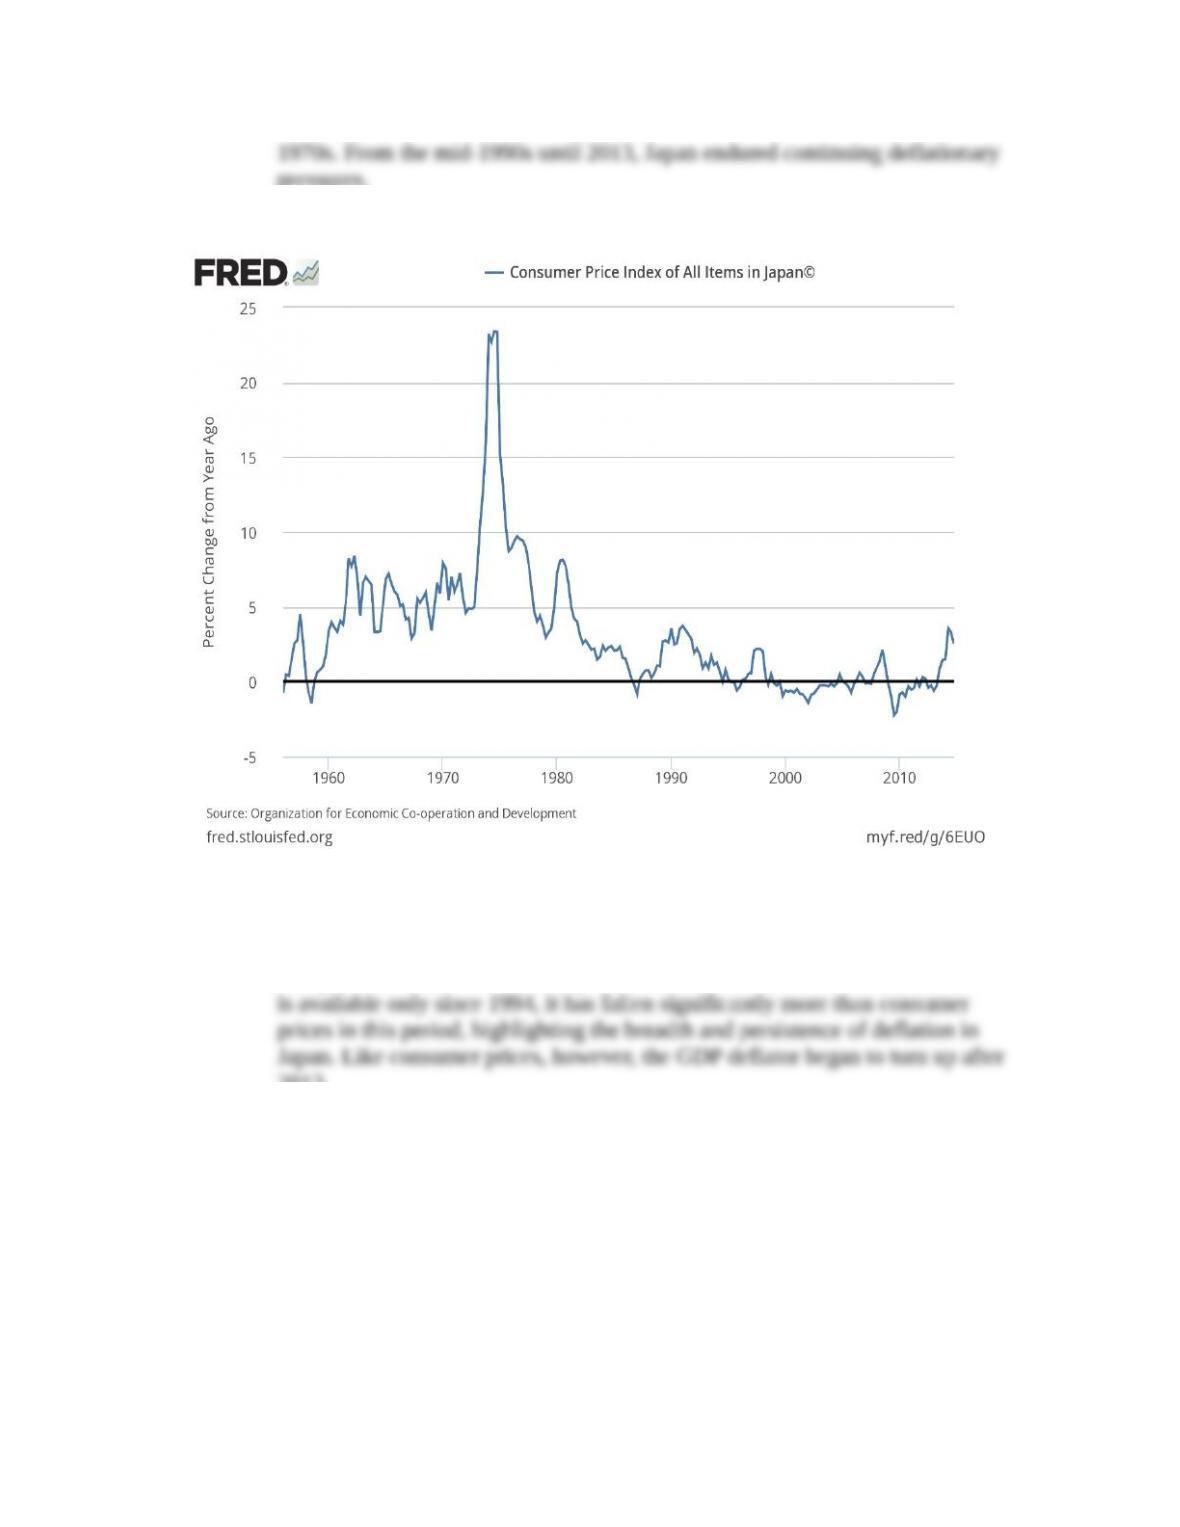
pressures.
Organization for Economic Co-operation and Development, Consumer Price Index of All Items in Japan©
[JPNCPIALLQINMEI], retrieved from FRED, Federal Reserve Bank of St. Louis;
https://fred.stlouisfed.org/series/JPNCPIALLQINMEI.
b. The plot of inflation based on Japan’s GDP deflator is below. While this index
2013.
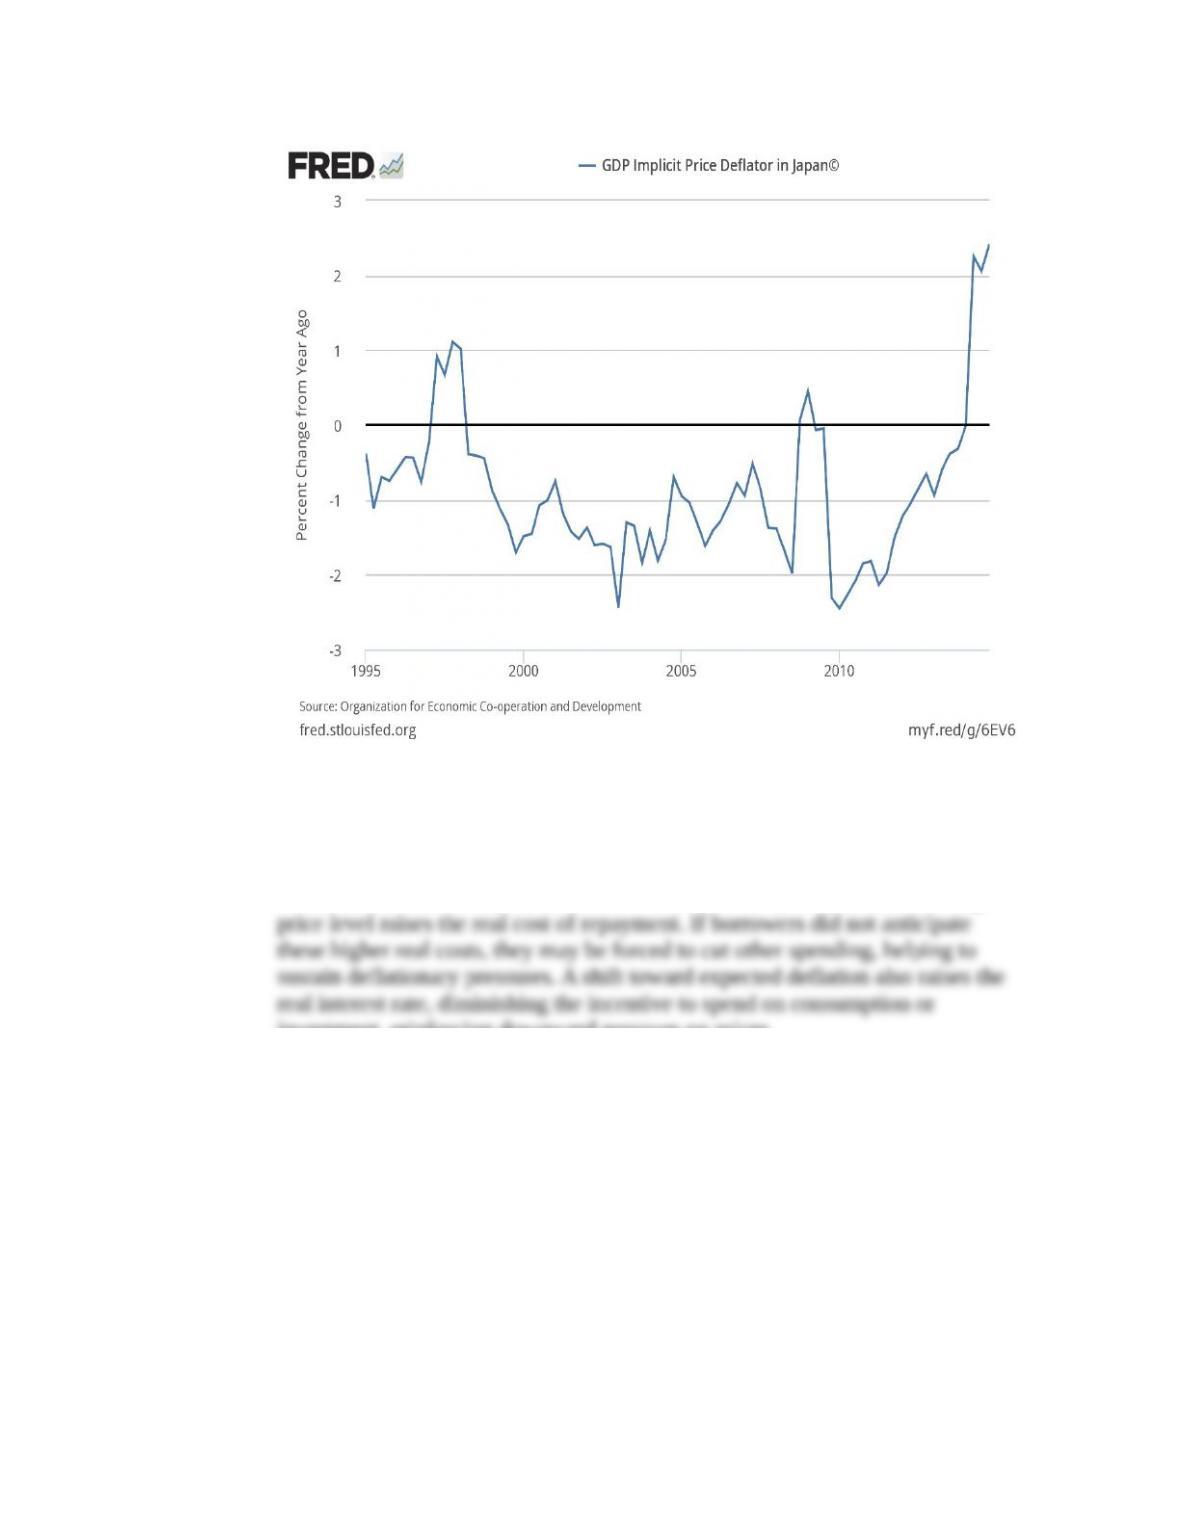
Organization for Economic Co-operation and Development, GDP Implicit Price Deflator in Japan©
[JPNGDPDEFQISMEI], retrieved from FRED, Federal Reserve Bank of St. Louis;
https://fred.stlouisfed.org/series/JPNGDPDEFQISMEI.
c. When debtors have loans denominated in fixed nominal terms, the declining
investment, reinforcing downward pressure on prices.
* indicates more difficult problems