Case 4 Teaching Note Costco Wholesale Corp. in 2016: Mission, Business Model, and Strategy
9
3. Do you think Jim Sinegal was an effective CEO? What grades would you give him in
leading the process of crafting and executing Costco’s strategy? How well is Craig Jelinek
performing as Sinegal’s successor; what grade would you give him so far in leading the
process of crafting and executing strategy? What support can you offer for these grades?
Refer to Figure 2.1 in Chapter 2 in developing your answers.
Class members are likely to approve of the way Jim Sinegal managed Costco and the overall job he did.
We suggest that you push the class to evaluate Sinegal in terms of how well he performed the five tasks of
strategic management portrayed in Figure 2.1 in Chapter 2. You might want to ask the following questions:
n Was it a good idea for Sinegal to spend time visiting Costco stores? Why or why not?
n Should Sinegal have “cross-examined” store managers pretty aggressively as he toured the stores he
visited?
n Should he expect solid, reasoned answers to the questions he posed? Should he offer suggestions?
n What should Sinegal have strived to accomplish on his store visits?
Moreover, Sinegal has done a commendable job in leading the strategy execution process at Costco. He
spends a lot of time in the stores, checking out store layouts and merchandising, speaking with employees,
and in general staying in close touch with how well things are going. He is apparently very quick to take
action when he spots ways a store can improve. In touring a Costco store with the local store manager,
Sinegal is very much the person in-charge. He functions as producer, director, and knowledgeable critic. He
cuts to the chase quickly, exhibiting intense attention to detail and pricing, wandering through store aisles
firing a barrage of questions at store managers about sales volumes and stock levels of particular items,
Case 4 Teaching Note Costco Wholesale Corp. in 2016: Mission, Business Model, and Strategy
10
Key Conclusion and Teaching Point: Jim Sinegal and Craig Jelinek have been effective CEOs. Jim
4. What core values or business principles did Jim Sinegal stress at Costco?
Two core values or business principles seem to stand out at Costco:
Jim Sinegal’s comments in the case make it clear that he is dedicated to instilling these values as part of
Costco’s culture. He seems to have drawn a line in the sand in insisting that these two values/business
principles be reected in the way Costco operates.
5. (In the event you have covered Chapter 3) What is competition like in the North American
wholesale club industry? Which of the five competitive forces is strongest and why? Use the
information in Figures 3.4, 3.5, 3.6, 3.7, and 3.8 (and the related discussions in Chapter 3) to do
a complete five-forces analysis of competition in the North American wholesale club industry.
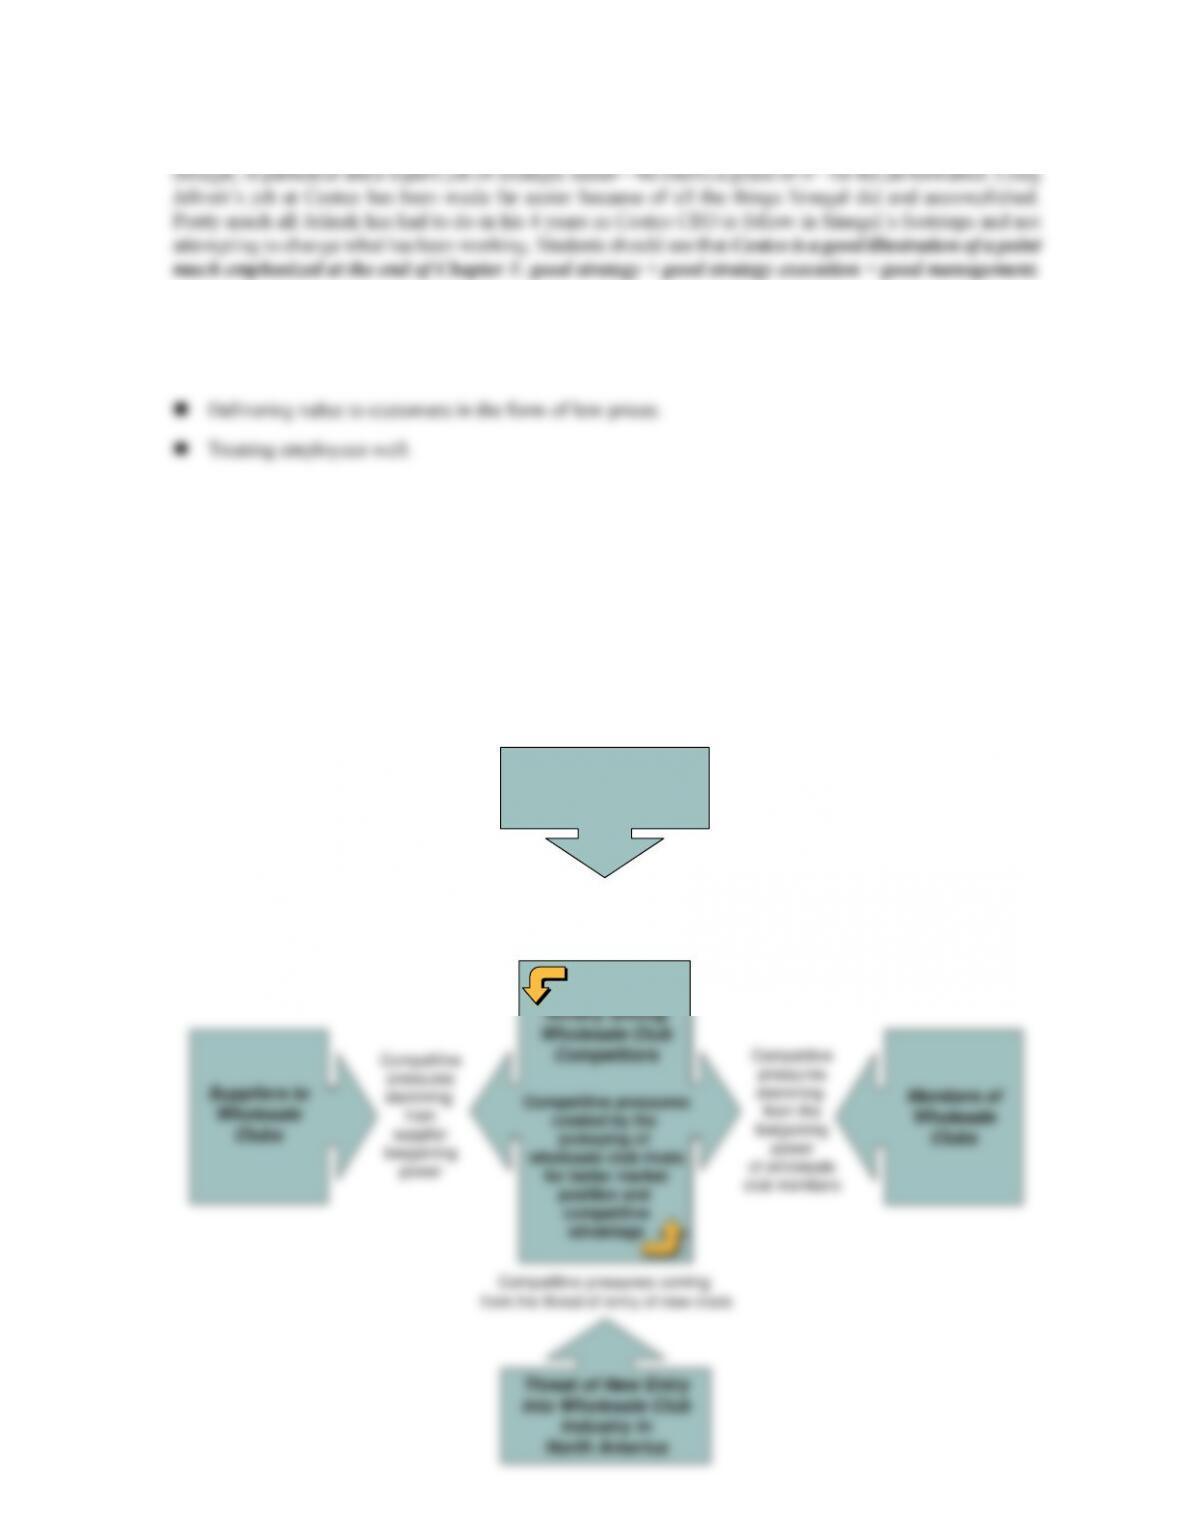
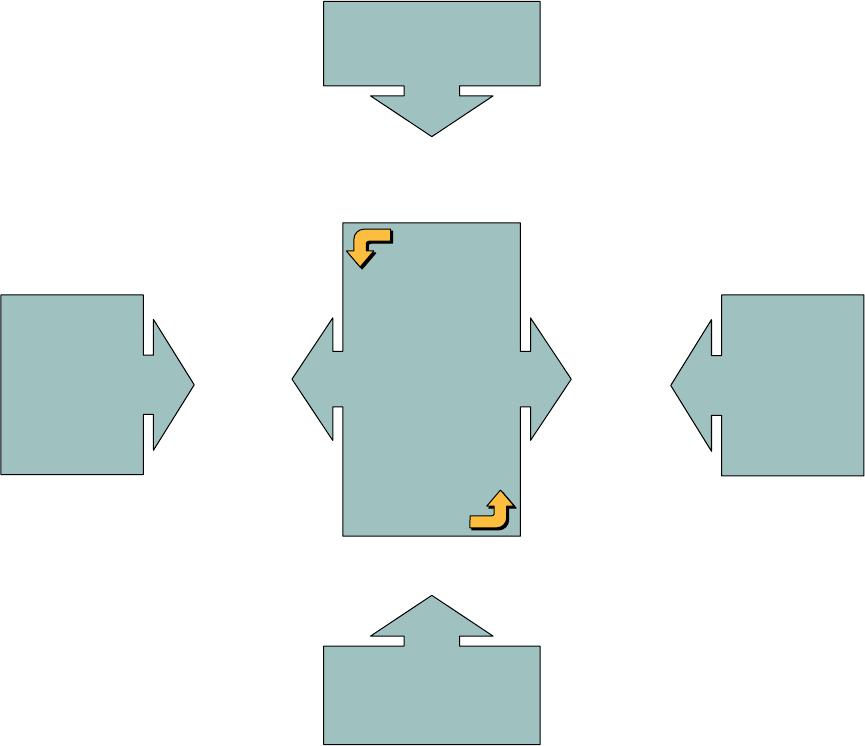
Below is a representative five-forces model of competition for the North American wholesale club industry:
Substitutes for
Shopping at
Wholesale Clubs
Competitive pressures coming from
the market attempts of other kinds
of retailers to win buyer patronage
away from wholesale clubs
Case 4 Teaching Note Costco Wholesale Corp. in 2016: Mission, Business Model, and Strategy
11
nRivalry among wholesale club competitors—a strong to fierce competitive force
In assessing this competitive force, students should draw upon the information in Figure 3.4 on p. 52 of
Chapter 3 (and the related text discussion on pp. 52-54).
The rivalry among Costco, Sam’s Club, and BJ’s Wholesale is vigorous and likely to remain so. All 3
competitors are striving to attract more members and to offer merchandise selections and a shopping
experience that will cause members to make more store visits and/or spend larger sums per visit. Rivalry is
centered on two main factors:
To a much lesser extent, rivalry also revolved around attracting members/shoppers by means of convenient
store locations, a comparatively pleasant big-box shopping environment, and maybe even satisfactory
checkout speeds.
Class members should cite several factors (displayed in Figure 3.4 and Table 3.2 on p. 55 of Chapter3) as
working to intensify rivalry among the three warehouse club competitors in North America:
nAll 3 club rivals are aggressively pursuing top-line revenue growth (chiey by opening new stores,
attracting more members at both new and existing stores, and endeavoring to grow sales revenues
and shopper traffic at existing stores). The industry is becoming somewhat mature (which strengthens
rivalry); achieving fast revenue growth is heavily dependent on the speed with which rivals open new
stores and grow sales at existing stores.
nWeak to modest degrees of product line differentiation from club to club. There is considerable similarity
in the merchandise offerings of all three clubs (which enhances rivalry).
Case 4 Teaching Note Costco Wholesale Corp. in 2016: Mission, Business Model, and Strategy
12
Factors that might be cited as making rivalry weaker include:
nThe differentiation that exists from club to club (as concerns product selection, shopping ambience,
and convenient access to store locations)—this differentiation poses a barrier to switching to the extent
that some bargain-hunting shoppers prefer shopping at one club versus another when there are multiple
clubs to choose from in their shopping area, thus acting to weaken rivalry.
But this one factor is not powerful enough to overcome the combination of factors acting to strengthen
rivalry.
Conclusions concerning the threat of entry. All things considered, a newcomer’s prospects for
attractive profitability appear slim indeed. This is a low-margin business to begin with (with profits coming
chiey from membership fees). What outside company (besides perhaps Target—and that is a big and risky
perhaps) really would want to come in to this industry and do battle head-to-head with Costco, Sam’s, and
BJ’s in such a low-margin industry? It makes little or no business sense.
In short, the pool of candidates for fresh entry into warehouse club industry is small and the likelihood of
fresh entry in 2012 and beyond is equally small, making the competitive pressures from the threat of new
entry virtually non-existent.
Case 4 Teaching Note Costco Wholesale Corp. in 2016: Mission, Business Model, and Strategy
13
nThe bargaining power and leverage of suppliers to the warehouse club industry—a moderate to
weak competitive force.
In assessing this competitive force, students should refer to Figure 3.7 on p. 61 and the related discussion on
pp. 60-62 of Chapter 3.
The suppliers consist mainly of the manufacturers of the products that warehouse clubs elect to stock. While
a big fraction of these manufacturers are undoubtedly large enterprises with well-recognized brand names
and good reputations among consumers, they are not necessarily in a strong bargaining position that allows
them to dictate the terms and conditions on which they will sell their wares to the warehouse clubs.
Costco and Sam’s, in particular, have considerable buying power and bargaining leverage in obtaining the
merchandise they desire to stock. If a particular manufacturer chooses not to sell to the wholesale clubs
Conclusion: The suppliers to the wholesale clubs tend to be a relatively weak competitive force—weak in
nThe bargaining power and leverage of customers (the members of wholesale clubs)—a very weak
competitive force
In assessing this competitive force, students should refer to Figure 3.8 and the related discussion on pp. 62-
64 of Chapter 3.
Wholesale club members buy in relatively small quantities; no single member accounts for a meaningful
fractions of a wholesale club’s total sales. Consequently, individual members of wholesale clubs have
essentially no power or leverage to bargain with a wholesale club over the prices they will pay or over
other terms and conditions of sale. A member can certainly not purchase a particular item (and obtain it for
Case 4 Teaching Note Costco Wholesale Corp. in 2016: Mission, Business Model, and Strategy
14
In perusing all the factors that result in strong buyer bargaining power (discussed on pp. 67-70 and
summarized in Figure 3.8), class members should conclude that wholesale clubs face little to no competitive
pressure of any consequence stemming from the bargaining power of their members. In support of this
position, they can argue that:
• Buyers/members are small, numerous, and buy in relatively small quantities.
• There’s no evidence indicating that clubs are frequently so overstocked with certain merchandise
that a single member is able to bargain down the posted price of overstocked items.
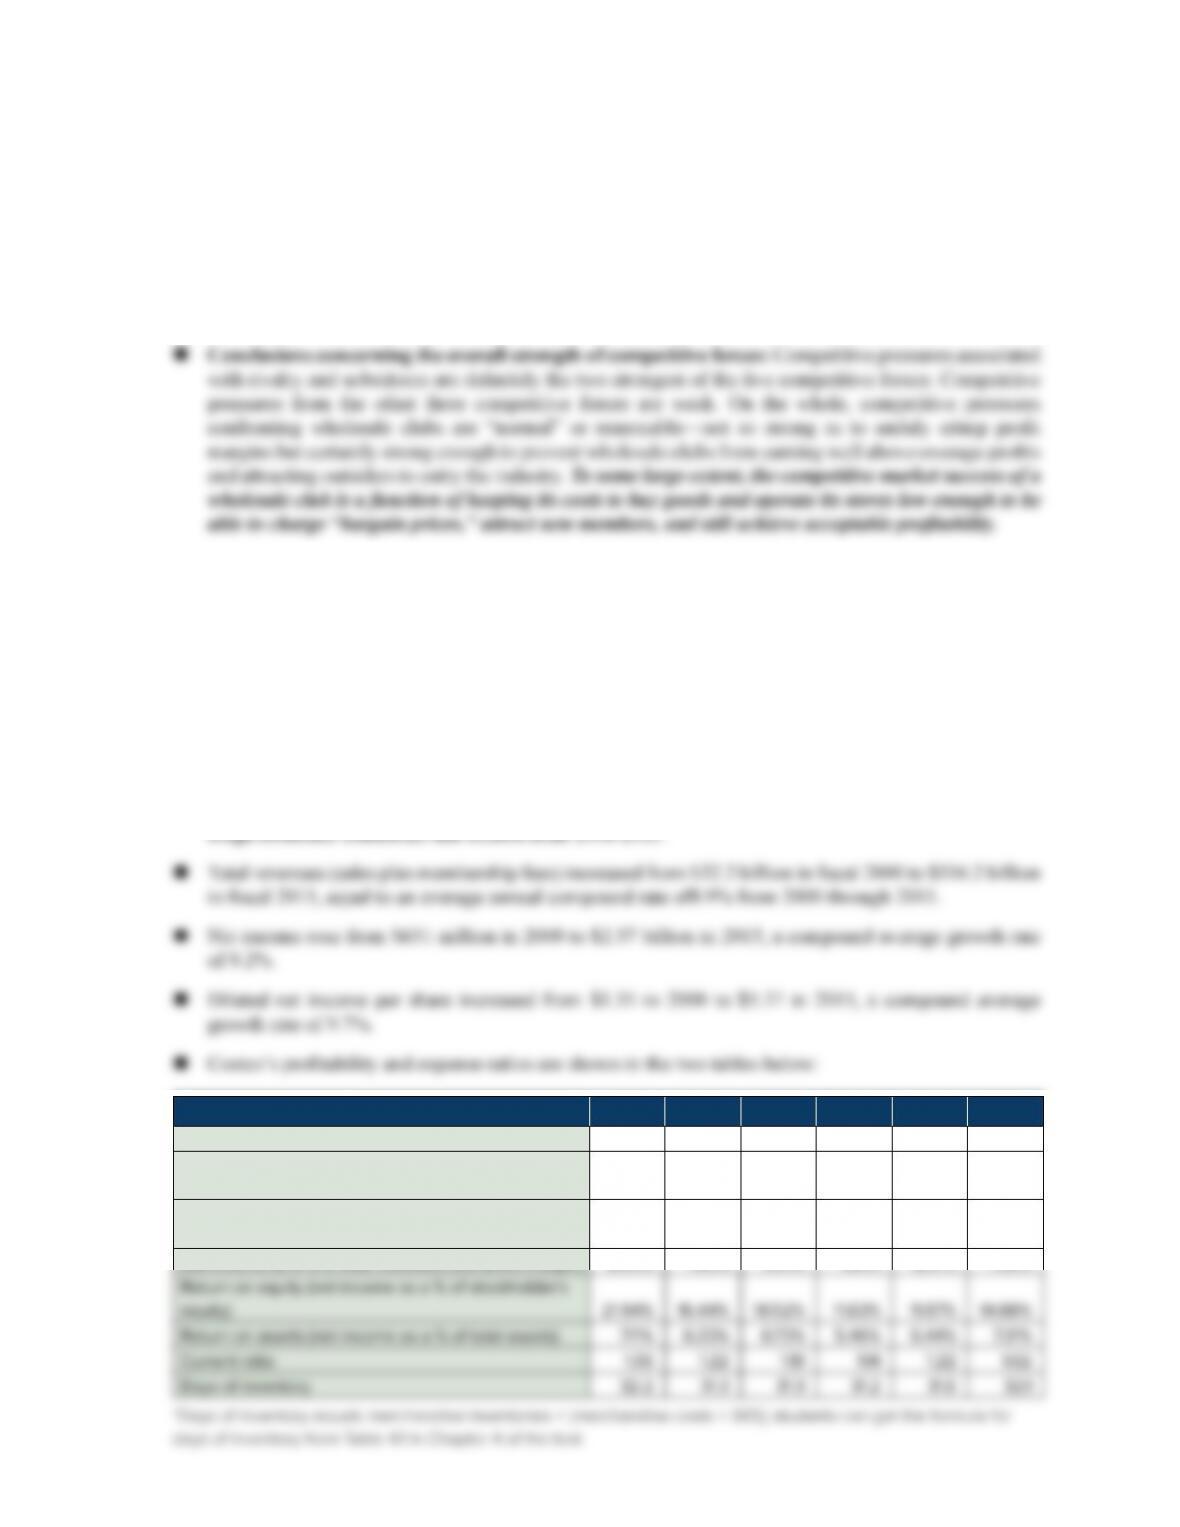
6. How well is Costco performing from a financial perspective? Do some number-crunching
using the data in case Exhibit 1 to support your answer. Use the financial ratios presented in
Table 4.1 of Chapter 4 (pages 85-87) to help you diagnose Costco’s financial performance.
The financial and operating summary in case Exhibit 1 indicate that Costco’s financial performance during
the 2000-2015 period has been good (but short of what could be termed “excellent”, partly, of course, due
to the challenging macroeconomic conditions in North America that prevailed in 2008-2011). Students can
point to any of several statistics and measures to support this conclusion:
n Net sales increased from $31.6 billion in fiscal 2000 to $113.6 billion in fiscal 2015, equal to a
compound average growth rate (CAGR) of 8.9% since 2000; this growth rate is respectable given the
tough economic conditions that existed from 2008-2011.
2015 2014 2013 2011 2005 2000
Merchandise costs as a % of sales 88.91% 89.34% 89.38% 89.31% 89.37% 89.57%
Selling, general, and administrative expenses
as a % of total revenues 9.85% 9.68% 9.61% 9.76% 9.53% 8.57%
Operating income as a % of total revenues (operating
profit margin) 3.12% 2.86% 2.90% 2.74% 2.78% 3.22%
Net income as a % of total revenues (net profit margin) 2.05% 1.83% 1.94% 1.64% 2.01% 1.96%
Case 4 Teaching Note Costco Wholesale Corp. in 2016: Mission, Business Model, and Strategy
15
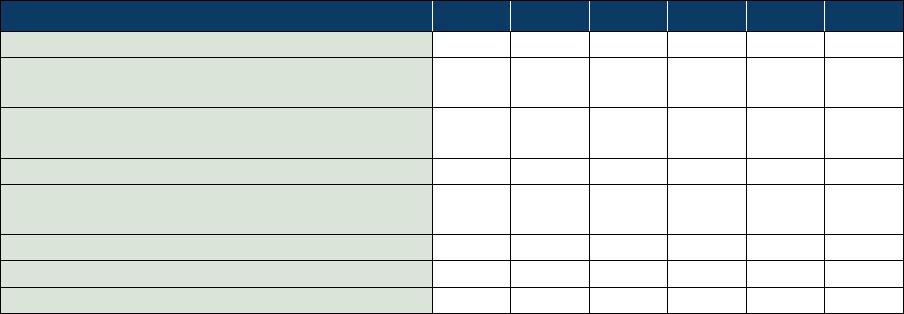
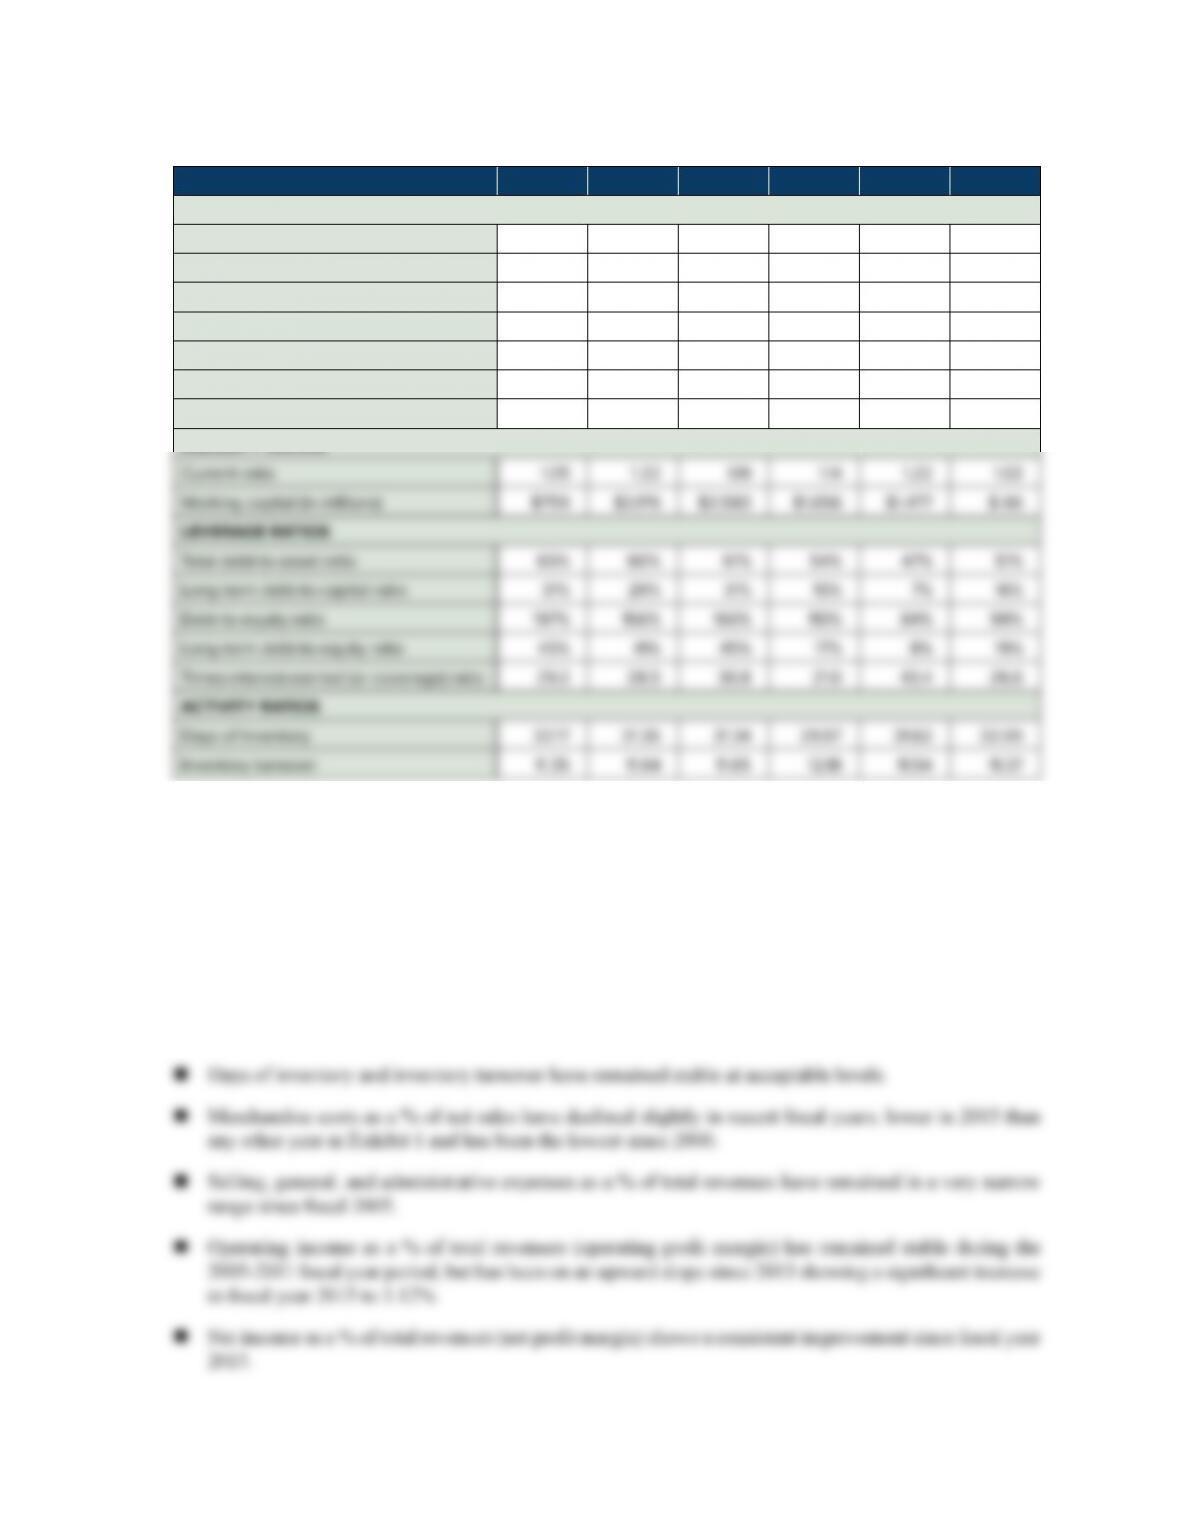
TABLE 1. Other Financial Ratios for Costco, 2000–2015
2015 2014 2013 2011 2005 2000
PROFITABILITY RATIOS
Gross profit margin 13.02% 12.59% 12.56% 12.57% 12.45% 11.95%
Operating profit margin 3.12% 2.86% 2.90% 2.74% 2.79% 3.23%
Net profit margin 2.07% 1.85% 1.96% 1.73% 2.01% 1.97%
Total return on assets 7.75% 6.79% 7.27% 6.34% 6.85% 8.09%
Net return on total assets (ROA) 7.37% 6.44% 6.93% 5.90% 6.64% 7.62%
Return on Stockholder’s equity (ROE) 22.22% 16.68% 18.72% 12.26% 11.98% 14.93%
Return on invested capital (ROIC) 15.34% 11.86% 12.87% 10.47% 11.09% 12.58%
LIQUIDITY RATIOS
Costco’s profitability ratios have stayed pretty steady over the years going up slightly in 2015. Return on
stockholder’s equity increased significantly from 2014 to 2015, indicating a better return on shareholder’s
investment in the company.
nThe current ratio decreased from 1.22 in 2014 to 1.05 in 2015 but is not alarmingly low. Working
capital also decreased quite a bit in year 2015, primarily due to the use of internal cash ows for store
expansion.
nLeverage ratios have increased over the years indicating more debt financing in comparison to assets
and stockholder’s equity. Long term debt to capital ratio is above industry standard but below excessive
reliance on long term debt. Debt to equity ratio indicates more debt over equity financing.
Case 4 Teaching Note Costco Wholesale Corp. in 2016: Mission, Business Model, and Strategy
16
nReturn on equity dropped from 18.52% in fiscal 2013 to 16.44% in fiscal 2014, then climbed back to
21.94% in fiscal 2015. Return on equity has almost doubled since fiscal 2011.
n Return on assets has trended upward since 2011.
n The company’s liquidity is adequate, as indicated by the slightly above 1.0 current ratio levels in fiscal
years 2000, 2005-2011, 2013-2015.
n Days of inventory at Costco have remained quite stable in the 29-32 days range; inventories of about
1-month seem very reasonable. Costco management appears to have done a good job of inventory
control.
Conclusions regarding the data in case Exhibit 1: Costco’s financial performance has improved
steadily since 2011 but significantly in the most recent fiscal year 2015. Profit margins, return on equity, and
return on assets have gone up overall since fiscal 2011. There was a slight decline from 2011 to 2013 but an
immediate recovery took place in fiscal 2015. SG&A expenses as a % of total revenues have been creeping
upward. In 2015, overall performance was better than in the 4 prior years.
You might also ask the class for their appraisal of the geographic operating data in case Exhibit 4. Here it
can be seen that:
nCostco’s biggest geographic market and also its biggest source of profit (from a total dollar standpoint)
is the United States.
nIn fiscal 2015, Costco’s operating profit margin (operating income as a % of total revenue, including
membership fees) was 2.73% in the U.S., 4.4% in Canada, and 3.7% in all other countries.
nIn fiscal 2010, Costco’s operating profit margin) was 2.2% in the U.S., 4.4% in Canada, and 3.5% in all
other countries.