Chapter 40 – International Trade
40–12
Feedback: The correct answer is that $95 could be the equilibrium international price of
fish if Iceland and Japan began trading fish with each other.
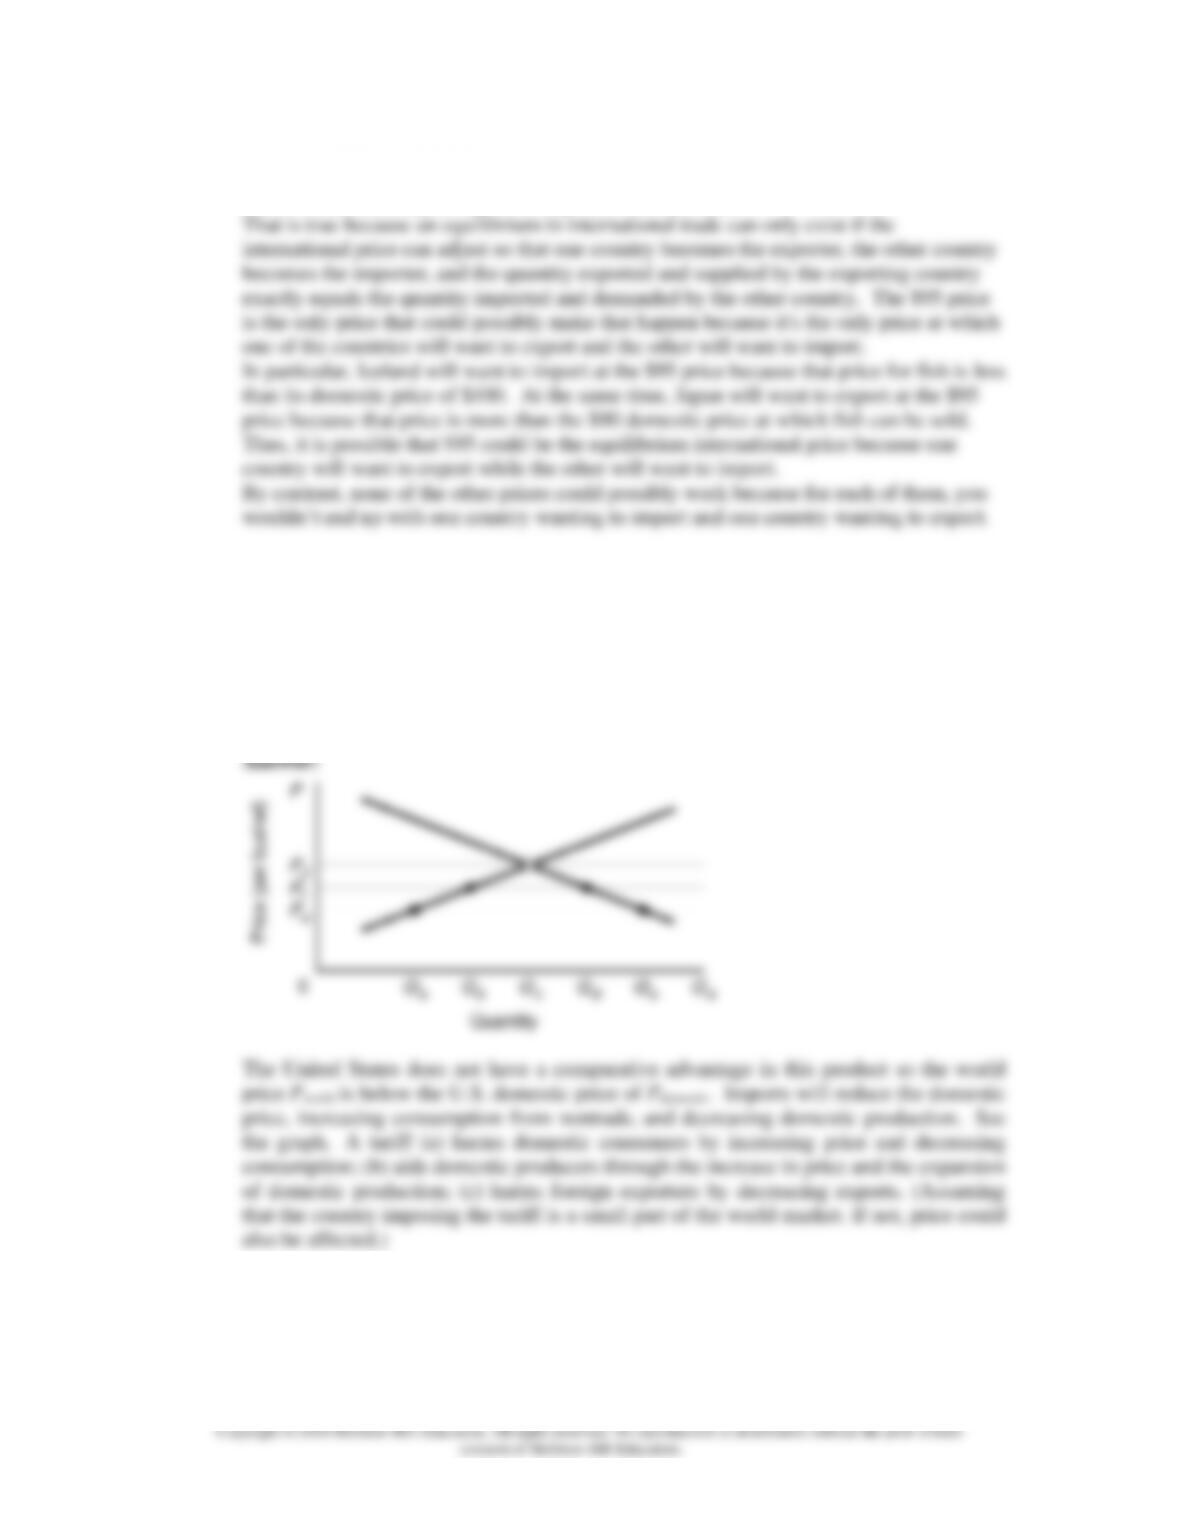
12. Draw a domestic supply-and-demand diagram for a product in which the United States does
not have a comparative advantage. What impact do foreign imports have on domestic price and
quantity? On your diagram show a protective tariff that eliminates approximately one-half of the
assumed imports. What are the price-quantity effects of this tariff on (a) domestic consumers, (b)
domestic producers, and (c) foreign exporters? How would the effects of a quota that creates the
same amount of imports differ? LO4
Chapter 40 – International Trade
40–13
13. American apparel makers complain to Congress about competition from China. Congress
decides to impose either a tariff or a quota on apparel imports from China. Which policy would
Chinese apparel manufacturers prefer? LO4
a. Tariff.
b. Quota.
PROBLEMS
1. Assume that the comparative-cost ratios of two products—baby formula and tuna fish—are as
follows in the nations of Canswicki and Tunata:
Canswicki: 1 can baby formula ≡ 2 cans tuna fish
Tunata: 1 can baby formula ≡ 4 cans tuna fish
In what product should each nation specialize? Which of the following terms of trade would be
acceptable to both nations: (a) 1 can baby formula ≡ 2 1/2 cans tuna fish; (b) 1 can baby formula
≡ 1 can tuna fish; (c) 1 can baby formula ≡ 5 cans tuna fish? LO2
Chapter 40 – International Trade
40–14
Feedback: The opportunity cost of producing 1 can of baby formula in Canswicki is 2
cans of tuna fish.
The opportunity cost of producing 1 can of baby formula in Tunata is 4 cans of tuna fish.
Since the opportunity cost of producing baby formula is lower in Canswicki, this implies
Canswicki should produce baby formula. This also implies that Tunata should specialize
in producing Tuna.
We can also look at the opportunity cost of producing cans of tuna fish (in terms of
foregone cans of baby formula).
The opportunity cost of producing 1 can of tuna fish in Canswicki is 1/2 a can of baby
formula.
The opportunity cost of producing 1 can of tuna fish in Tunata is 1/4 a can of baby
formula.
Since the opportunity cost of producing tuna fish is lower in Tunata, this implies Tunata
should produce tuna fish. This also implies that Canswicki should specialize in producing
baby formula.
Which of the following terms of trade would be acceptable to both nations:
(c) 1 can baby formula ≡ 5 cans tuna fish?
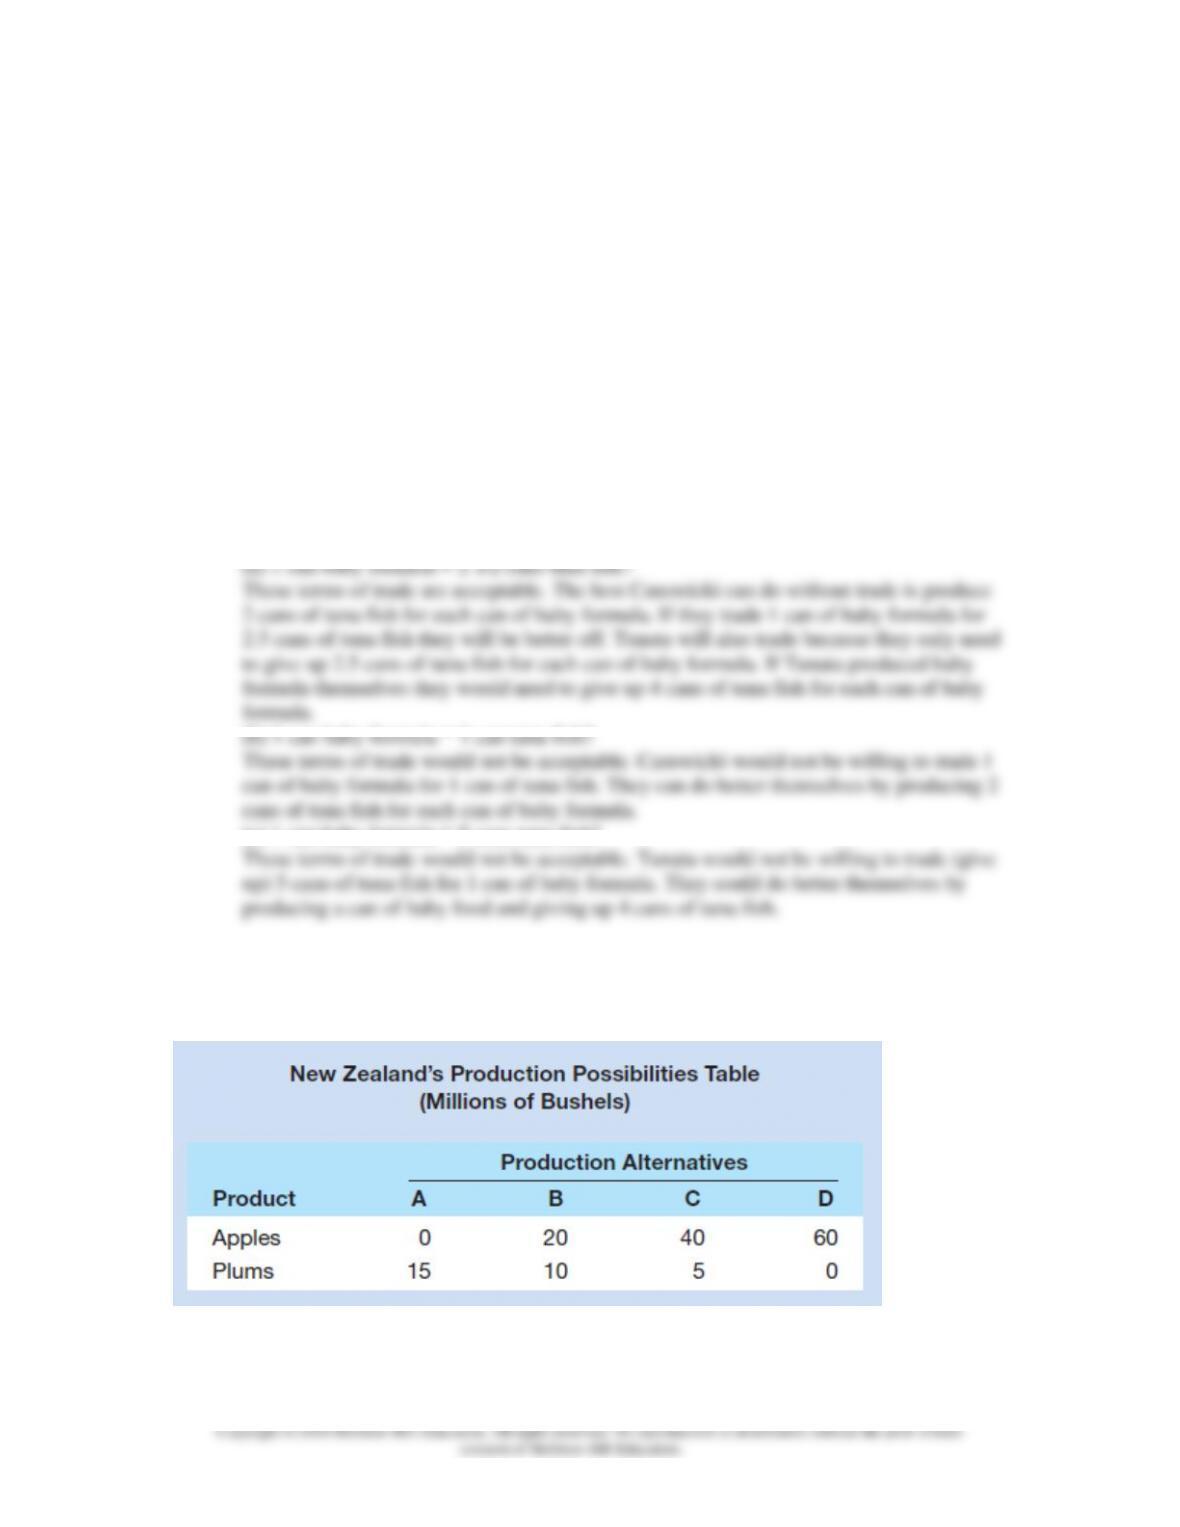
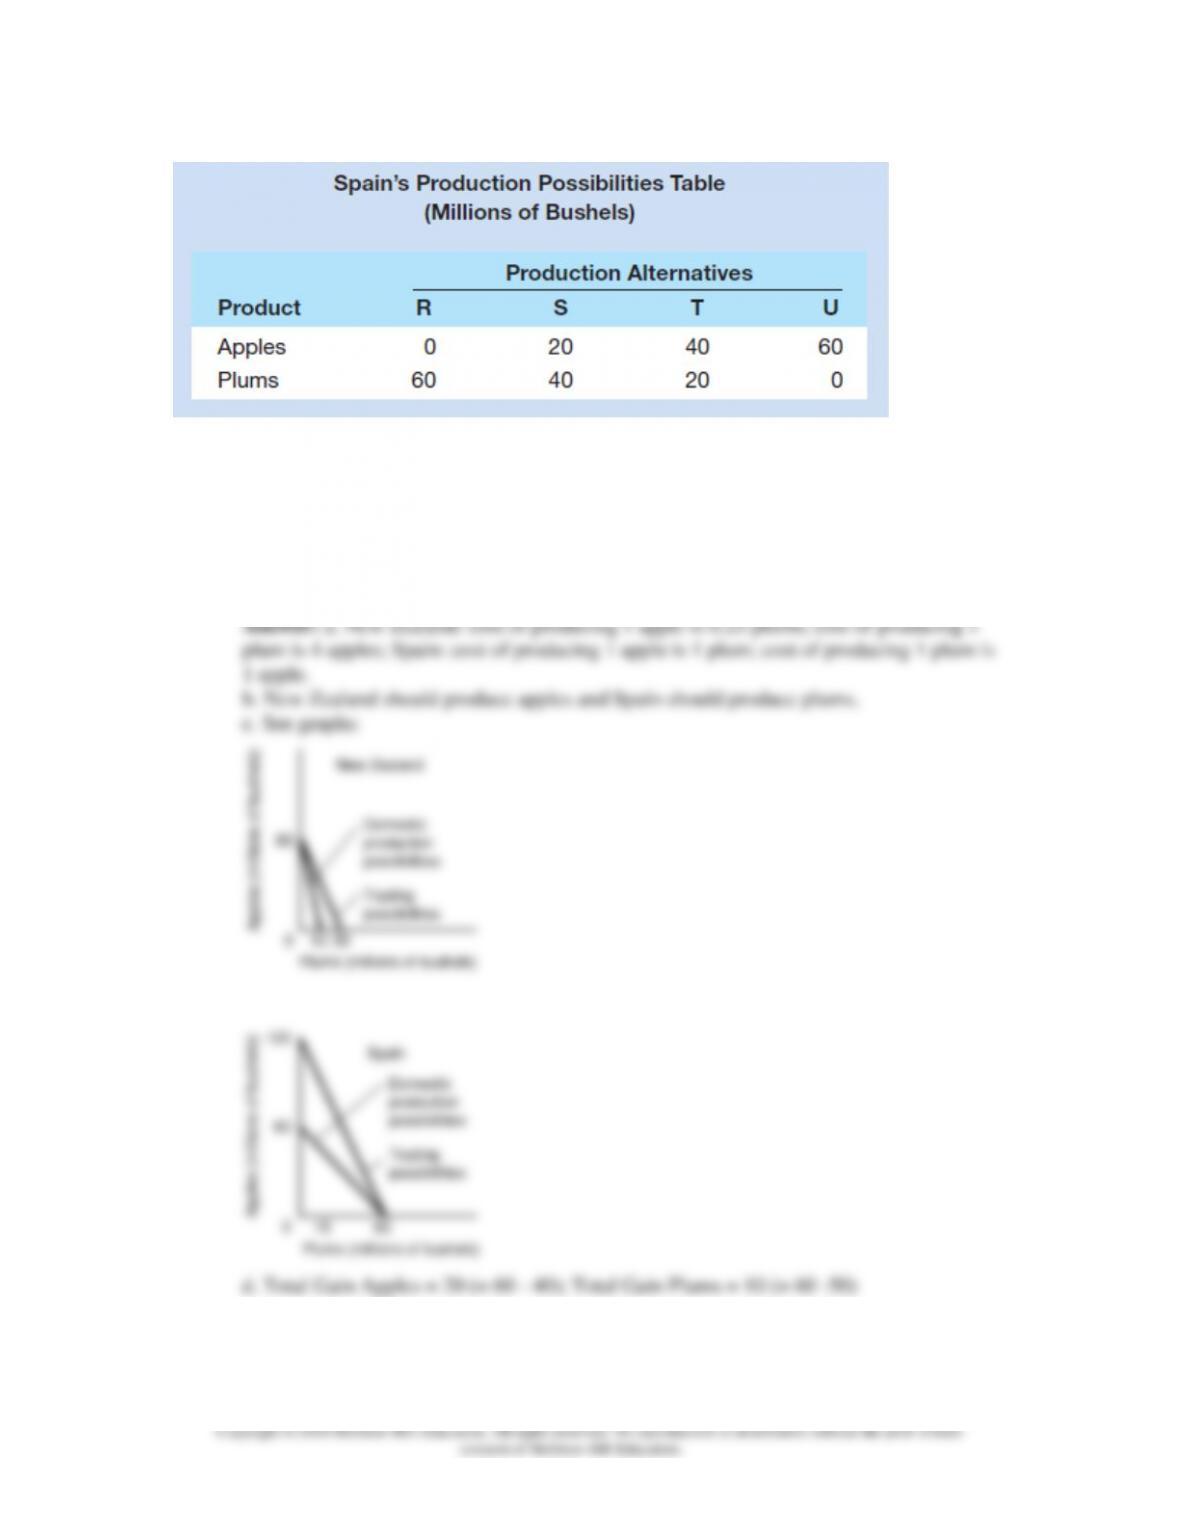
2. The accompanying hypothetical production possibilities tables are for New Zealand and Spain.
Each country can produce apples and plums. Plot the production possibilities data for each of the
two countries separately. Referring to your graphs, answer the following: LO2
Chapter 40 – International Trade
40–15
a. What is each country’s cost ratio of producing plums and apples?
b. Which nation should specialize in which product?
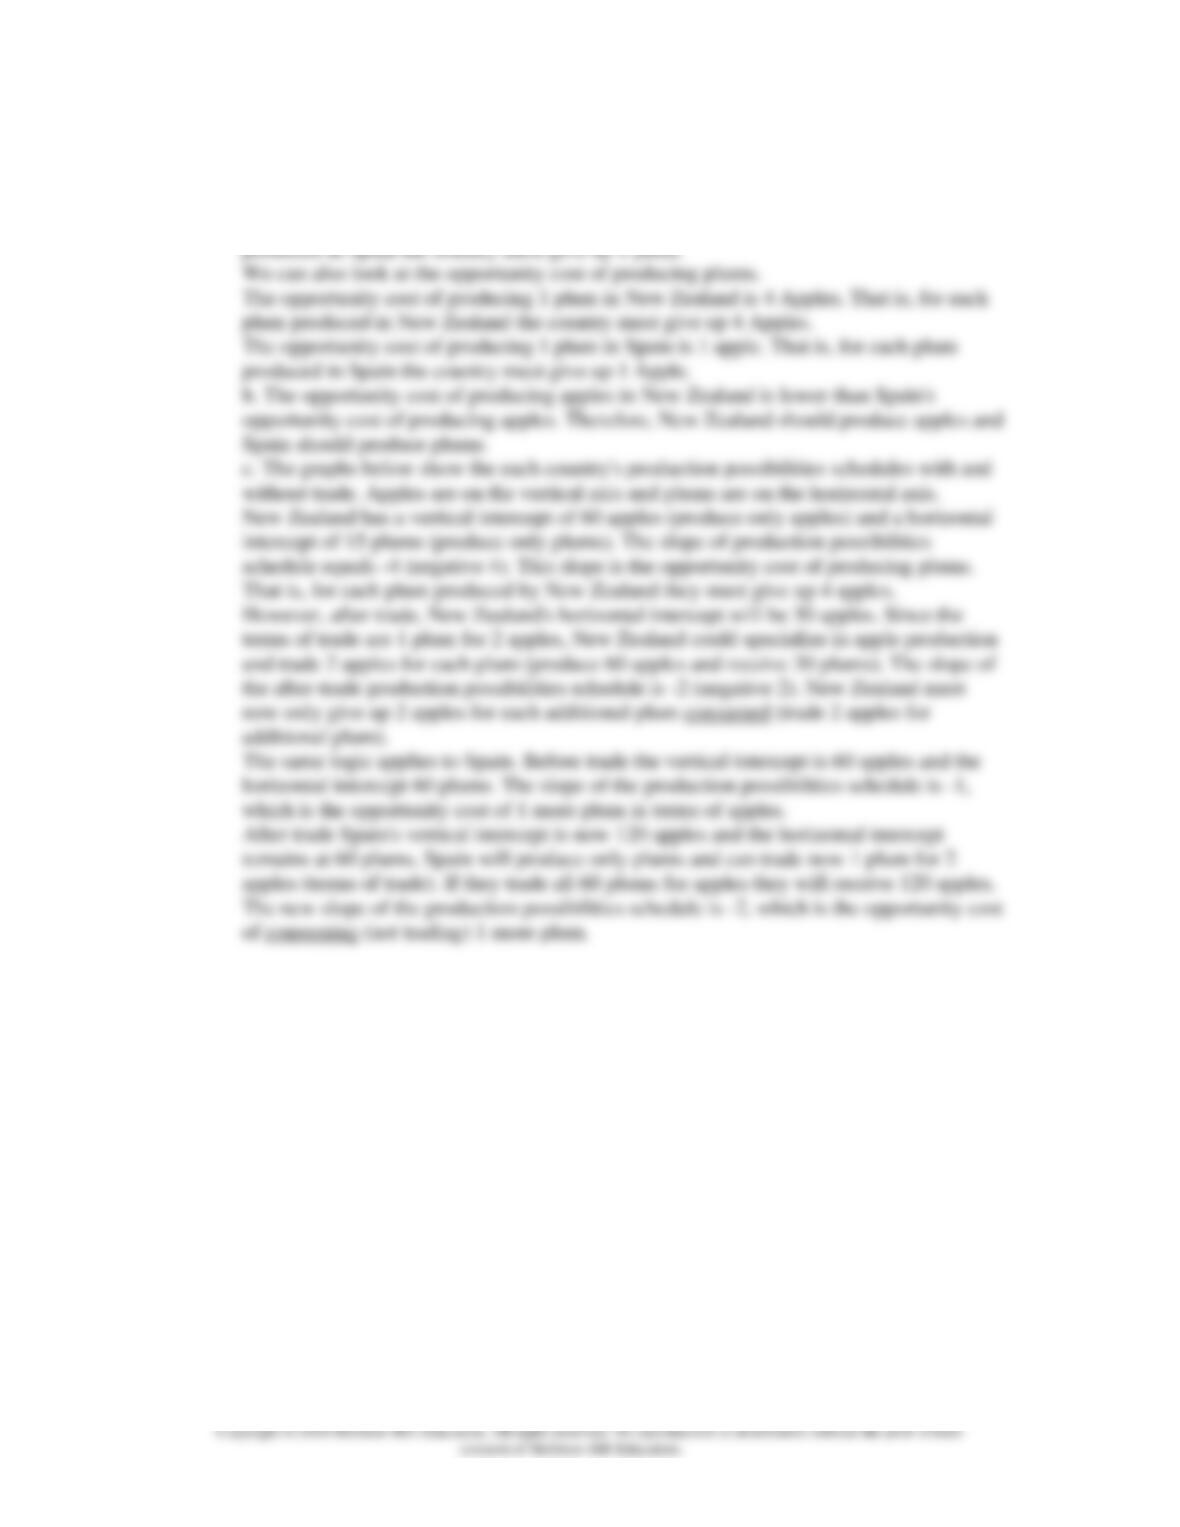
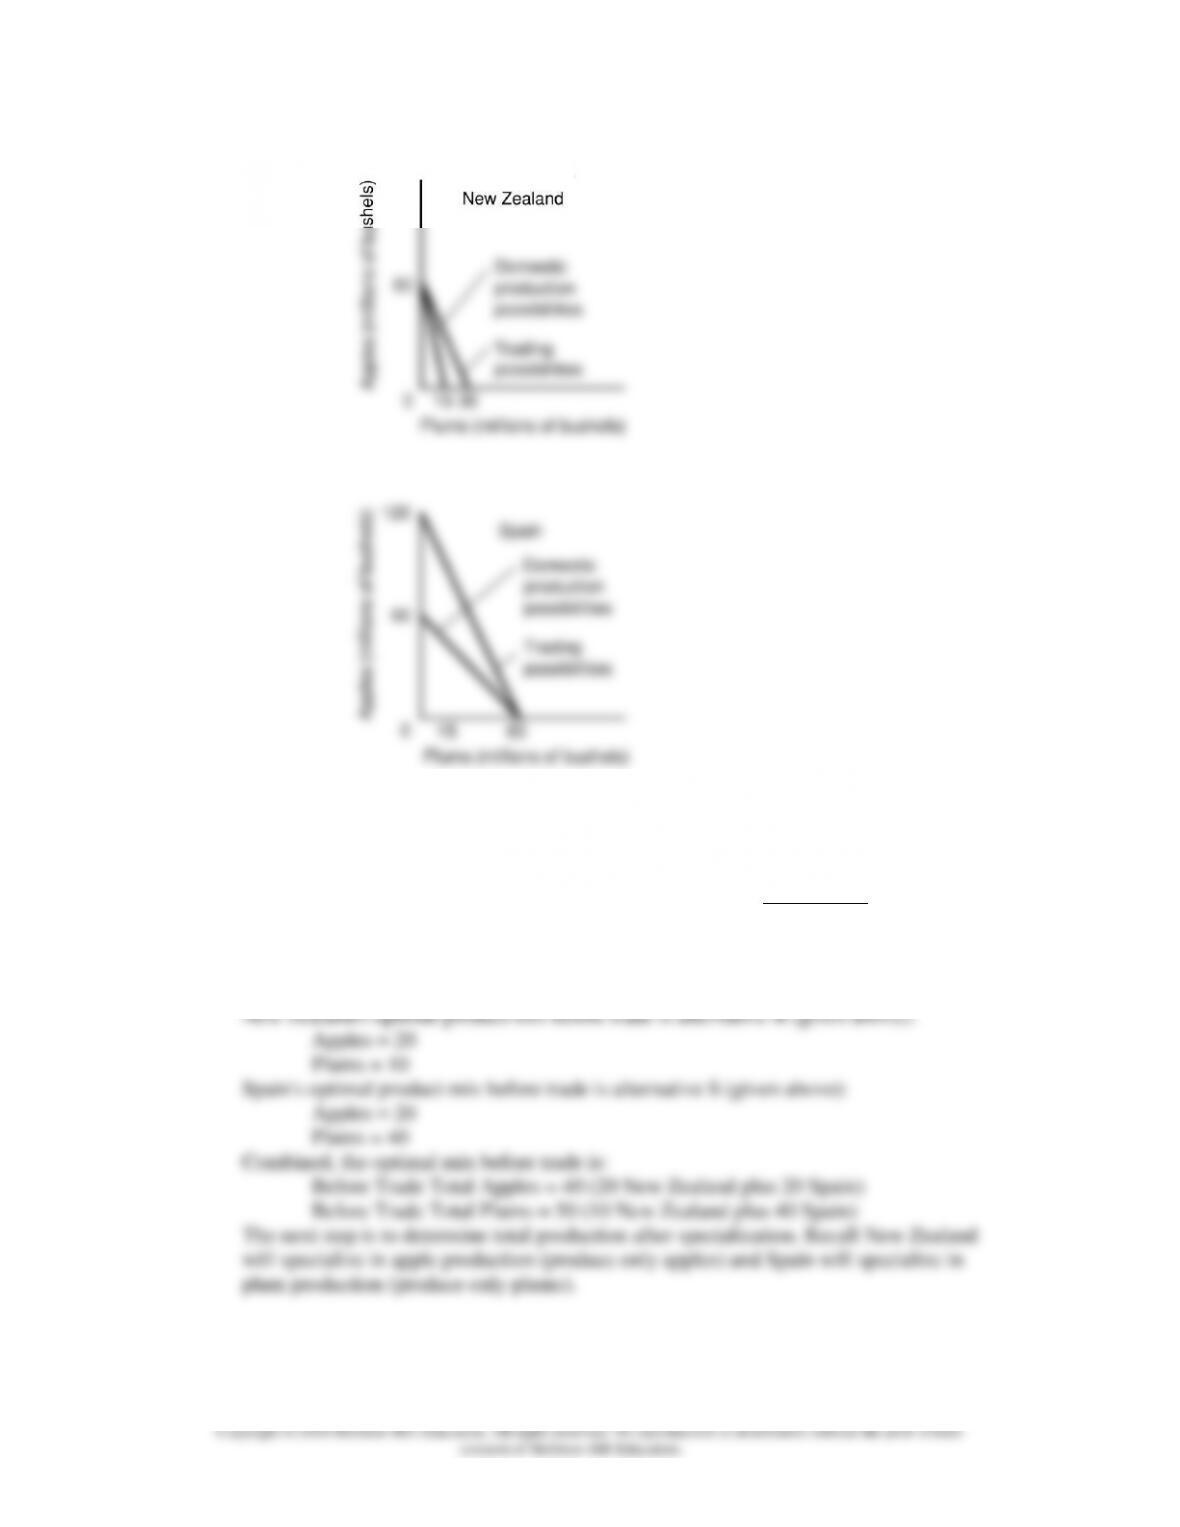
c. Show the trading possibilities lines for each nation if the actual terms of trade are 1 plum for 2
apples. (Plot these lines on your graph.)
d. Suppose the optimum product mixes before specialization and trade were alternative B in New
Zealand and alternative S in Spain. What would be the gains from specialization and trade?
Chapter 40 – International Trade
40–16
Feedback: a. The opportunity cost of producing 1 apple in New Zealand is 0.25 plums.
That is, for each apple produced in New Zealand the country must give up 0.25 plums.
The opportunity cost of producing 1 apple in Spain is 1 plum. That is, for each apple
Chapter 40 – International Trade
40–17
(NOTE: The intercepts above reflect possibilities not actual equilibrium consumption
bundles. For example, if Spain produced only plums and traded these for apples, they
should be able to consume 120 apples (vertical intercept after trade). The problem is that
New Zealand is only producing 60 apples (the most it possibly can). This is not a flaw in
the logic of the problem because we are only considering the construction of the
production possibilities schedules. The next step would be to allow terms of trade to
adjust in response to shortages and surpluses of goods based on country preferences. We
do not do this step here.)
d. The first step is to determine total production before any trade takes place.
Chapter 40 – International Trade
40–18
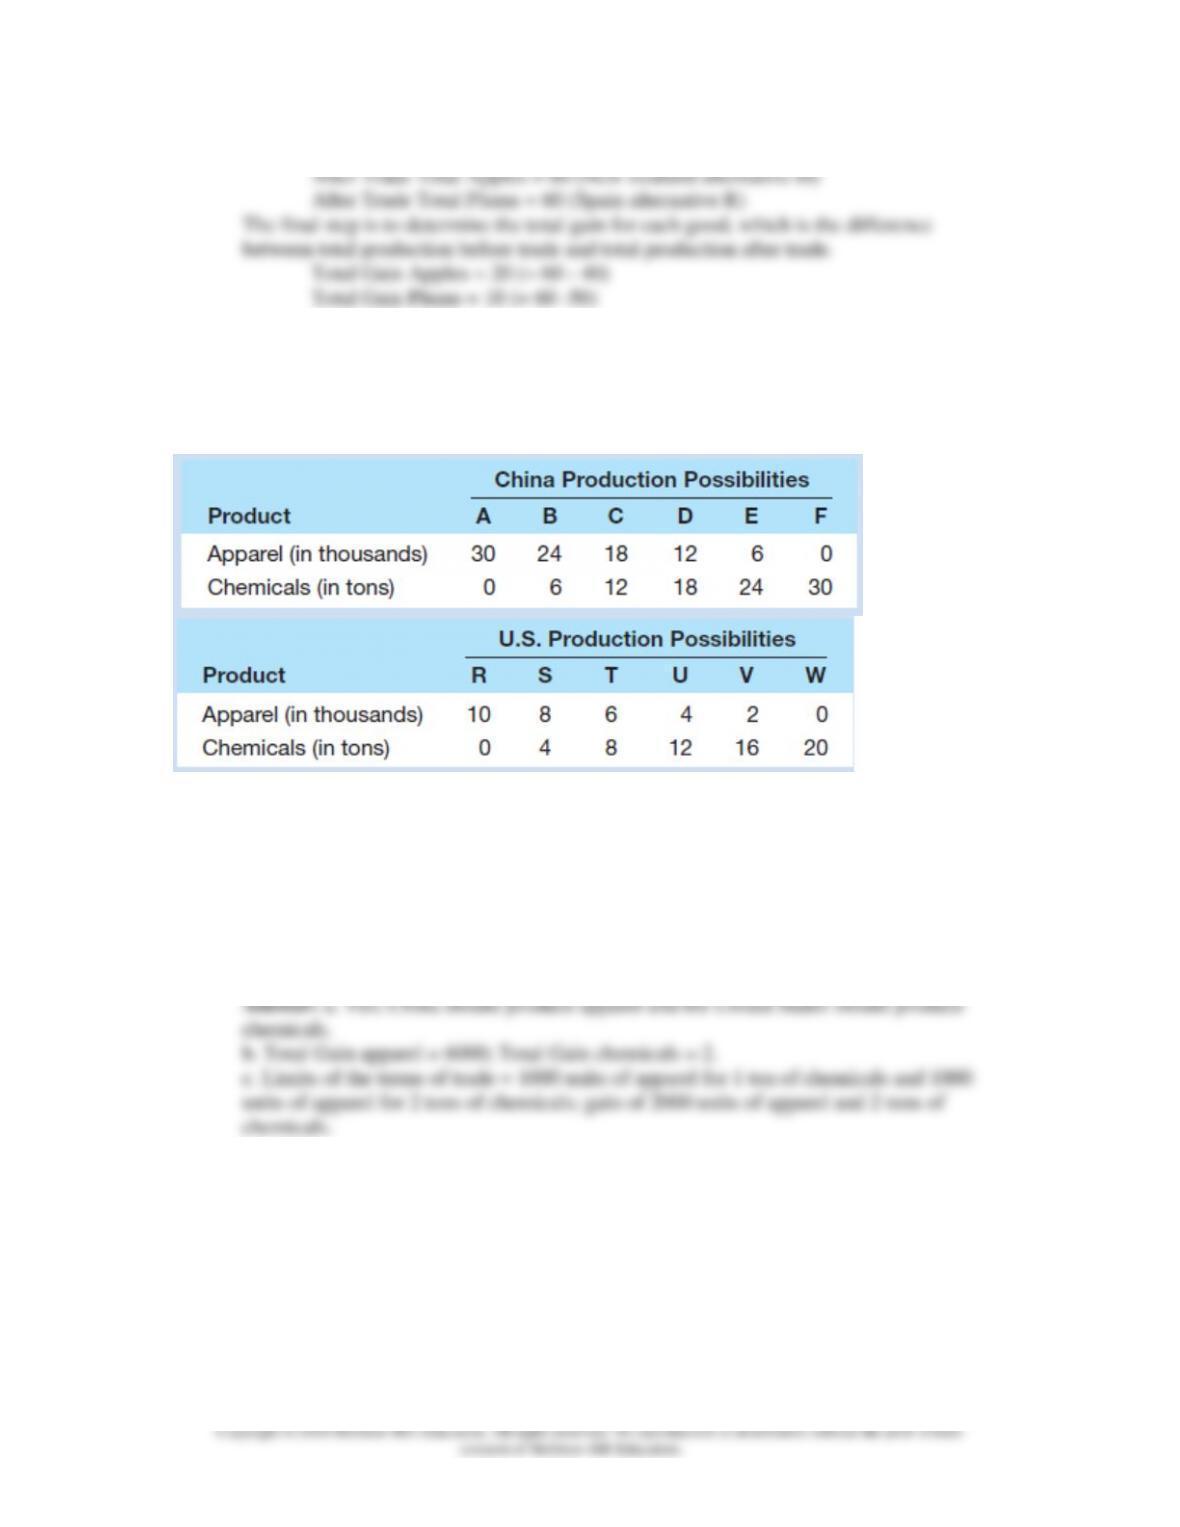
3. The following hypothetical production possibilities tables are for China and the United States.
Assume that before specialization and trade the optimal product mix for China is alternative B
and for the United States is alternative U. LO2
a. Are comparative-cost conditions such that the two areas should specialize? If so, what product
should each produce?
b. What is the total gain in apparel and chemical output that would result from such
specialization?
c. What are the limits of the terms of trade? Suppose that the actual terms of trade are 1 unit of
apparel for 1½ units of chemicals and that 4 units of apparel are exchanged for 6 units of
chemicals. What are the gains from specialization and trade for each nation?
Chapter 40 – International Trade
40–19
Feedback:
b. The first step is to determine total production before any trade takes place.
China’s optimal product mix before trade is alternative B (given above):
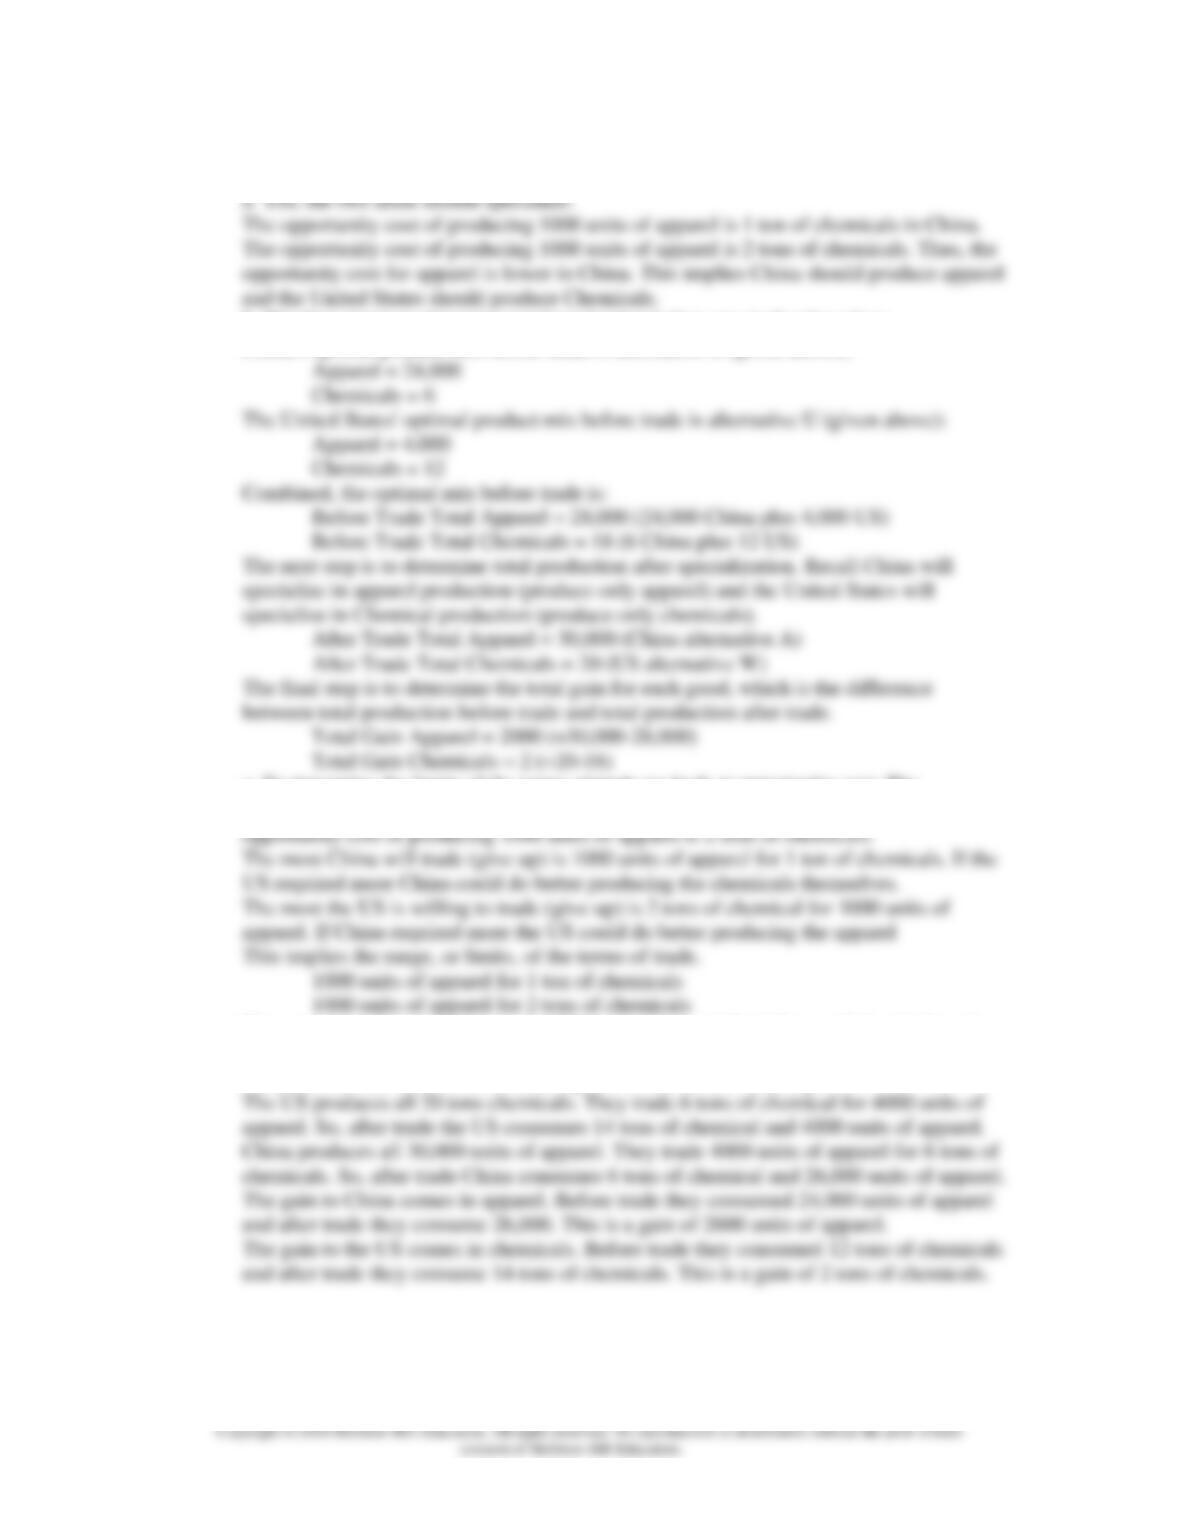
c. To determine the limits of the terms of trade we look at opportunity cost. The
opportunity cost of producing 1000 units of apparel is 1 ton of chemicals in China. The
Now assuming the actual terms are 1000 units of apparel for 1.5 tons of chemicals and
that the ACTUAL amount traded (exchange) is 4000 units of apparel for 6 tons of
chemicals we can find the new consumption levels for each country.
40–20
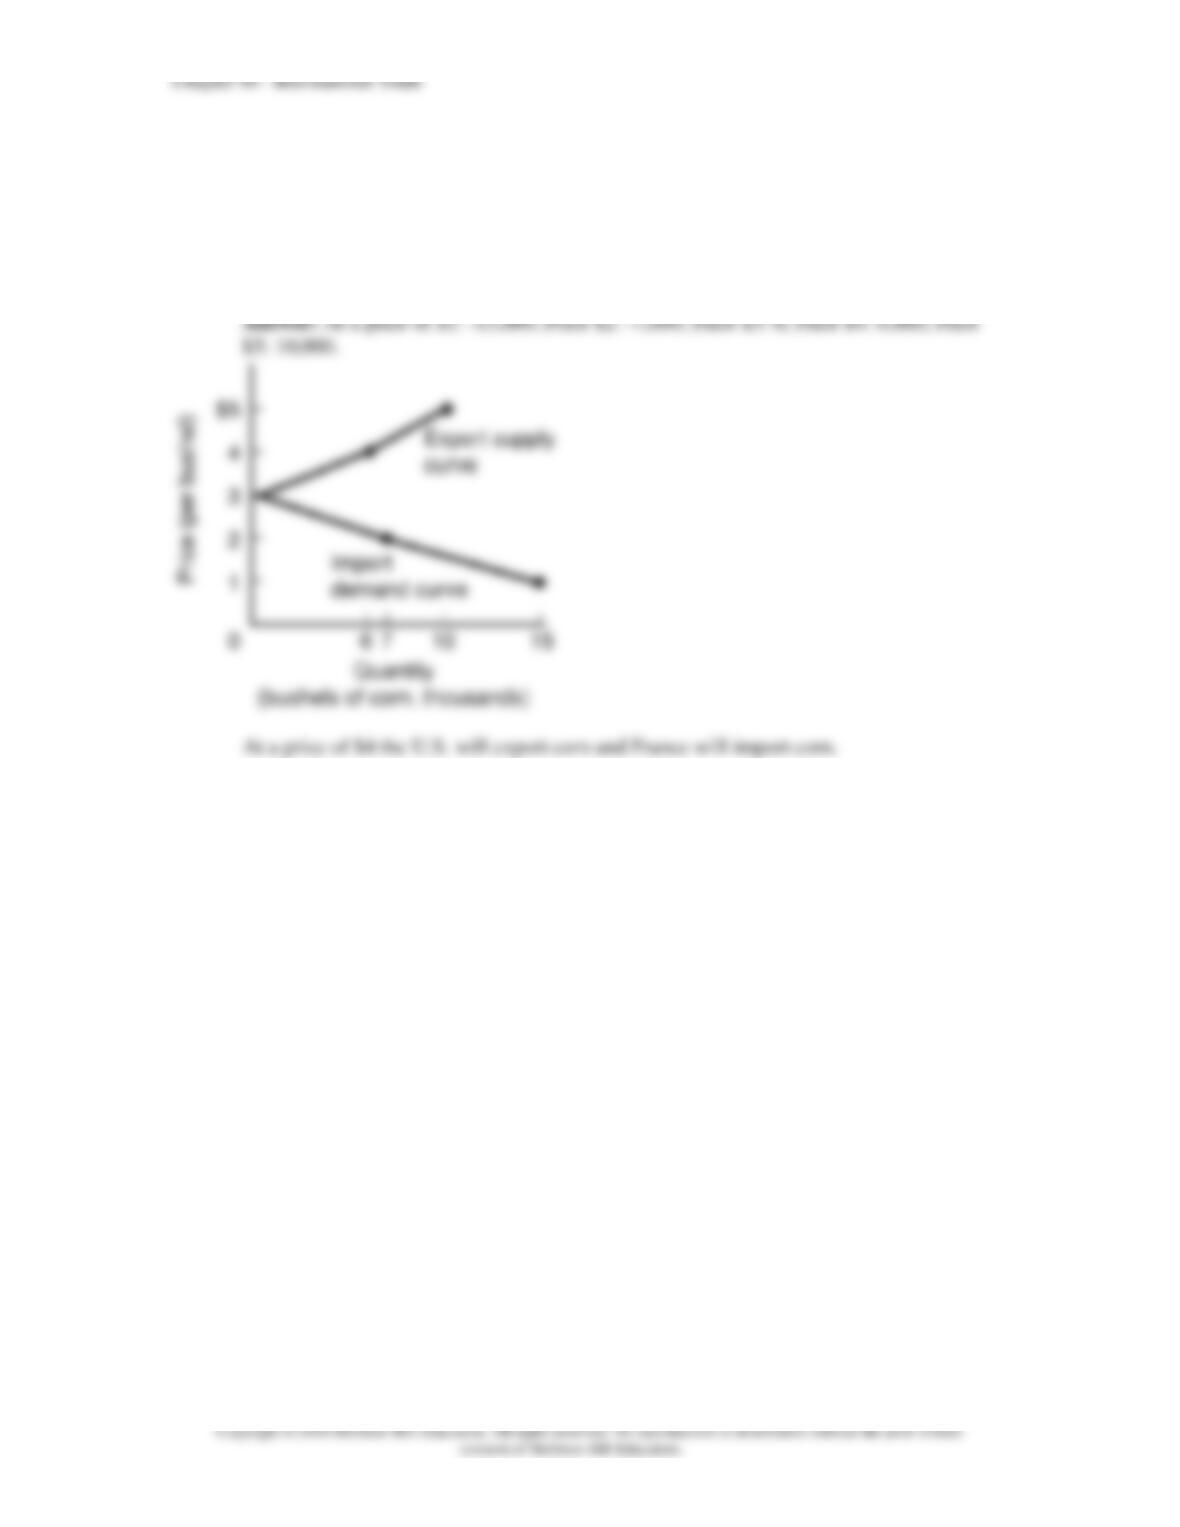
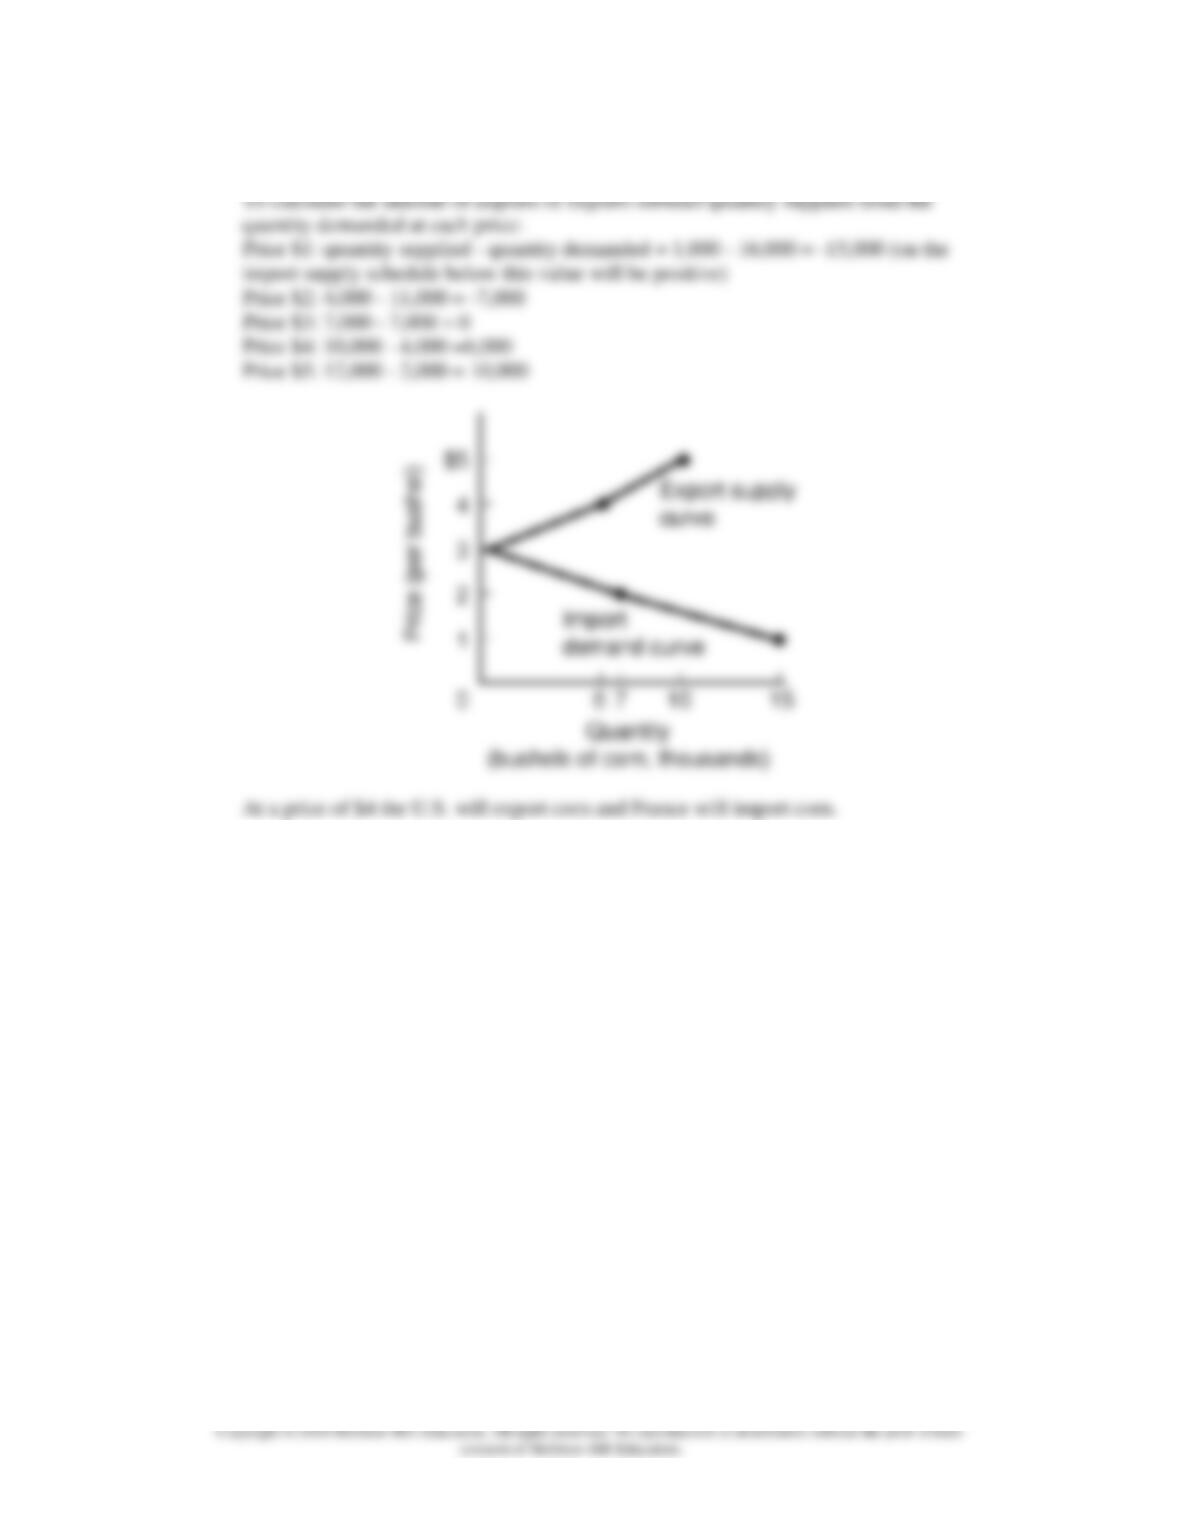
4. Refer to Figure 3.6, page 63. Assume that the graph depicts the U.S. domestic market for corn.
How many bushels of corn, if any, will the United States export or import at a world price of $1,
$2, $3, $4, and $5? Use this information to construct the U.S. export supply curve and import
demand curve for corn. Suppose that the only other corn-producing nation is France, where the
domestic price is $4. Which country will export corn; which county will import it? LO3
Chapter 40 – International Trade
40–21
Feedback: