Chapter 33 – Fiscal Policy, Deficits, and Debt
33-1
Chapter 33 – Fiscal Policy, Deficits, and Debt
McConnell, Brue, and Flynn 21e
DISCUSSION QUESTIONS
1. What is the role of the Council of Economic Advisers (CEA) as it relates to fiscal policy? Use
an Internet search to find the names and university affiliations of the present members of the
CEA. LO1
2. What are government’s fiscal policy options for ending severe demand-pull inflation? Which
of these fiscal options do you think might be favored by a person who wants to preserve the size
of government? A person who thinks the public sector is too large? How does the “ratchet effect”
affect anti-inflationary fiscal policy? LO1
Chapter 33 – Fiscal Policy, Deficits, and Debt
33-2
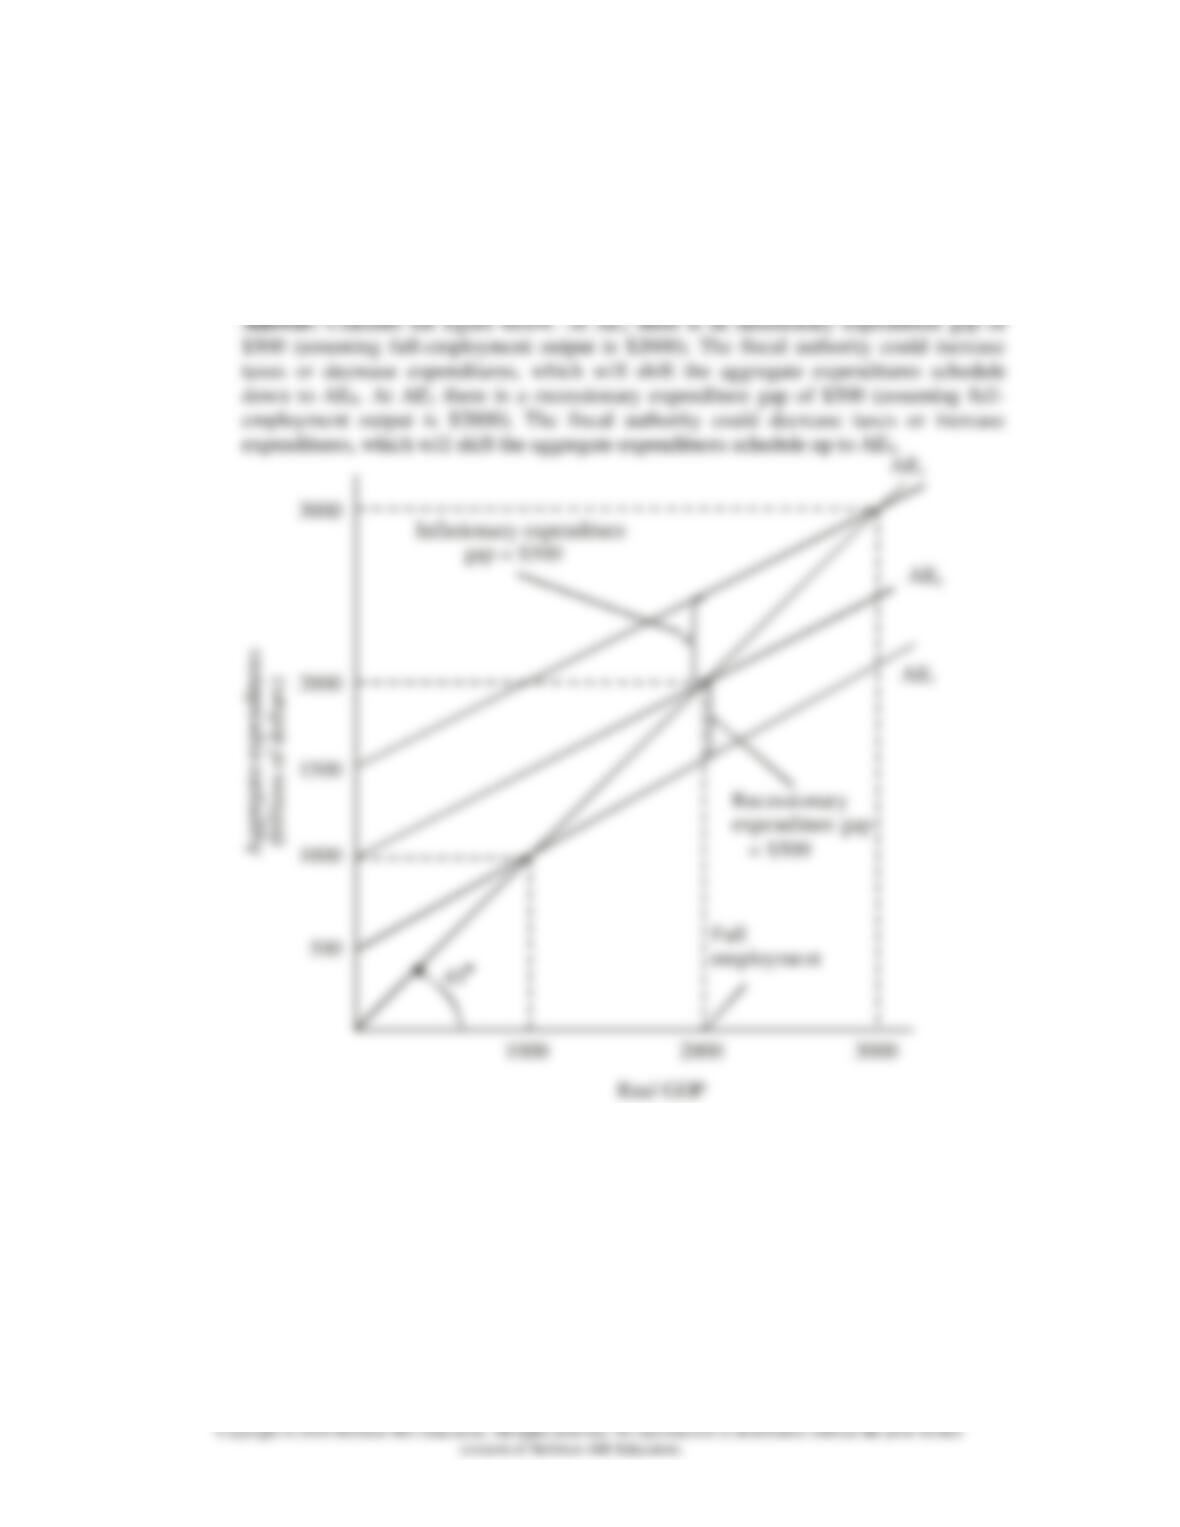
3. (For students who were assigned Chapter 29) Use the aggregate expenditures model to show
how government fiscal policy could eliminate either a recessionary expenditure gap or an
inflationary expenditure gap (Figure 29.7). Explain how equal-size increases in G and T could
eliminate a recessionary gap and how equal-size decreases in G and T could eliminate an
inflationary gap. LO1
Chapter 33 – Fiscal Policy, Deficits, and Debt
33-3
Equal-size increases (decreases) in G and T could eliminate a recessionary (inflationary)
expenditure gap because the multiplier effects of a change in government spending are
4. Some politicians have suggested that the United States enact a constitutional amendment
requiring that the Federal government balance its budget annually. Explain why such an
amendment, if strictly enforced, would force the government to enact a contractionary fiscal
policy whenever the economy experienced a severe recession. LO1
5. Explain how built-in (or automatic) stabilizers work. What are the differences between
proportional, progressive, and regressive tax systems as they relate to an economy’s built-in
stability? LO2
Answer: In a phrase, “net tax revenues vary directly with GDP.” When GDP is rising so
are tax collections, both income taxes and sales taxes. At the same time, government
Chapter 33 – Fiscal Policy, Deficits, and Debt
33-4
6. Define the cyclically-adjusted budget, explain its significance, and state why it may differ from
the actual budget. Suppose the full-employment, noninflationary level of real output is GDP3 (not
GDP2) in the economy depicted in Figure 33.3. If the economy is operating at GDP2, instead of
GDP3, what is the status of its cyclically-adjusted budget? The status of its current fiscal policy?
What change in fiscal policy would you recommend? How would you accomplish that in terms of
the G and T lines in the figure? LO3
Answer: The cyclically-adjusted budget measures what the Federal deficit or surplus
7. Briefly state and evaluate the problem of time lags in enacting and applying fiscal policy.
Explain the idea of a political business cycle. How might expectations of a near-term policy
reversal weaken fiscal policy based on changes in tax rates? What is the crowding-out effect, and
why might it be relevant to fiscal policy? In view of your answers, explain the following
statement: “Although fiscal policy clearly is useful in combating the extremes of severe recession
and demand-pull inflation, it is impossible to use fiscal policy to fine-tune the economy to the
full-employment, noninflationary level of real GDP and keep the economy there indefinitely.”
LO5
Answer: It takes time to ascertain the direction in which the economy is moving
(recognition lag), to get a fiscal policy enacted into law (administrative lag); and for the
policy to have its full effect on the economy (operational lag). Meanwhile, other factors
may change, rendering inappropriate a particular fiscal policy. Nevertheless,
discretionary fiscal policy is a valuable tool in preventing severe recession or severe
demand-pull inflation.
A political business cycle is the concept that politicians are more interested in reelection
Chapter 33 – Fiscal Policy, Deficits, and Debt
33-5
As suggested, the other answers help explain the quote. While fiscal policy is useful in
combating the extremes of severe recession with its built-in “safety nets” and
8. How do economists distinguish between the absolute and relative sizes of the public debt? Why
is the distinction important? Distinguish between refinancing the debt and retiring the debt. How
does an internally held public debt differ from an externally held public debt? Contrast the effects
of retiring an internally held debt and retiring an externally held debt. LO6
Answer: There are two ways of measuring the public debt: (1) measure its absolute
dollar size; (2) measure its relative size as a percentage of GDP. The distinction is
important because the absolute size doesn’t tell you about an economy’s capacity to
Chapter 33 – Fiscal Policy, Deficits, and Debt
33-6
9. True or false? If false, explain why. LO6
a. The total public debt is more relevant to an economy than the public debt as a percentage of
GDP.
b. An internally held public debt is like a debt of the left hand owed to the right hand.
c. The Federal Reserve and Federal government agencies hold more than three-fourths of the
public debt.
d. The portion of the U.S. debt held by the public (and not by government entities) was larger as a
percentage of GDP in 2009 than it was in 2000.
e. As a percentage of GDP, the total U.S. public debt is the highest such debt among the world’s
advanced industrial nations.
Answer: a. False. There are two ways of measuring the public debt: (1) measure its
absolute dollar size and (2) measure its relative size as a percentage of GDP. The
10. Why might economists be quite concerned if the annual interest payments on the U.S. public
debt sharply increased as a percentage of GDP? LO6
Answer: The weight of the debt is not its absolute size. Indeed, if there were no interest
11. Trace the cause-and-effect chain through which financing and refinancing of the public debt
might affect real interest rates, private investment, the stock of capital, and economic growth.
How might investment in public capital and complementarities between public capital and private
capital alter the outcome of the cause-effect chain? LO6
Chapter 33 – Fiscal Policy, Deficits, and Debt
33-7
Copyright © 2018 McGraw-Hill Education. All rights reserved. No reproduction or distribution without the prior written
consent of McGraw-Hill Education.
Answer: Cause and effect chain: Government borrowing to finance the debt competes
with private borrowing and drives up the interest rate; the higher interest rate causes a
decline in private capital and economic growth slows.
However, if public investment complements private investment, private borrowers may
be willing to pay higher rates for positive growth opportunities. Productivity and
economic growth could rise.
12. LAST WORD What do economists mean when they say Social Security and Medicare are
“pay-as–you-go” plans? What are the Social Security and Medicare trust funds, and how long will
they have money left in them? What is the key long-run problem of both Social Security and
Medicare? Do you favor increasing taxes or do you prefer reducing benefits to fix the problem?
Answer: Social Security and Medicare are largely an annual “pay–as–you–go” plan,
meaning that most of the current revenues from the Social Security tax are paid to current
REVIEW QUESTIONS
1. Which of the following would help a government reduce an inflationary output gap? LO1
a. Raising taxes.
b. Lowering taxes.
c. Increasing government spending.
d. Decreasing government spending.
Chapter 33 – Fiscal Policy, Deficits, and Debt
33-8
2. The economy is in a recession. A congresswoman suggests increasing spending to stimulate
aggregate demand but also at the same time raising taxes to pay for the increased spending. Her
suggestion to combine higher government expenditures with higher taxes is: LO1
a. The worst possible combination of tax and expenditure changes.
b. The best possible combination of tax and expenditure changes.
c. A mediocre and contradictory combination of tax and expenditure changes.
d. None of the above.
3. During the recession of 2007–2009, the U.S. federal government’s tax collections fell from
about $2.6 trillion down to about $2.1 trillion while GDP declined by about 4 percent. Does the
U.S. tax system appear to have built-in stabilizers? LO2
a. Yes.
b. No.
Chapter 33 – Fiscal Policy, Deficits, and Debt
33-9
4. Last year, while an economy was in a recession, government spending was $595 billion and
government revenue was $505 billion. Economists estimate that if the economy had been at its
full-employment level of GDP last year, government spending would have been $555 billion and
government revenue would have been $550 billion. Which of the following statements about this
government’s fiscal situation are true? LO3
a. The government has a non–cyclically adjusted budget deficit of $595 billion.
b. The government has a non–cyclically adjusted budget deficit of $90 billion.
c. The government has a non–cyclically adjusted budget surplus of $90 billion.
d. The government has a cyclically adjusted budget deficit of $555 billion.
e. The government has a cyclically adjusted budget deficit of $5 billion.
f. The government has a cyclically adjusted budget surplus of $5 billion.
5. Label each of the following scenarios in which there are problems enacting and applying fiscal
policy as being an example of either recognition lag, administrative lag, or operational lag. LO5
a. To fight a recession, Congress has passed a bill to increase infrastructure spending—but the
legally required environmental-impact statement for each new project will take at least two years
to complete before any building can begin.
b. Distracted by a war that is going badly, inflation reaches 8 percent before politicians take
notice.
c. A sudden recession is recognized by politicians, but it takes many months of political deal
making before a stimulus bill is finally approved.
d. To fight a recession, the president orders federal agencies to get rid of petty regulations that
burden private businesses—but the federal agencies begin by spending a year developing a set of
regulations on how to remove petty regulations.
Chapter 33 – Fiscal Policy, Deficits, and Debt
33-10
6. In January, the interest rate is 5 percent and firms borrow $50 billion per month for investment
projects. In February, the federal government doubles its monthly borrowing from $25 billion to
$50 billion. That drives the interest rate up to 7 percent. As a result, firms cut back their
borrowing to only $30 billion per month. Which of the following is true? LO6
a. There is no crowding–out effect because the government’s increase in borrowing exceeds
firm’s decrease in borrowing.
b. There is a crowding-out effect of $20 billion.
c. There is no crowding-out effect because both the government and firms are still borrowing a
lot.
d. There is a crowding-out effect of $25 billion.
PROBLEMS
1. Assume that a hypothetical economy with an MPC of .8 is experiencing severe recession. By
how much would government spending have to rise to shift the aggregate demand curve
rightward by $25 billion? How large a tax cut would be needed to achieve the same increase in
aggregate demand? Determine one possible combination of government spending increases and
tax increases that would accomplish the same goal without changing the amount of outstanding
debt. LO1
Chapter 33 – Fiscal Policy, Deficits, and Debt
33-11
Feedback: Part 1: The first step is to find the expenditure multiplier.
Part 2: The first step is to calculate the tax multiplier. Here we need to recognize that a
tax cut will need to move through consumption before impacting the economy. Therefore
Part 3: To answer this question we want to use the balanced budget multiplier concept.
First, we increase government spending by $25 billion. This results in an increase in
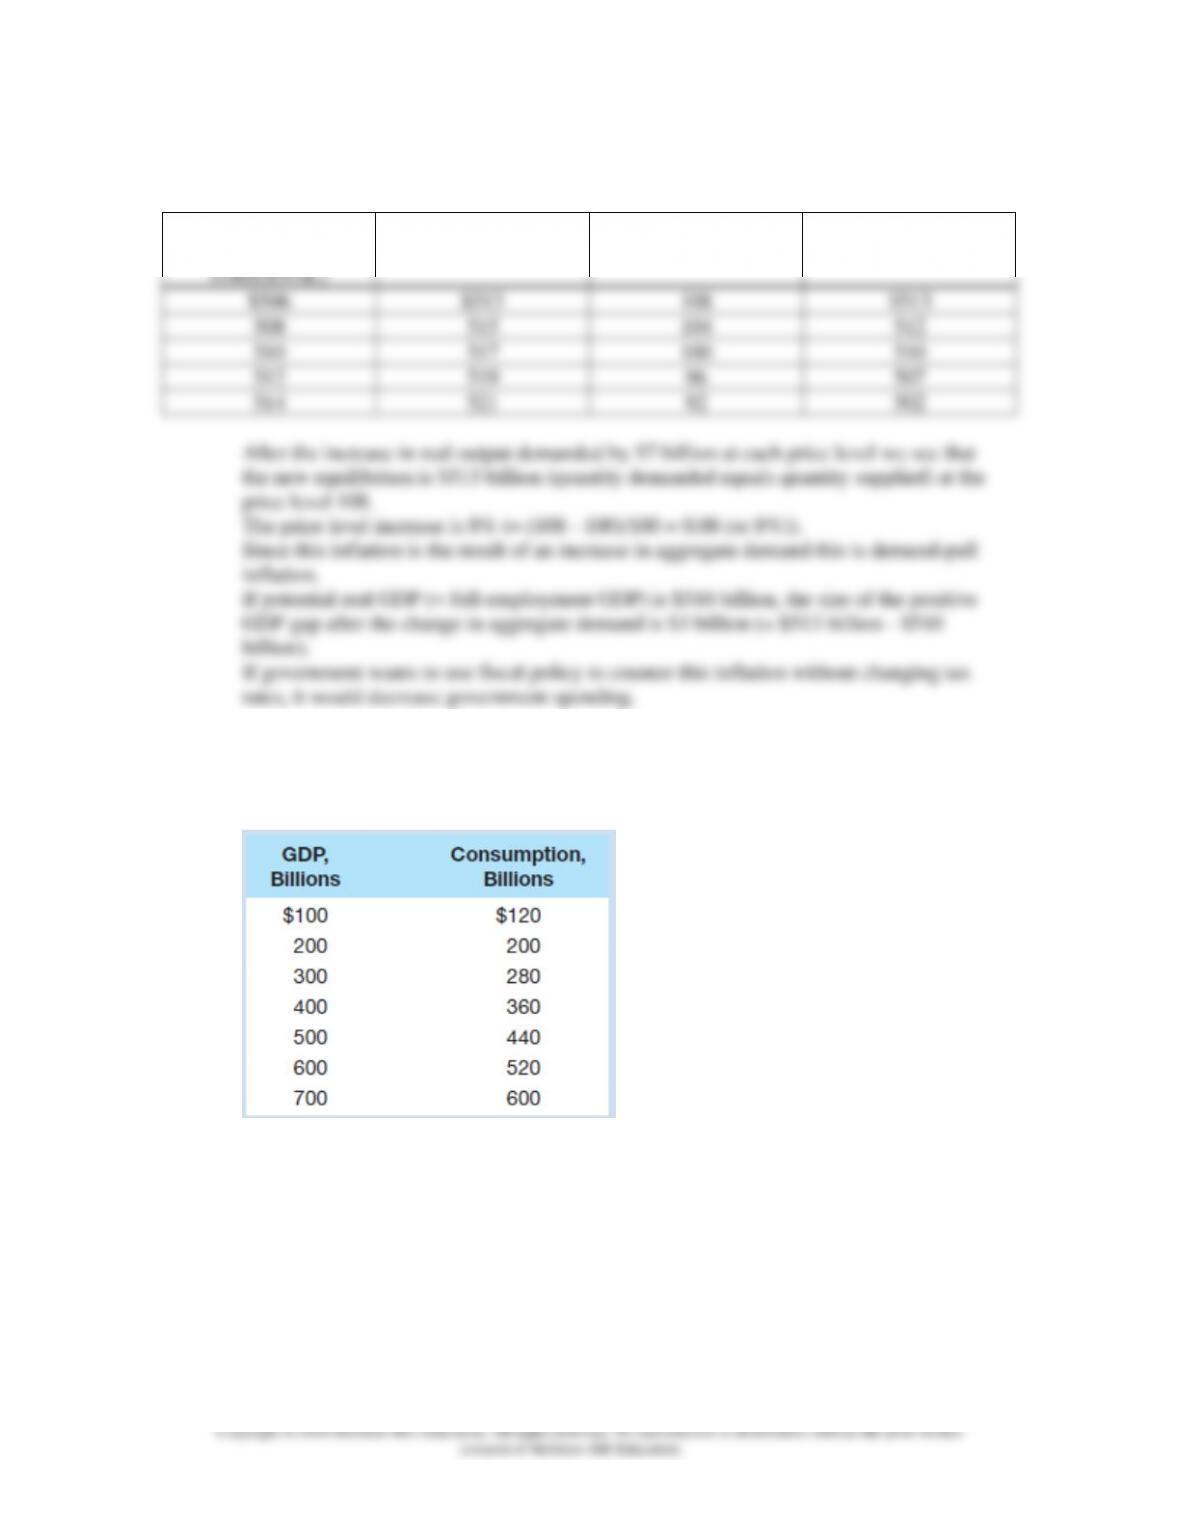
2. Refer back to the table in Figure 30.7 in the previous chapter. Suppose that aggregate demand
increases such that the amount of real output demanded rises by $7 billion at each price level. By
what percent will the price level increase? Will this inflation be demand-pull inflation or will it be
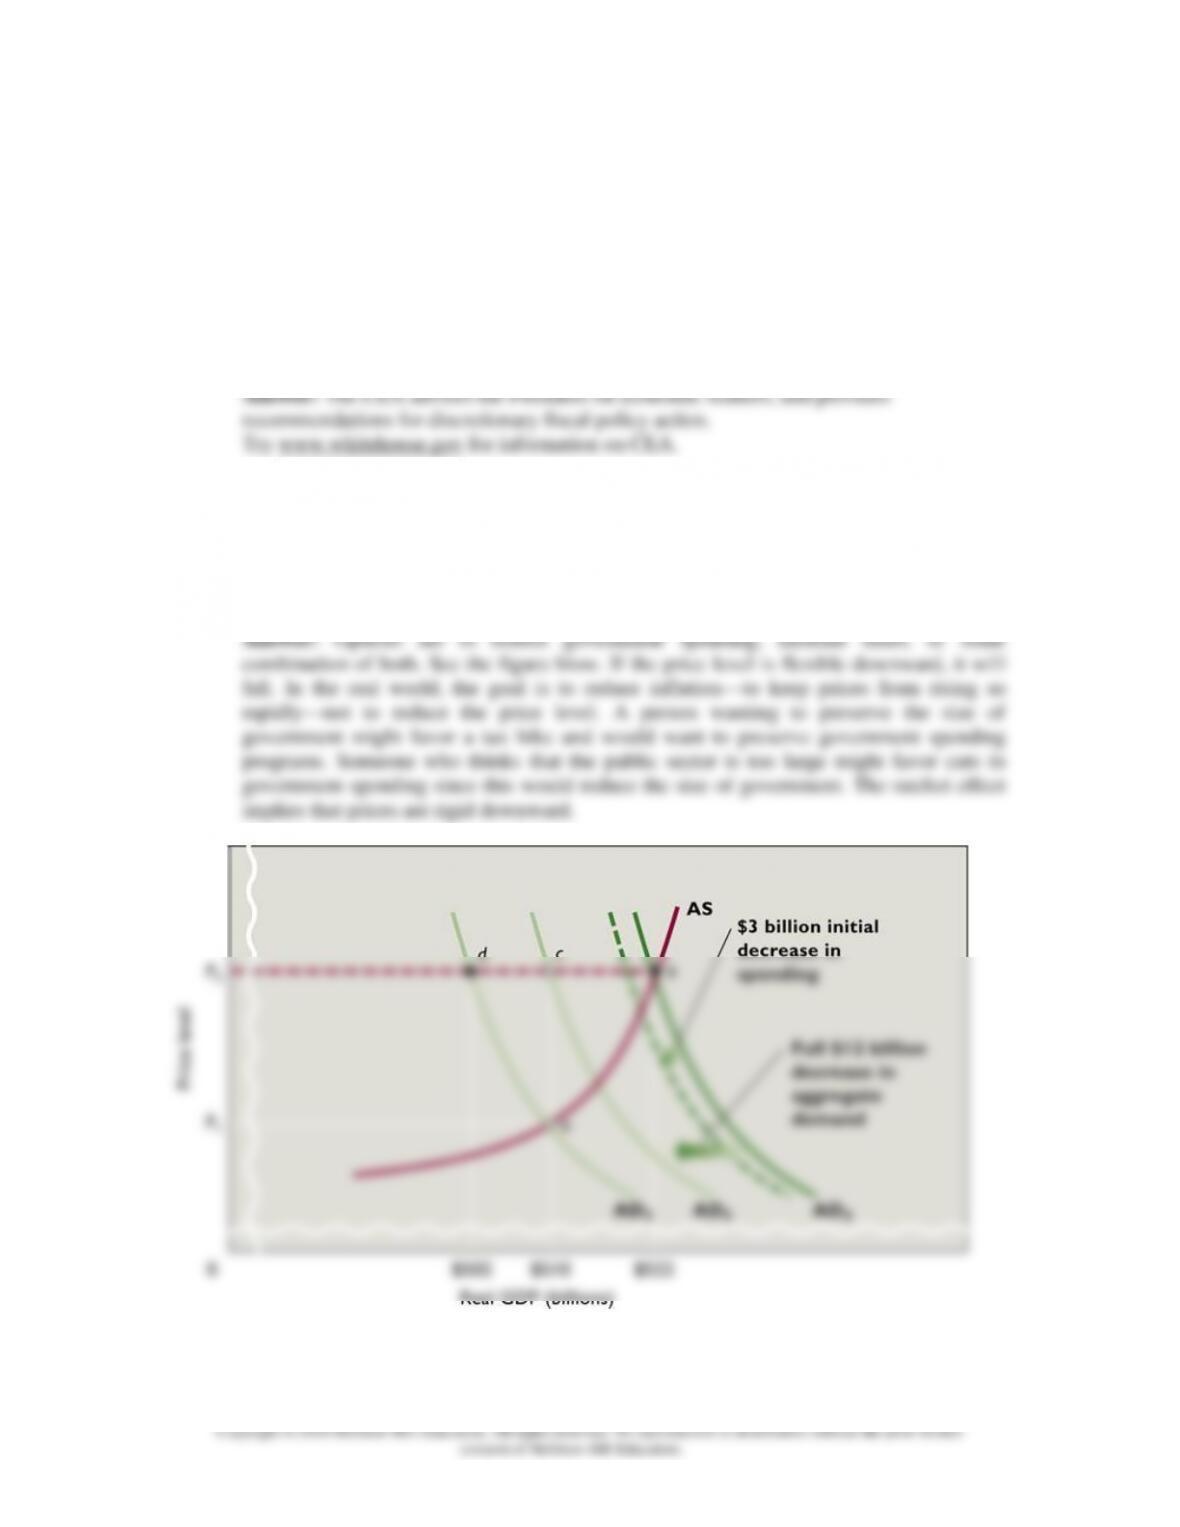
cost-push inflation? If potential real GDP (that is, full-employment GDP) is $510 billion, what
will be the size of the positive GDP gap after the change in aggregate demand? If government
wants to use fiscal policy to counter the resulting inflation without changing tax rates, would it
increase government spending or decrease it? LO1
Chapter 33 – Fiscal Policy, Deficits, and Debt
33-12
Feedback:
Real Output
Demanded
(ORIGINAL)
Real Output
Demanded (NEW)
Price Level
Real Output Supplied
$506
$513
108
$513
508
515
104
512
510
517
100
510
512
519
96
507
514
521
92
502
After the increase in real output demanded by $7 billion at each price level we see that
the new equilibrium is $513 billion (quantity demanded equals quantity supplied) at the
price level 108.
The price level increase is 8% (= (108 – 100)/100 = 0.08 (or 8%)).
Since this inflation is the result of an increase in aggregate demand this is demand-pull
inflation.
If potential real GDP (= full-employment GDP) is $510 billion, the size of the positive
GDP gap after the change in aggregate demand is $3 billion (= $513 billion – $510
billion).
If government wants to use fiscal policy to counter this inflation without changing tax
rates, it would decrease government spending.
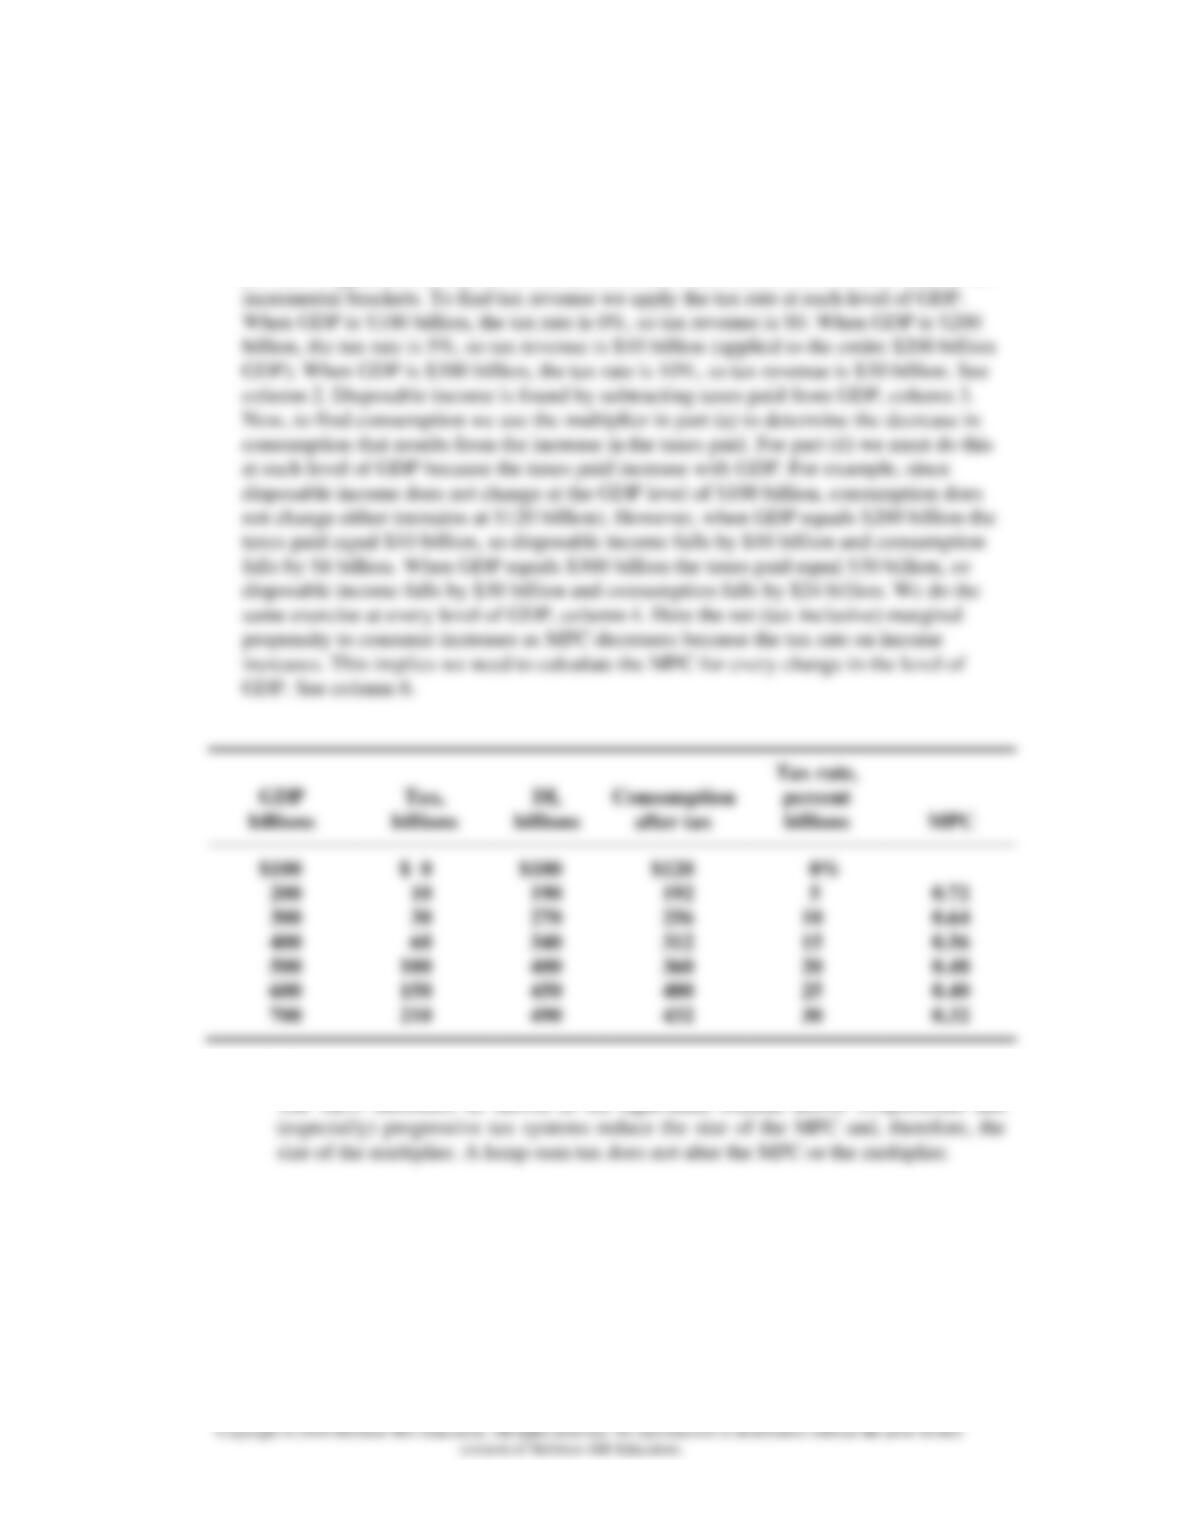
3. (For students who were assigned Chapter 29) Assume that, without taxes, the consumption
schedule for an economy is as shown below: LO1
Chapter 33 – Fiscal Policy, Deficits, and Debt
33-13
a. Graph this consumption schedule. What is the size of the MPC?
b. Assume that a lump-sum (regressive) tax of $10 billion is imposed at all levels of GDP.
Calculate the tax rate at each level of GDP. Graph the resulting consumption schedule and
compare the MPC and the multiplier with those of the pretax consumption schedule.
c. Now suppose a proportional tax with a 10 percent tax rate is imposed instead of the regressive
tax. Calculate and graph the new consumption schedule and note the MPC (tax inclusive) and the
multiplier.
d. Finally, impose a progressive tax such that the tax rate is 0 percent when GDP is $100, 5
percent at $200, 10 percent at $300, 15 percent at $400, and so forth. Determine and graph the
new consumption schedule, noting the effect of this tax system on the MPC (tax inclusive) and
the multiplier.
e. Use a graph similar to Figure 30.3 to show why proportional and progressive taxes contribute
to greater economic stability, while a regressive tax does not.
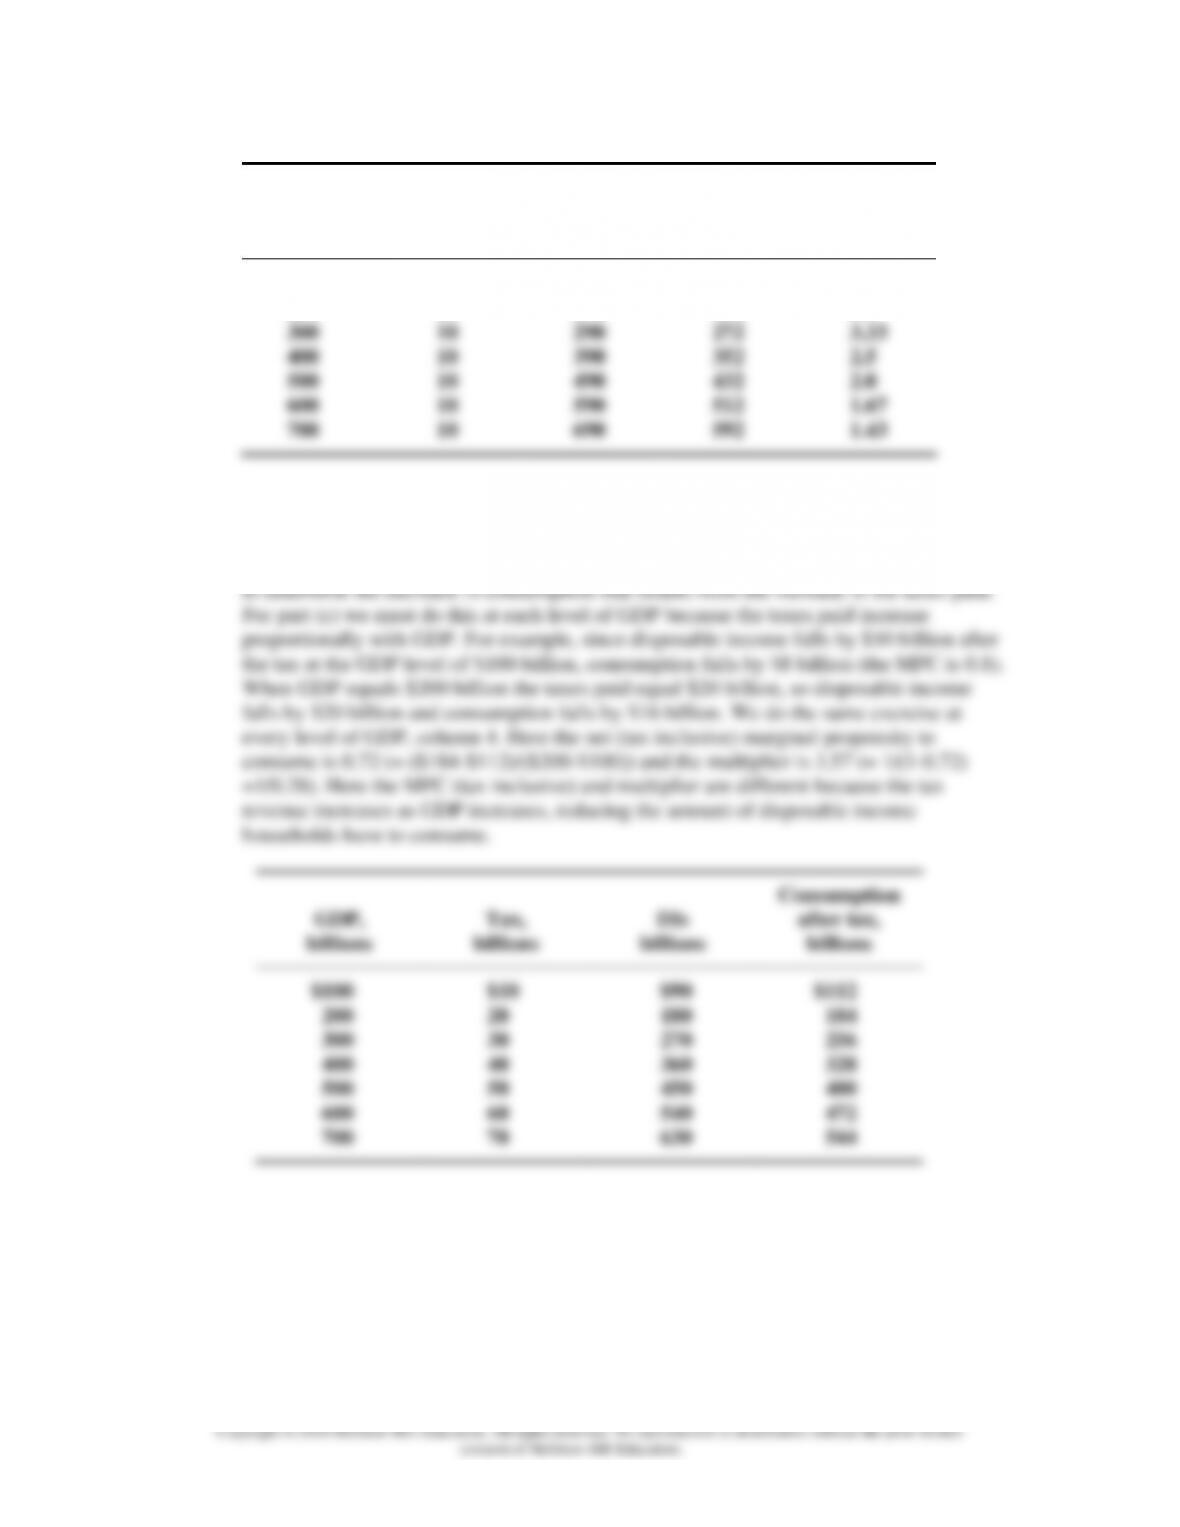
Chapter 33 – Fiscal Policy, Deficits, and Debt
GDP,
billions
Tax,
billions
DI,
billions
Consumption
after tax
Tax rate,
percent
billions
$100
200
300
400
500
600
700
$10
10
10
10
10
10
10
$ 90
190
290
390
490
590
690
$112
192
272
352
432
512
592
10%
5.0
3.33
2.5
2.0
1.67
1.43
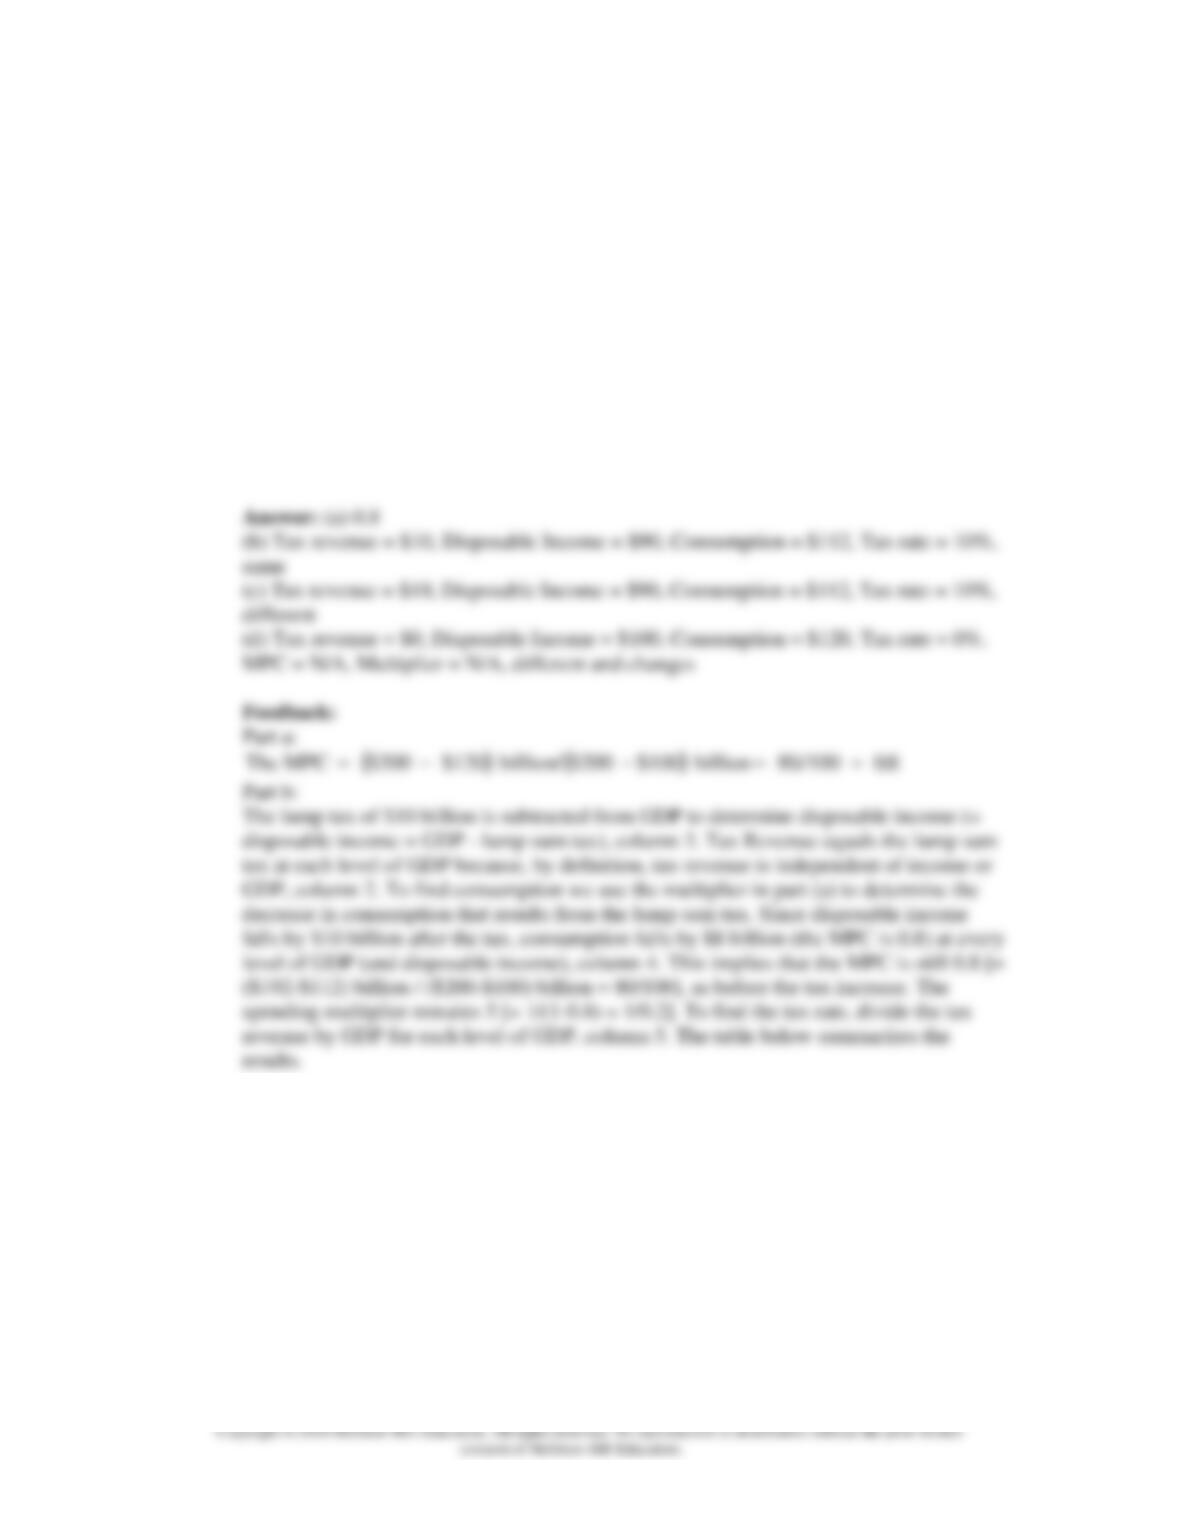
Part c:
With the 10% tax rate we find the tax revenue by taking 10% of GDP, column 2. We then
find disposable income by subtracting the tax revenue from GDP (disposable income =
GDP – tax revenue), column 3. Now, to find consumption we use the multiplier in part (a)
Chapter 33 – Fiscal Policy, Deficits, and Debt
Part d:
For this part of the problem we impose a progressive tax such that the tax rate is 0 percent
when GDP is $100, 5 percent at $200, 10 percent at $300, 15 percent at $400, and so
forth, column 5. Note that this tax structure is not a standard progressive tax system. The
tax rate is applied to all income at the different GDP and income levels rather than to the
Chapter 33 – Fiscal Policy, Deficits, and Debt
33-16
NOTE: For instructors who assign the graphs, the following would be true. For each
graph (a) through (d), plot the consumption schedule against the GDP. Graph (a) will
have a slope of .8 and will cross the 45 degree line at C = GDP = 200. Graph (b) is
parallel to (a) but $10 billion below it and will cross the 45 degree line at C = GDP =
150, indicating the multiplier of 5 ($10 billion loss in income leads to $50 billion
drop in equilibrium GDP). Graph (c) will not be as steep as (a) or (b) with a slope of
.72 and equilibrium between GDP = 200 and GDP = 300 on the diagram. Graph (d)
has a decreasing slope so it will not be a straight line. Equilibrium is just beyond
GDP = 200. The multiplier is illustrated by noting the change in equilibrium GDP if
any curve were to be shifted by a given amount. The multiplier is the ratio of change
in equilibrium GDP to the vertical shift.
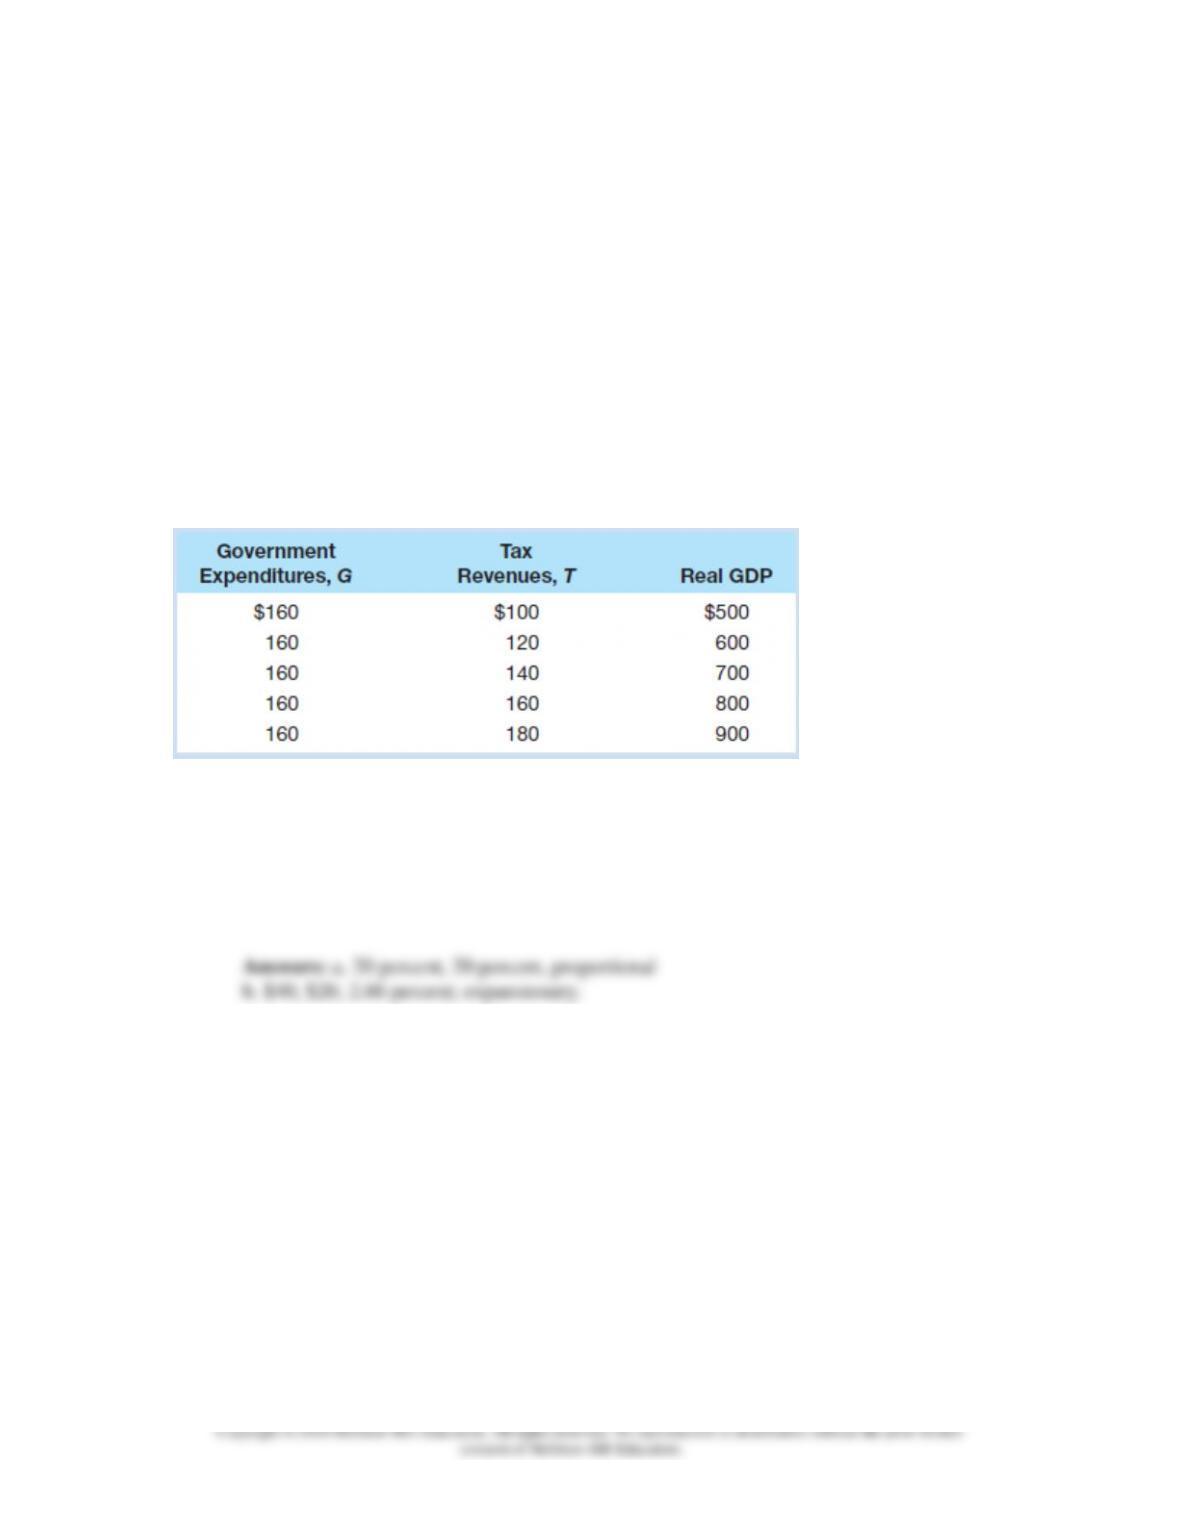
4. Refer to the accompanying table for Waxwania: LO2
a. What is the marginal tax rate in Waxwania? The average tax rate? Which of the following
describes the tax system: proportional, progressive, regressive?
b. Suppose Waxwania is producing $600 of real GDP, whereas the potential real GDP (or full–
employment real GDP) is $700. How large is its budget deficit? Its cyclically-adjusted budget
deficit? Its cyclically-adjusted budget deficit as a percentage of potential real GDP? Is
Waxwania’s fiscal policy expansionary or is contractionary?
Chapter 33 – Fiscal Policy, Deficits, and Debt
33-17
5. Refer to the table for Waxwania in problem 4. Suppose that Waxwania is producing $600 of
real GDP, whereas the potential real GDP (or full-employment real GDP) is $700. How large is
its budget deficit? Its cyclically adjusted budget deficit? Its cyclically adjusted budget deficit as a
percentage of potential real GDP? Is Waxwania’s fiscal policy expansionary or is it
contractionary? LO3
6. Suppose that a country has no public debt in year 1 but experiences a budget deficit of $40
billion in year 1, a budget deficit of $20 billion in year 2, a budget surplus of $10 billion in year 3,
and a budget deficit of $2 billion in year 4. What is the absolute size of its public debt in year 4?
If its real GDP in year 4 is $104 billion, what is this country’s public debt as a percentage of real
GDP in year 4? LO6
7. Suppose that the investment demand curve in a certain economy is such that investment
declines by $100 billion for every 1 percentage point increase in the real interest rate. Also,
suppose that the investment demand curve shifts rightward by $150 billion at each real interest
rate for every 1 percentage point increase in the expected rate of return from investment. If
stimulus spending (an expansionary fiscal policy) by government increases the real interest rate
by 2 percentage points, but also raises the expected rate of return on investment by 1 percentage
point, how much investment, if any, will be crowded out? LO6