Chapter 32 – Aggregate Demand and Aggregate Supply
32-1
Chapter 32 – Aggregate Demand and Aggregate Supply
McConnell, Brue, and Flynn 21e
DISCUSSION QUESTIONS
1. Why is the aggregate demand curve downsloping? Specify how your explanation differs from
the explanation for the downsloping demand curve for a single product. What role does the
multiplier play in shifts of the aggregate demand curve? LO1
Chapter 32 – Aggregate Demand and Aggregate Supply
32-2
2. Distinguish between “real–balances effect” and “wealth effect,” as the terms are used in this
chapter. How does each relate to the aggregate demand curve? LO1
3. What assumptions cause the immediate-short-run aggregate supply curve to be horizontal?
Why is the long-run aggregate supply curve vertical? Explain the shape of the short-run aggregate
supply curve. Why is the short-run aggregate supply curve relatively flat to the left of the full-
employment output and relatively steep to the right? LO3
Chapter 32 – Aggregate Demand and Aggregate Supply
32-3
4. Explain how an upsloping aggregate supply curve weakens the realized multiplier effect from
an initial change in investment spending. LO6
5. Why does a reduction in aggregate demand in the actual economy reduce real output, rather
than the price level? Why might a full-strength multiplier apply to a decrease in aggregate
demand? LO6
6. Explain: “Unemployment can be caused by a decrease of aggregate demand or a decrease of
aggregate supply.” In each case, specify the price-level outcomes. LO6
Chapter 32 – Aggregate Demand and Aggregate Supply
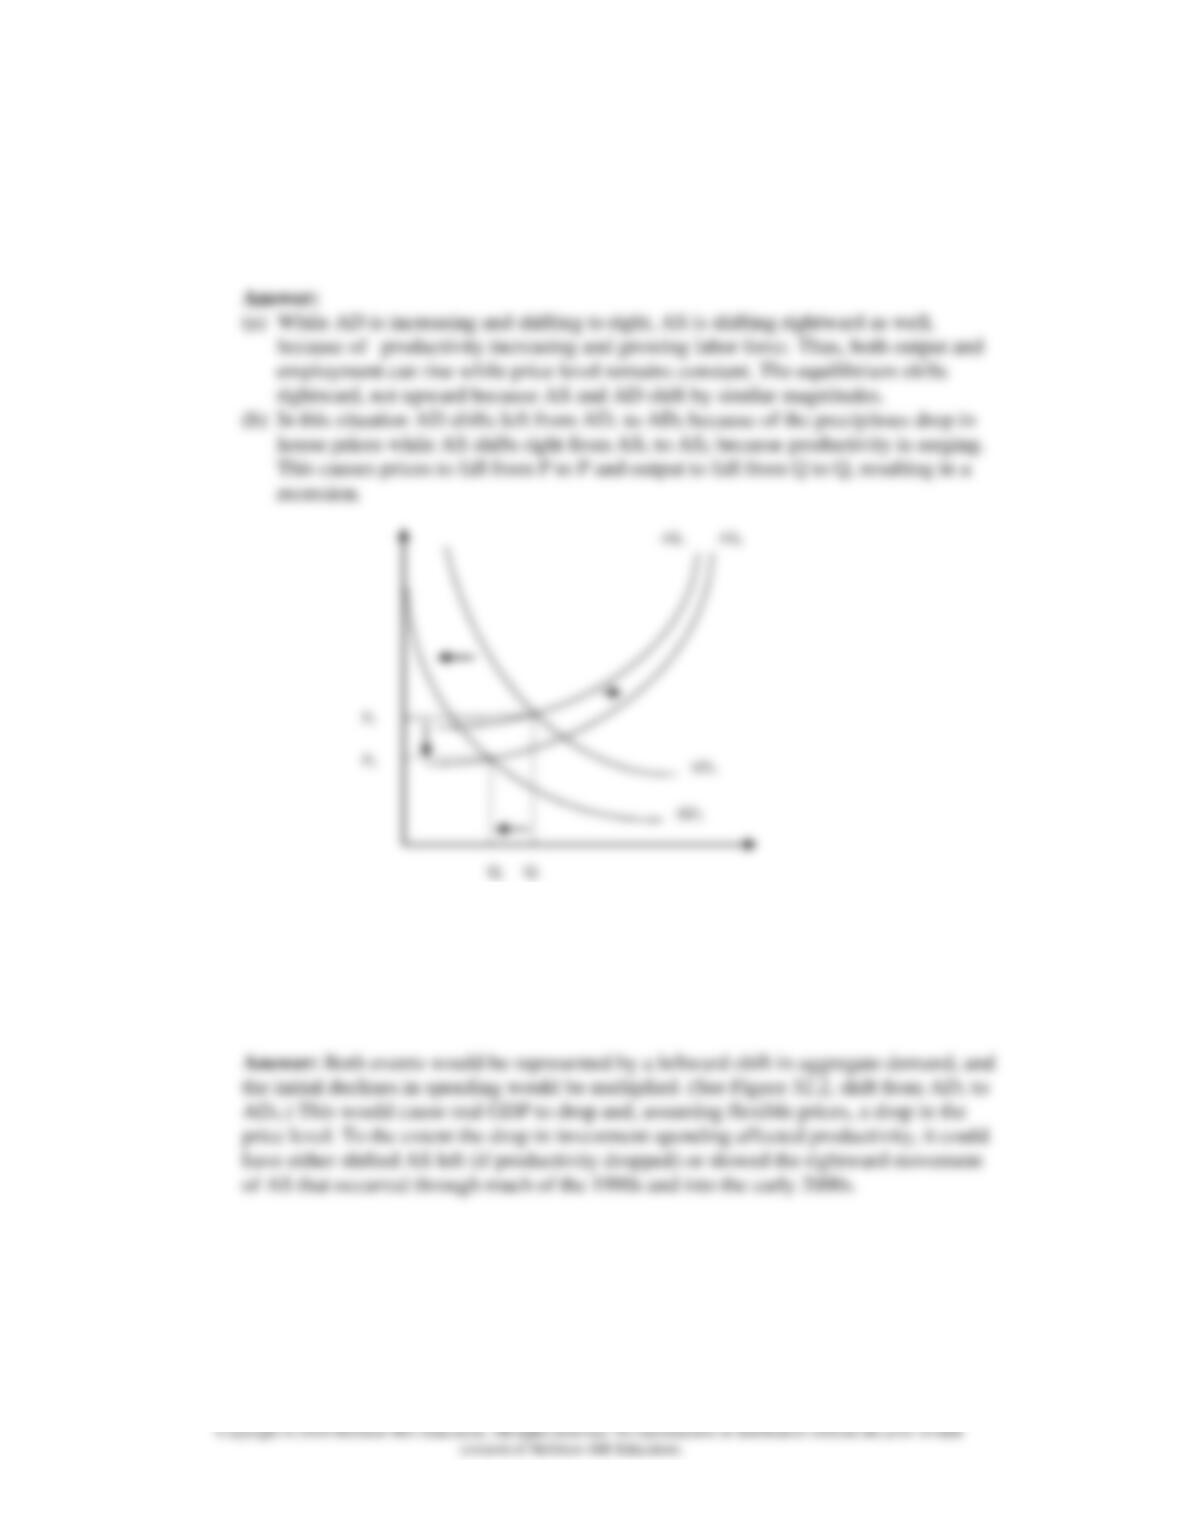
7. Use shifts of the AD and AS curves to explain (a) the U.S. experience of strong economic
growth, full employment, and price stability in the late 1990s and early 2000s and (b) how a
strong negative wealth effect from, say, a precipitous drop in house prices could cause a recession
even though productivity is surging. LO6
8. In early 2001 investment spending sharply declined in the United States. In the 2 months
following the September 11, 2001, attacks on the United States, consumption also declined. Use
AD-AS analysis to show the two impacts on real GDP. LO6
AD1
AD2
P1
P2
Q2
Q1
AS1
AS2
Chapter 32 – Aggregate Demand and Aggregate Supply
32-5
9. LAST WORD What were the monetary and fiscal policy responses to the Great Recession?
What were some of the reasons suggested for why those policy responses didn’t seem to have as
large an effect as anticipated on unemployment and GDP growth?
REVIEW QUESTIONS
1. Which of the following help to explain why the aggregate demand curve slopes downward?
LO1
a. When the domestic price level rises, our goods and services become more expensive to
foreigners.
b. When government spending rises, the price level falls.
c. There is an inverse relationship between consumer expectations and personal taxes.
d. When the price level rises, the real value of financial assets (like stocks, bonds, and savings
account balances) declines.
Chapter 32 – Aggregate Demand and Aggregate Supply
32-6
2. Which of the following will shift the aggregate demand curve to the left? LO2
a. The government reduces personal income taxes.
b. Interest rates rise.
c. The government raises corporate profit taxes.
d. There is an economic boom overseas that raises the incomes of foreign households.
3. Label each of the following descriptions as being either an immediate-short-run aggregate
supply curve, a short-run aggregate supply curve, or a long-run aggregate supply curve. LO3
a. A vertical line.
b. The price level is fixed.
c. Output prices are flexible, but input prices are fixed.
d. A horizontal line.
e. An upsloping curve.
f. Output is fixed.
Chapter 32 – Aggregate Demand and Aggregate Supply
32-7
Copyright © 2018 McGraw-Hill Education. All rights reserved. No reproduction or distribution without the prior written
consent of McGraw-Hill Education.
Answer: a. Long-run; b. Immediate-short-run; c. Short-run; d. Immediate-short-run; e.
Short-run; f. Long-run
Feedback: A vertical line implies a long-run aggregate supply curve because only long-
run aggregate supply curves are vertical (due to the economy always returning to the full–
employment output level in the long run).
The price level is fixed implies an immediate-short-run supply curve because only
immediate-short-run supply curves are horizontal (due to prices being completely
inflexible in the immediate short run).
Output prices are flexible but input prices are fixed implies a short-run aggregate supply
curve because it is only during the short run that input prices are fixed while output prices
are flexible. By contrast, in the immediate short run, both input and output prices are
fixed, and in the long run, both input and output prices are flexible.
A horizontal line implies an immediate-short-run aggregate supply curve because only
immediate-short-run aggregate supply curves are horizontal (due to prices being fixed in
the immediate short run).
An upsloping curve implies a short-run aggregate supply curve because only short-run
aggregate supply curves are upsloping (due to the fact that in the short run input prices
are fixed while output prices are flexible, so that if output prices rise, profits go up and
encourage firms to produce more, hence the upward slope and the positive relationship
between the price level and output).
Output is fixed implies a long-run aggregate supply curve because only long-run
aggregate supply curves have fixed output (due to the fact that in the long run, output will
always return to the full-employment level of real GDP no matter what the price level is).
4. Which of the following will shift the aggregate supply curve to the right? LO4
a. A new networking technology increases productivity all over the economy.
b. The price of oil rises substantially.
c. Business taxes fall.
d. The government passes a law doubling all manufacturing wages.
Chapter 32 – Aggregate Demand and Aggregate Supply
32-8
Copyright © 2018 McGraw-Hill Education. All rights reserved. No reproduction or distribution without the prior written
consent of McGraw-Hill Education.
Feedback: The scenario that a new networking technology increases productivity all
over the economy will cause the aggregate supply curve to shift right because the higher
levels of productivity will enable firms to produce more output (and generate more
revenues) from any given set of inputs. With inputs fixed and revenues increasing due to
selling more output, profits will rise. And higher profits will encourage firms to produce
more at any given price level. Consequently, the aggregate supply curve will shift right.
Under the scenario that business taxes fall, aggregate supply will shift to the right
because firms’ after-tax profits will increase no matter what the price level is. Those
higher profits will encourage businesses to produce more, and hence the aggregate supply
curve will shift to the right.
The other two answers are incorrect because they both describe scenarios that would
cause the aggregate supply curve to shift to the left (rather than to the right). For instance,
a scenario in which the price of oil rises substantially is one in which many firms will
find their costs increasing substantially. That will reduce their profits and hence their
desire to produce output. The result will be less output supplied no matter what the price
level happens to be, which is the same thing as saying that the aggregate supply curve
will shift left. A scenario in which the government passes a law doubling all
manufacturing wages is also one in which the aggregate supply curve will shift to the left.
The higher wages will reduce firm profits and hence the desire of firms to produce
output. That will result in the aggregate supply curve shifting left because less output will
be produced no matter what the price level is.
5. At the current price level, producers supply $375 billion of final goods and services while
consumers purchase $355 billion of final goods and services. The price level is: LO5
a. Above equilibrium.
b. At equilibrium.
c. Below equilibrium.
d. More information is needed.
Chapter 32 – Aggregate Demand and Aggregate Supply
32-9
6. What effects would each of the following have on aggregate demand or aggregate supply, other
things equal? In each case use a diagram to show the expected effects on the equilibrium price
level and the level of real output, assuming that the price level is flexible both upward and
downward. LO3
a. A widespread fear by consumers of an impending economic depression.
b. A new national tax on producers based on the value-added between the costs of the inputs and
the revenue received from their output.
c. A reduction in interest rates at each price level.
d. A major increase in spending for health care by the Federal government.
e. The general expectation of coming rapid inflation.
f. The complete disintegration of OPEC, causing oil prices to fall by one-half.
g. A 10 percent across-the-board reduction in personal income tax rates.
h. A sizable increase in labor productivity (with no change in nominal wages).
i. A 12 percent increase in nominal wages (with no change in productivity).
j. An increase in exports that exceeds an increase in imports (not due to tariffs).
7. True or False: Decreases in AD normally lead to decreases in both output and the price level.
LO6
Chapter 32 – Aggregate Demand and Aggregate Supply
32-10
8. Assume that (a) the price level is flexible upward but not downward and (b) the economy is
currently operating at its full-employment output. Other things equal, how will each of the
following affect the equilibrium price level and equilibrium level of real output in the short run?
LO3
a. An increase in aggregate demand.
b. A decrease in aggregate supply, with no change in aggregate demand.
c. Equal increases in aggregate demand and aggregate supply.
d. A decrease in aggregate demand.
e. An increase in aggregate demand that exceeds an increase in aggregate supply.
9. True or False: If the price of oil suddenly increases by a large amount, AS will shift left, but
the price level will not rise thanks to price inflexibility. LO6
Chapter 32 – Aggregate Demand and Aggregate Supply
32-11
PROBLEMS
1. Suppose that consumer spending initially rises by $5 billion for every 1 percent rise in
household wealth and that investment spending initially rises by $20 billion for every 1
percentage point fall in the real interest rate. Also assume that the economy’s multiplier is 4. If
household wealth falls by 5 percent because of declining house values, and the real interest rate
falls by two percentage points, in what direction and by how much will the aggregate demand
curve initially shift at each price level? In what direction and by how much will it eventually
shift? LO2
Chapter 32 – Aggregate Demand and Aggregate Supply
32-12
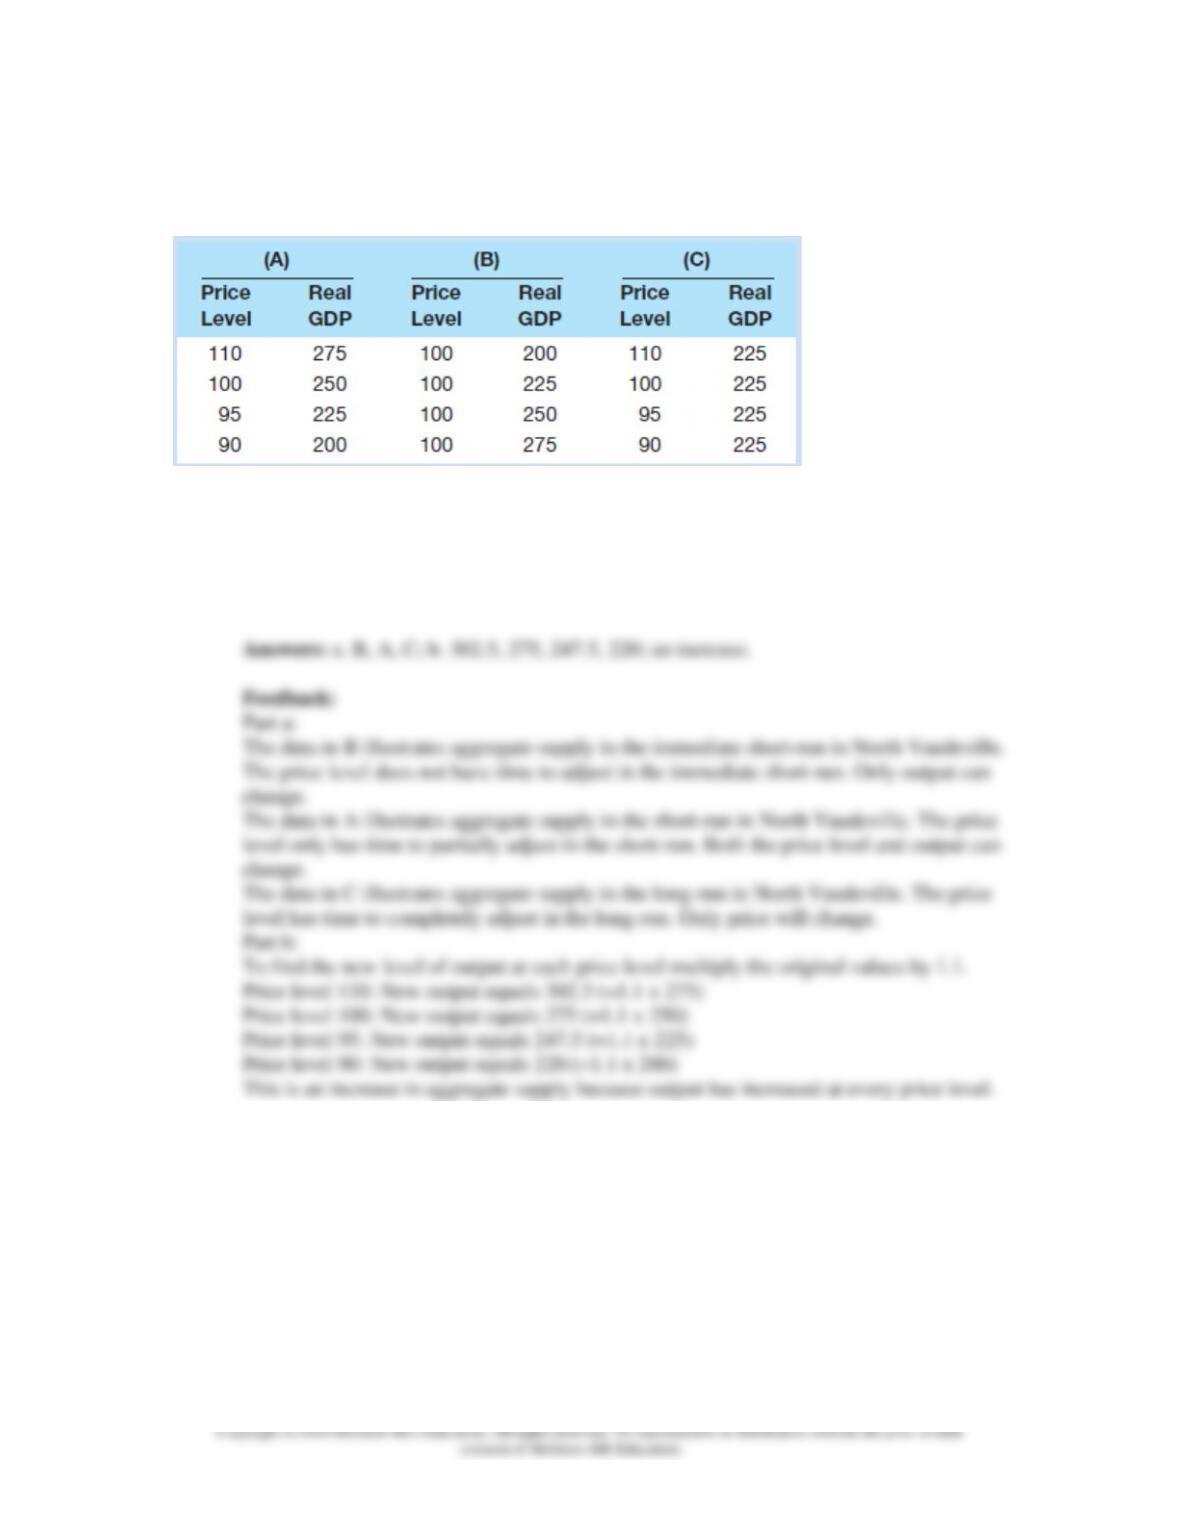
2. Answer the following questions on the basis of the three sets of data for the country of North
Vaudeville: LO4
a. Which set of data illustrates aggregate supply in the immediate short run in North Vaudeville?
The short run? The long run?
b. Assuming no change in hours of work, if real output per hour of work increases by 10 percent,
what will be the new levels of real GDP in the right column of A? Does the new data reflect an
increase in aggregate supply or does it indicate a decrease in aggregate supply?
Chapter 32 – Aggregate Demand and Aggregate Supply
32-13
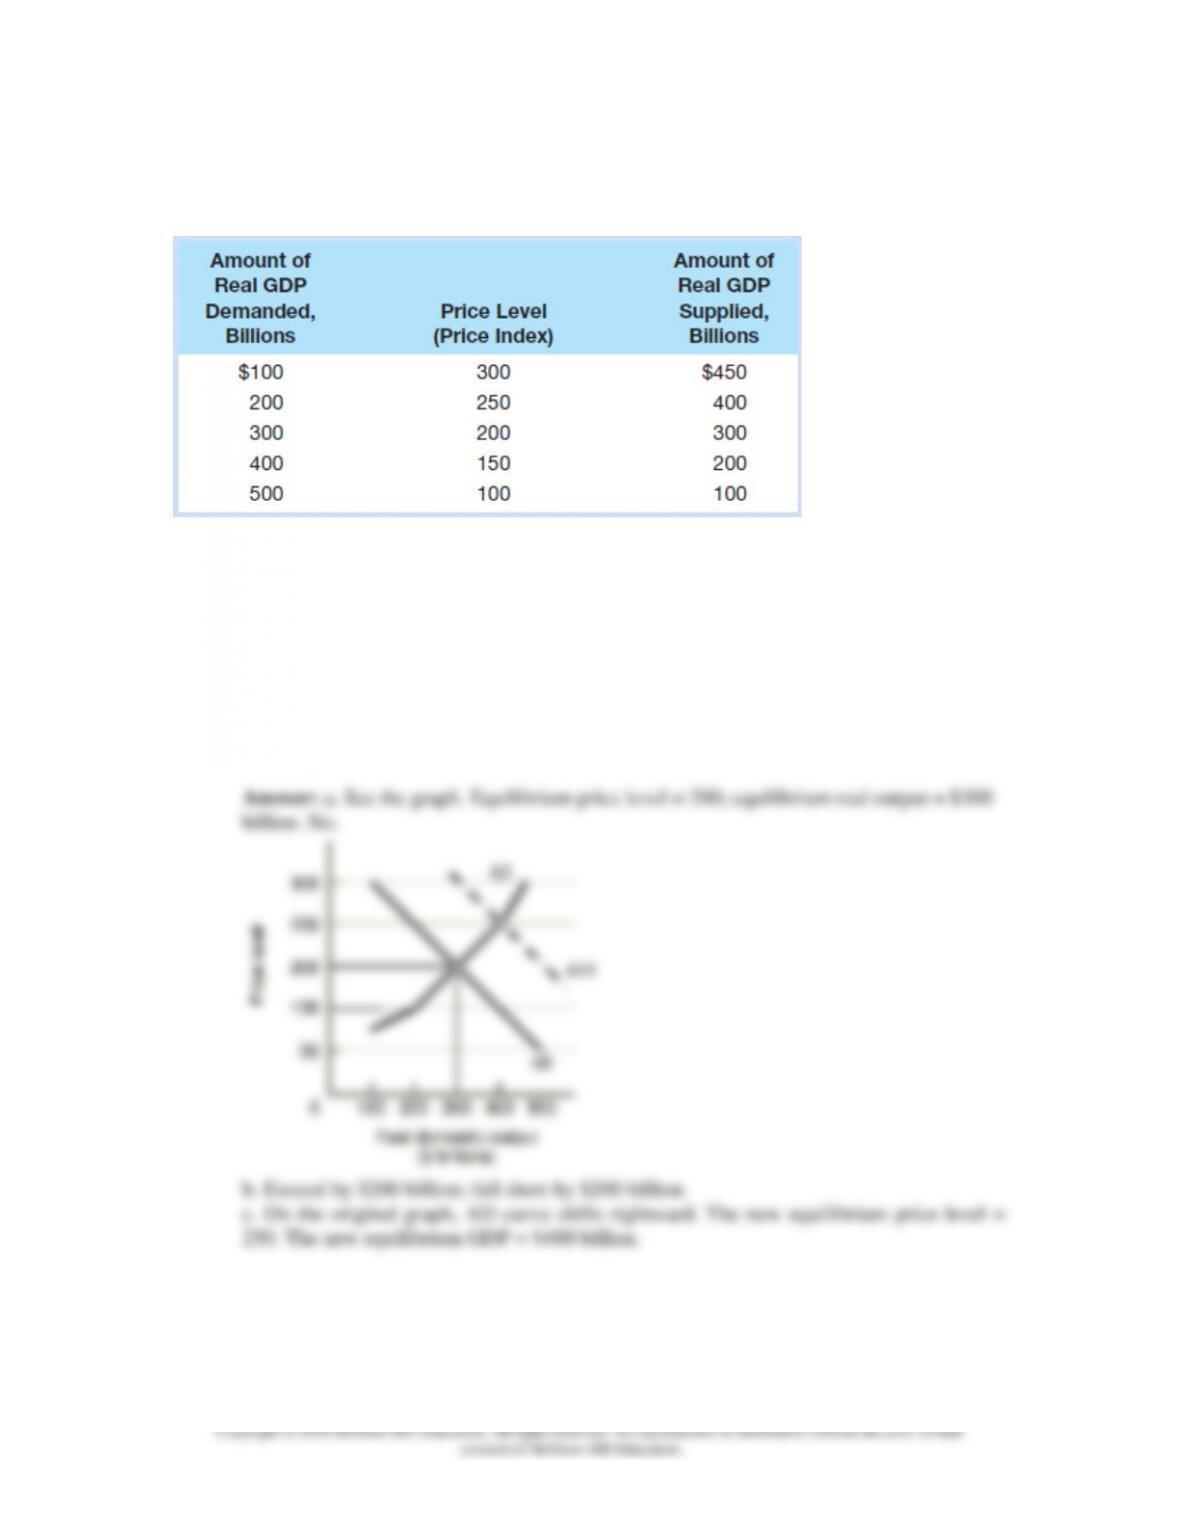
3. Suppose that the aggregate demand and aggregate supply schedules for a hypothetical economy
are as shown below: LO5
a. Use these sets of data to graph the aggregate demand and aggregate supply curves. What is the
equilibrium price level and the equilibrium level of real output in this hypothetical economy? Is
the equilibrium real output also necessarily the full-employment real output?
b. If the price level in this economy is 150, will quantity demanded equal, exceed, or fall short of
quantity supplied? By what amount? If the price level is 250, will quantity demanded equal,
exceed, or fall short of quantity supplied? By what amount?
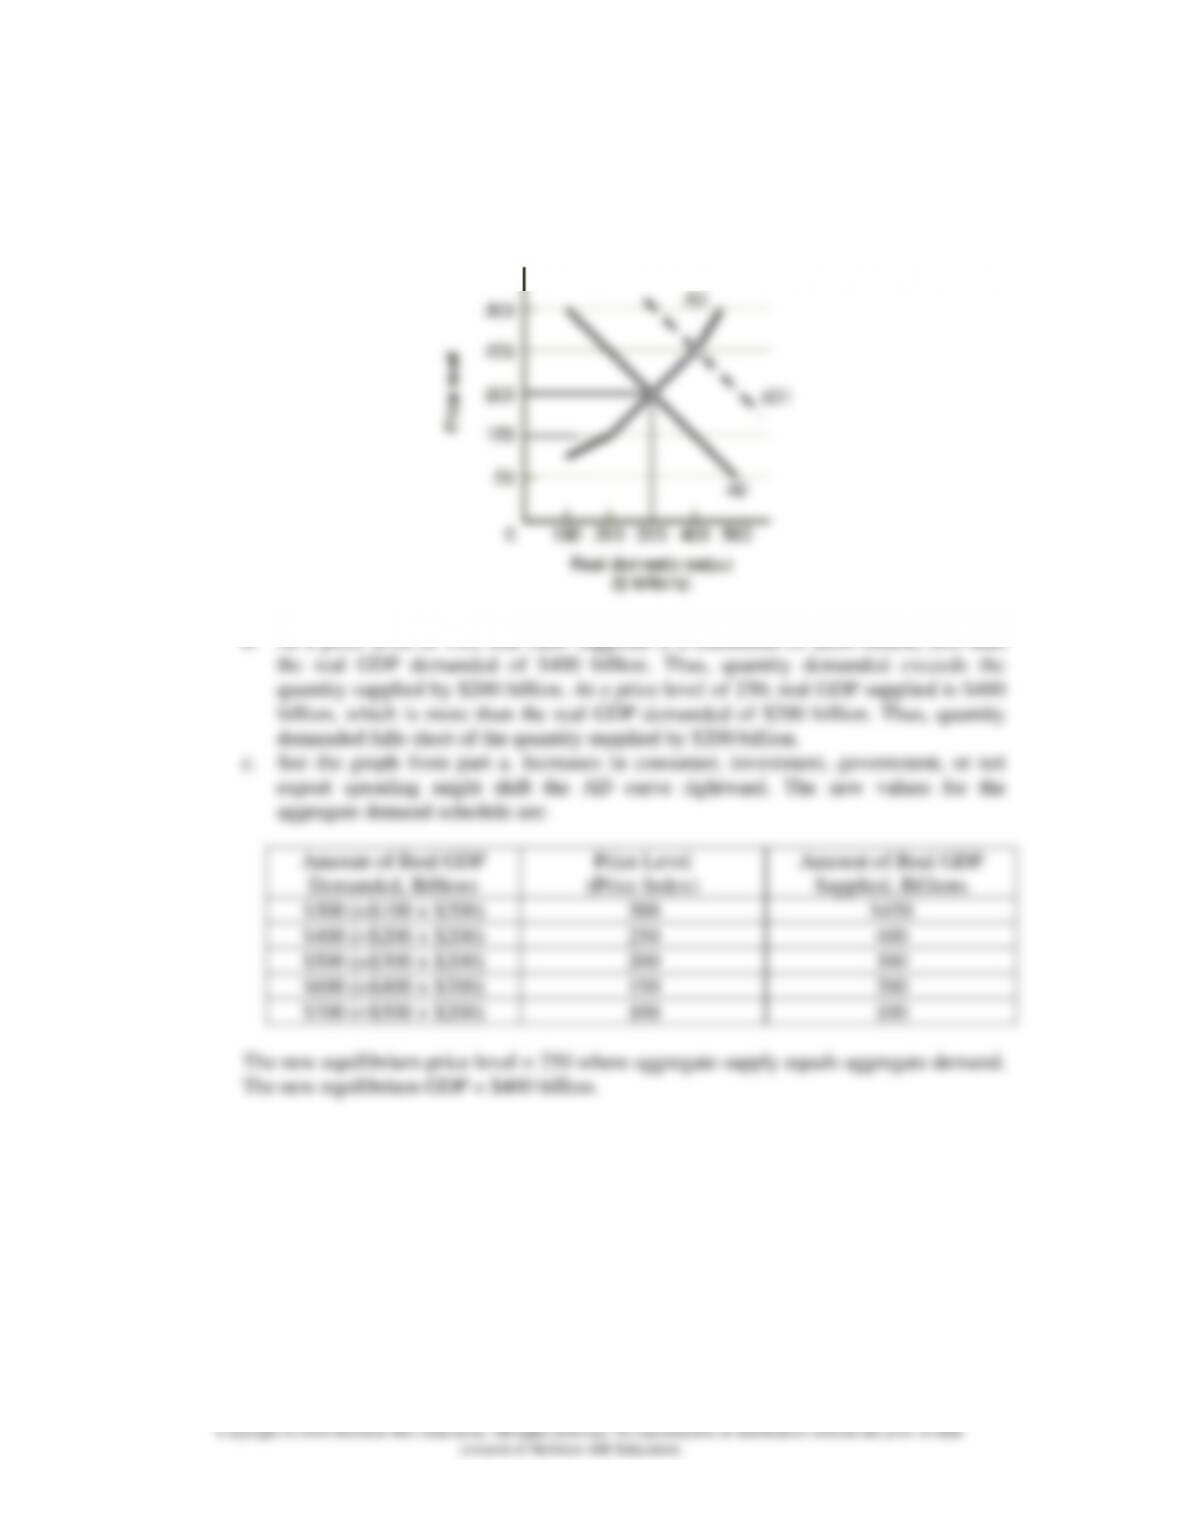
c. Suppose that buyers desire to purchase $200 billion of extra real output at each price level.
Sketch in the new aggregate demand curve as AD1. What is the new equilibrium price level and
level of real output?
Chapter 32 – Aggregate Demand and Aggregate Supply
32-14
Feedback:
a. See the graph. Equilibrium price level = 200, which occurs where aggregate supply
equals aggregate demand, Thus the equilibrium real output = $300 billion. No, the
full-capacity level of GDP cannot be determined without more information.
b. At a price level of 150, real GDP supplied is a maximum of $200 billion, less than
Chapter 32 – Aggregate Demand and Aggregate Supply
32-15
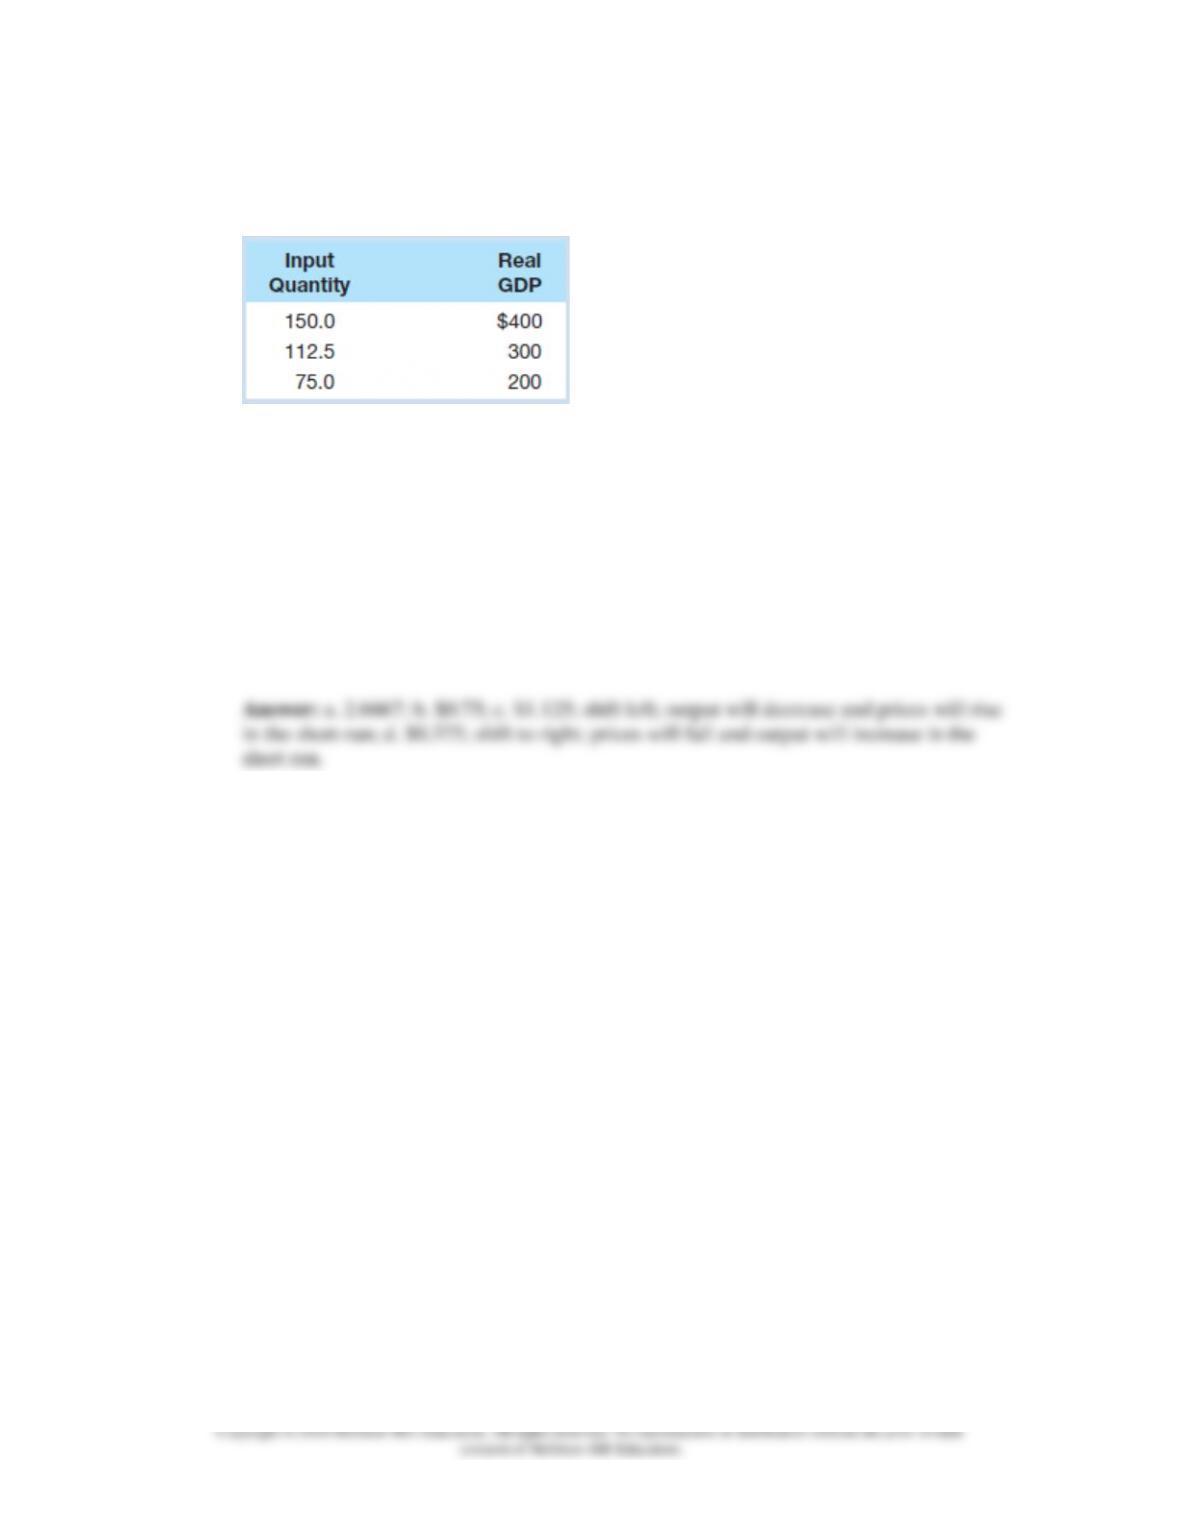
4. Suppose that the table below shows an economy’s relationship between real output and the
inputs needed to produce that output: LO4
a. What is productivity in this economy?
b. What is the per-unit cost of production if the price of each input unit is $2?
c. Assume that the input price increases from $2 to $3 with no accompanying change in
productivity. What is the new per-unit cost of production? In what direction would the $1
increase in input price push the economy’s aggregate supply curve? What effect would this shift
of aggregate supply have on the price level and the level of real output?
d. Suppose that the increase in input price does not occur but, instead, that productivity increases
by 100 percent. What would be the new per-unit cost of production? What effect would this
change in per-unit production cost have on the economy’s aggregate supply curve? What effect
would this shift of aggregate supply have on the price level and the level of real output?
Chapter 32 – Aggregate Demand and Aggregate Supply
32-16
Feedback:
Part a:
Productivity is defined by how much output each unit of the input produces.
Part b:
The per unit cost is defined by how much each unit of output costs to produce. The total
cost of production equals $300 (you can use any combination above) when real GDP is
Part c:
The new per unit cost = ($3 x 150) / $400 =$450 / $400 = $1.125.
This would cause firms to raise prices at every level of output (higher input cost), thus the
aggregate supply schedule would shift left.
This would cause output to decrease and prices to rise in short-run.
Chapter 32 – Aggregate Demand and Aggregate Supply
32-17
5. Refer to the data in the table that accompanies Problem 2. Suppose that the present equilibrium
price level and level of real GDP are 100 and $225, and that data set B represents the relevant
aggregate supply schedule for the economy. LO6
a. What must be the current amount of real output demanded at the 100 price level?
b. If the amount of output demanded declined by $25 at the 100 price shown levels in B, what
would be the new equilibrium real GDP? In business cycle terminology, what would economists
call this change in real GDP?