Exercise 8–14
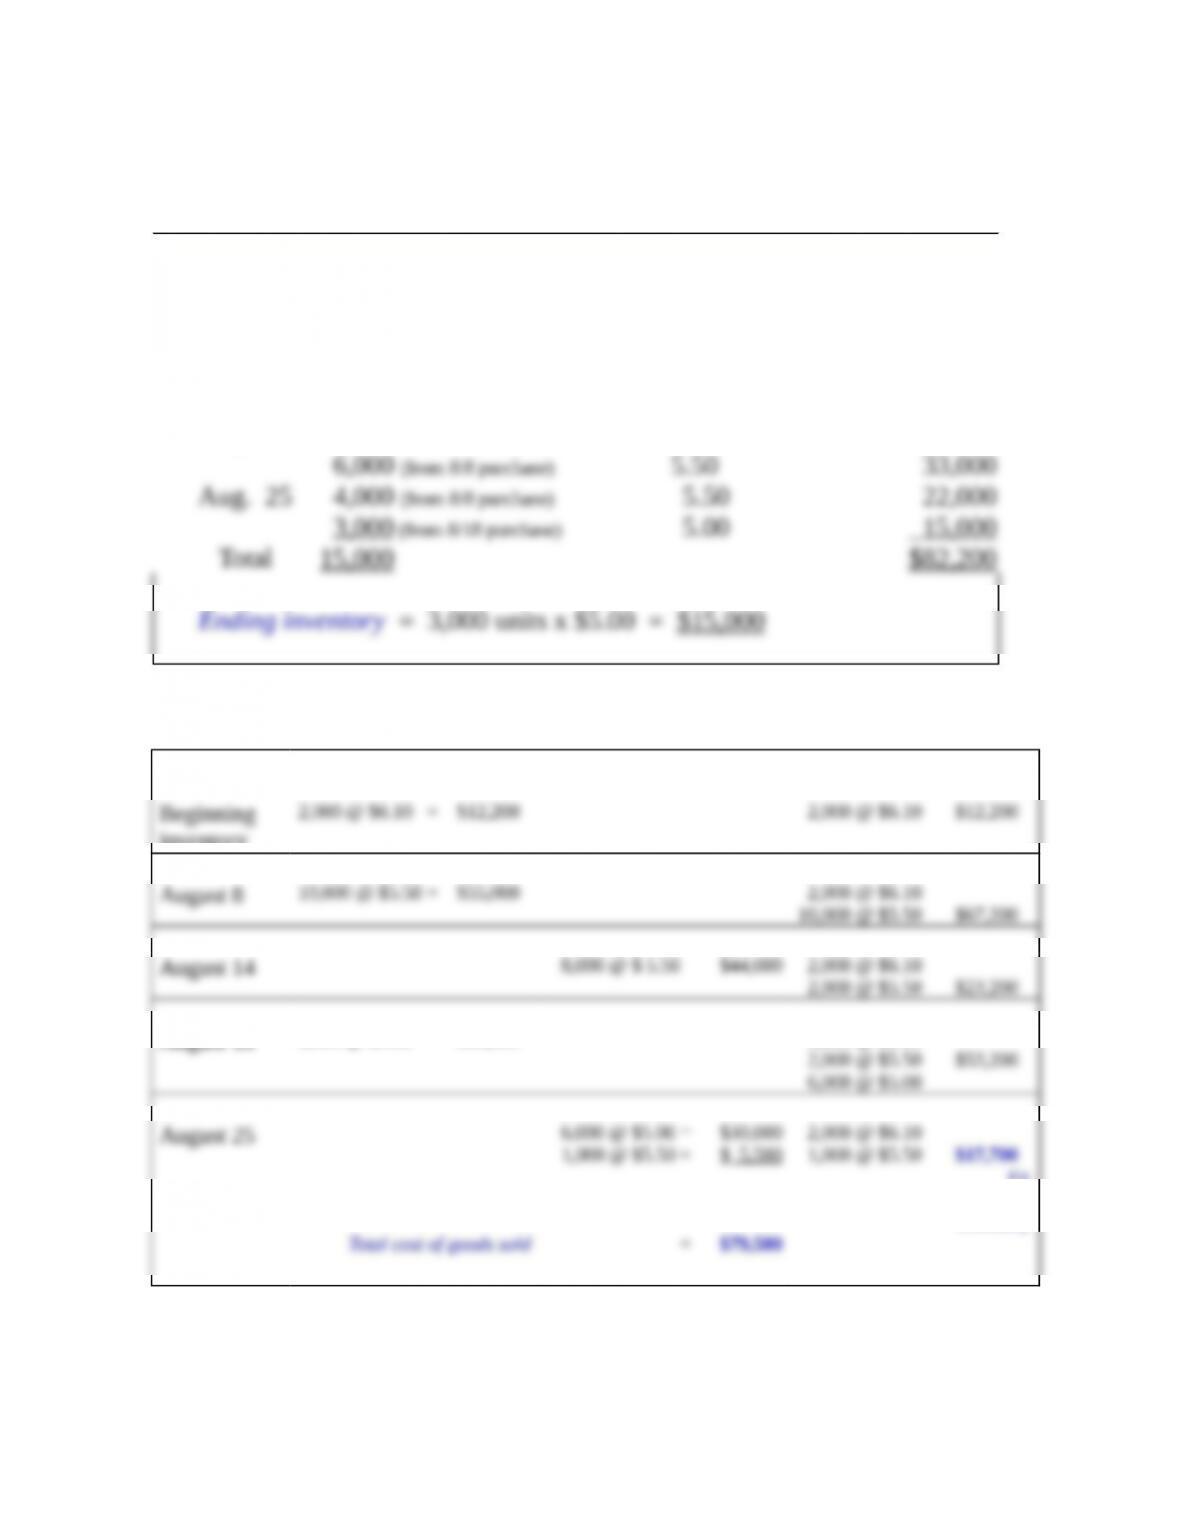
First-in, first-out (FIFO)
Cost of goods sold:
Date of Cost of
Sale Units Sold Units Sold Total Cost
Aug. 14 2,000 (from Beg. Inv.) $6.10 $12,200
Last-in, first-out (LIFO)
Date Purchased Sold Balance
August 18 6,000 @ $5.00 = $30,000 2,000 @ $6.10
En
ding
inventory
Exercise 8–14 (concluded)
(Note: the perpetual inventory LIFO results in this exercise are the same as
periodic LIFO results, due to the timing of sales and purchases. The same LIFO
layers are on hand at the end of the period under each method. This is unusual.
LIFO perpetual and LIFO periodic normally produce different results for ending
inventory and cost of goods sold.)
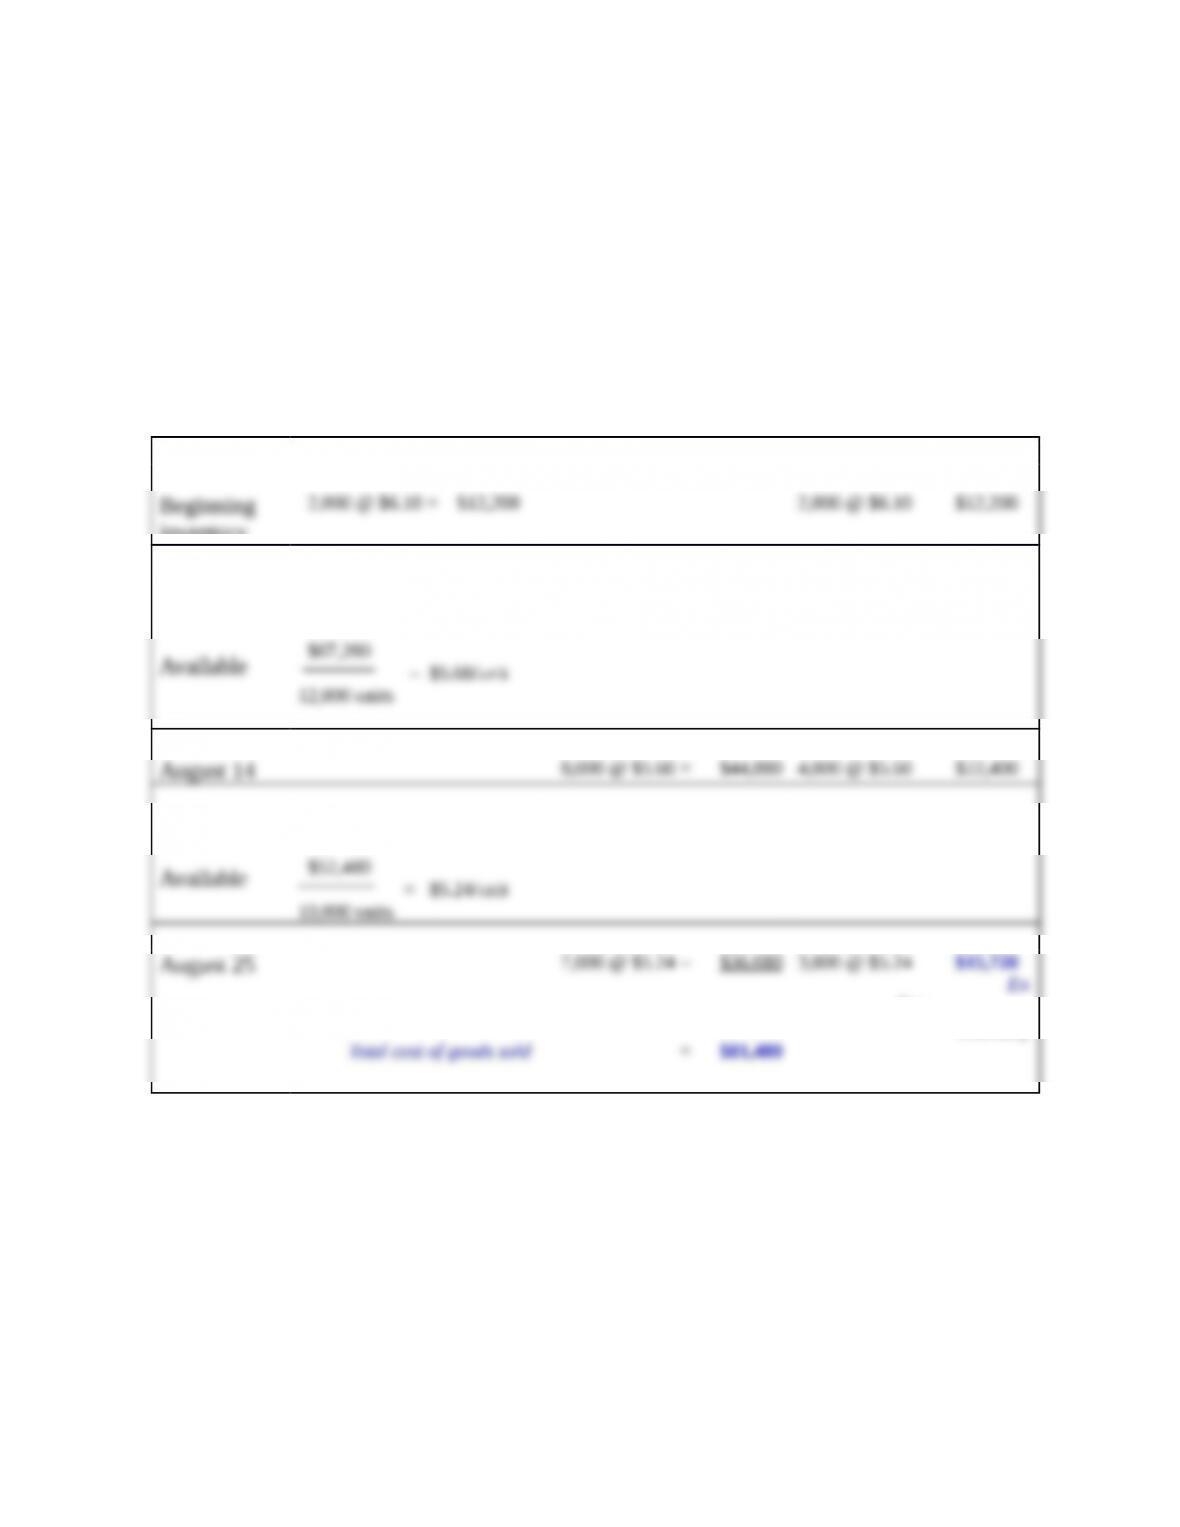
Average cost
Date Purchased Sold Balance
inventory
August 8
10,000 @ $5.50 = $55,000
August 18
6,000 @ $5.00 = $30,000
En
ding
inventory
Exercise 8–15
Requirement 1
LIFO will result in the highest cost of goods sold figure because both the cost
of merchandise and the quantity of merchandise rose during the period. FIFO will
result in the highest ending inventory balance for the same reasons.
Requirement 2
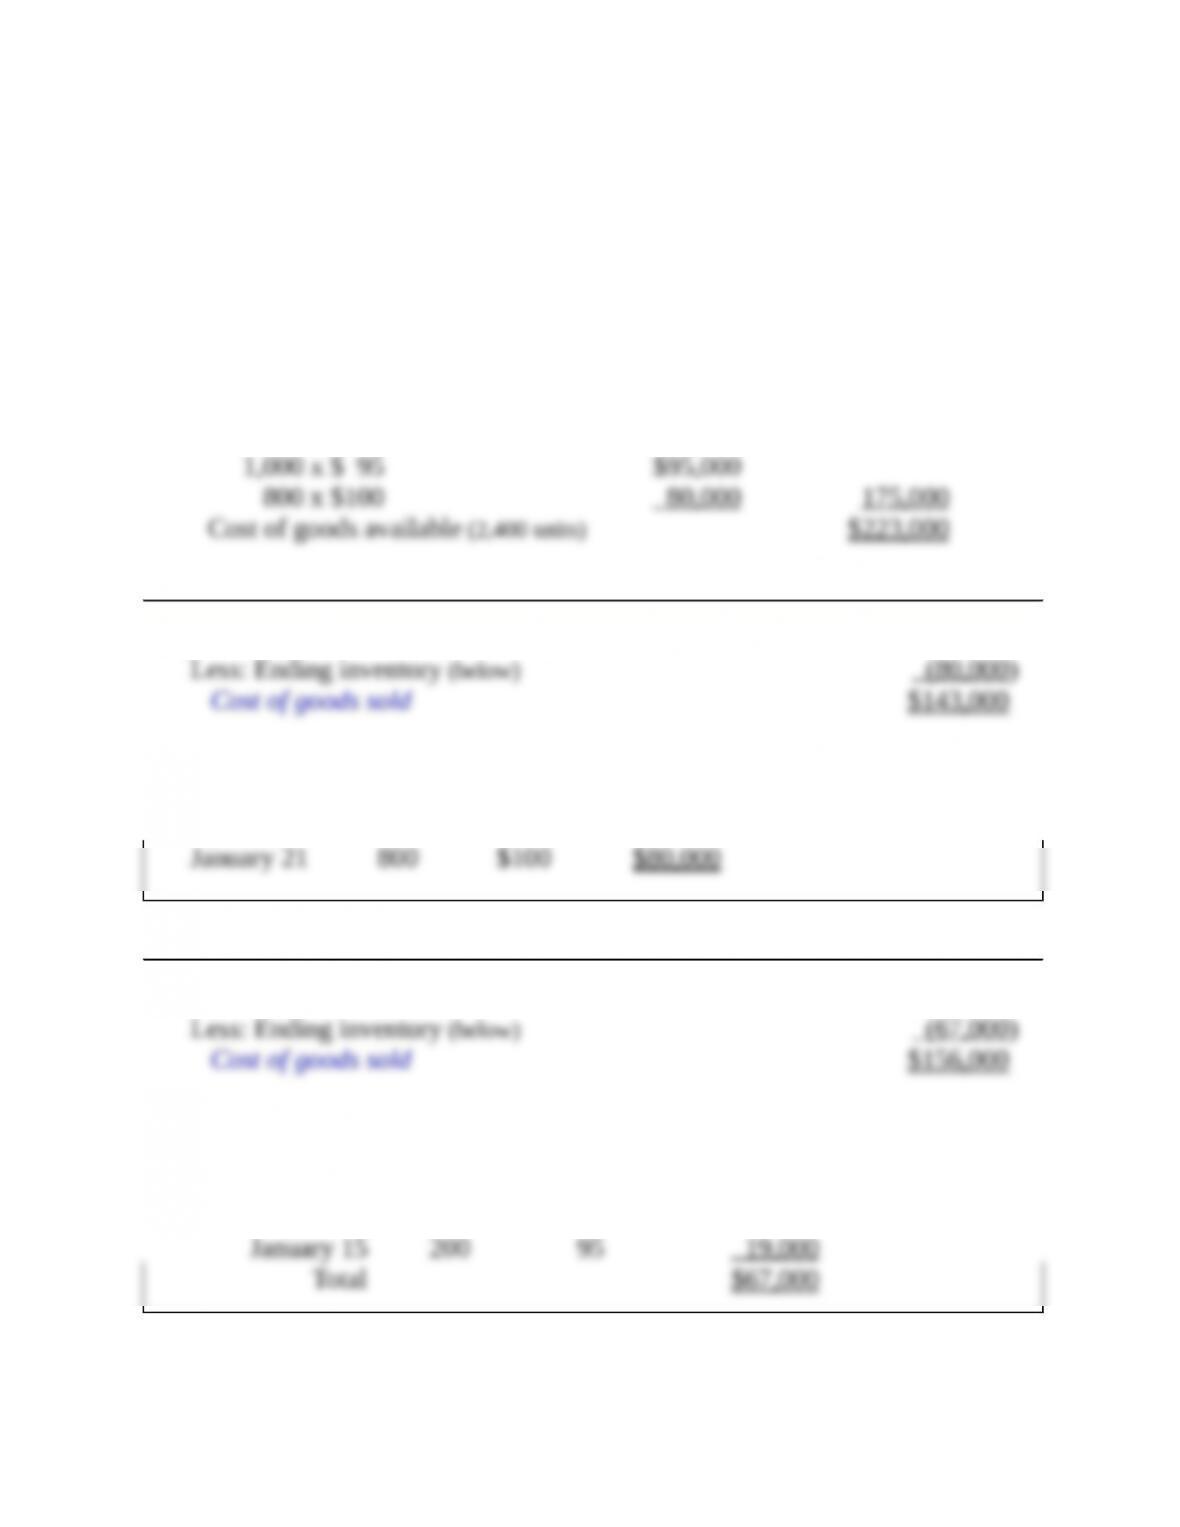
Cost of goods available for sale:
Beginning inventory (600 x $80) $ 48,000
Purchases:
First-in, first-out (FIFO)
Cost of goods available for sale (2,400 units) $223,000
Cost of ending inventory:
Date of
purchase Units Unit cost Total cost
Last-in, first-out (LIFO)
Cost of goods available for sale (2,400 units) $223,000
Cost of ending inventory:
Date of
purchase Units Unit cost Total cost
Beg. Inv. 600 $80 $48,000
Exercise 8–16
Requirement 1
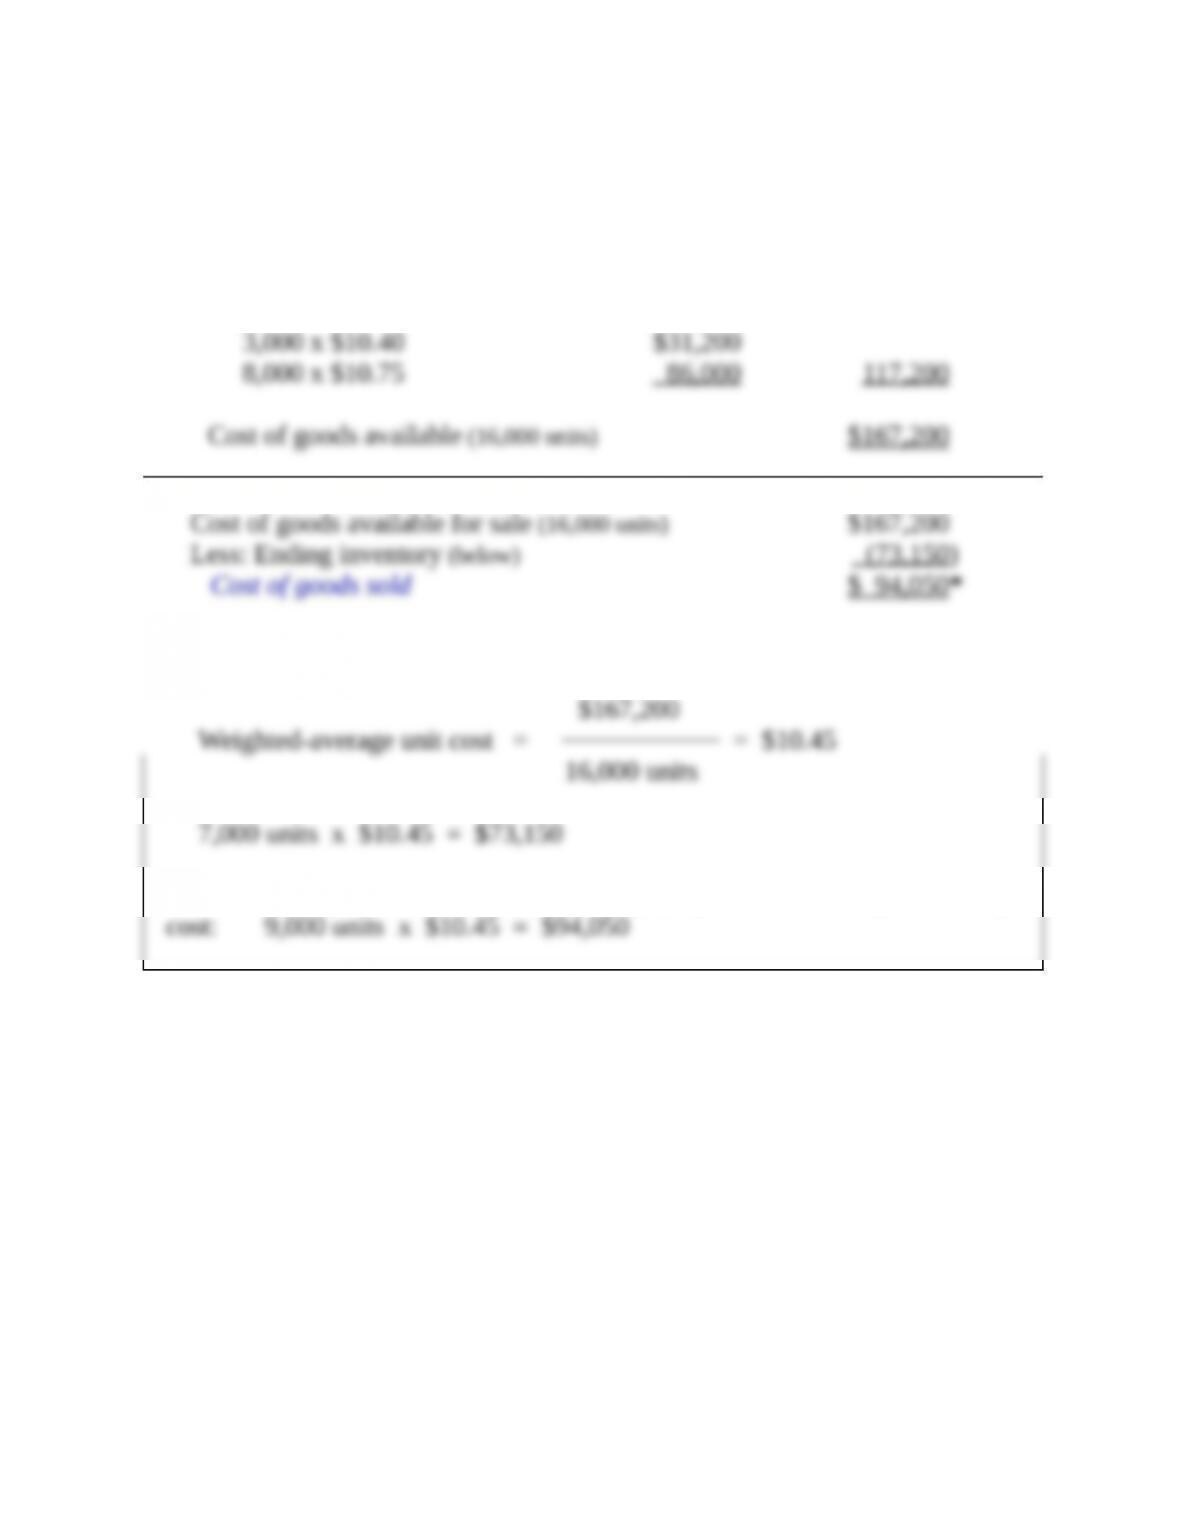
Cost of goods available for sale:
Beginning inventory (5,000 x $10.00) $ 50,000
Purchases:
Cost of ending inventory:
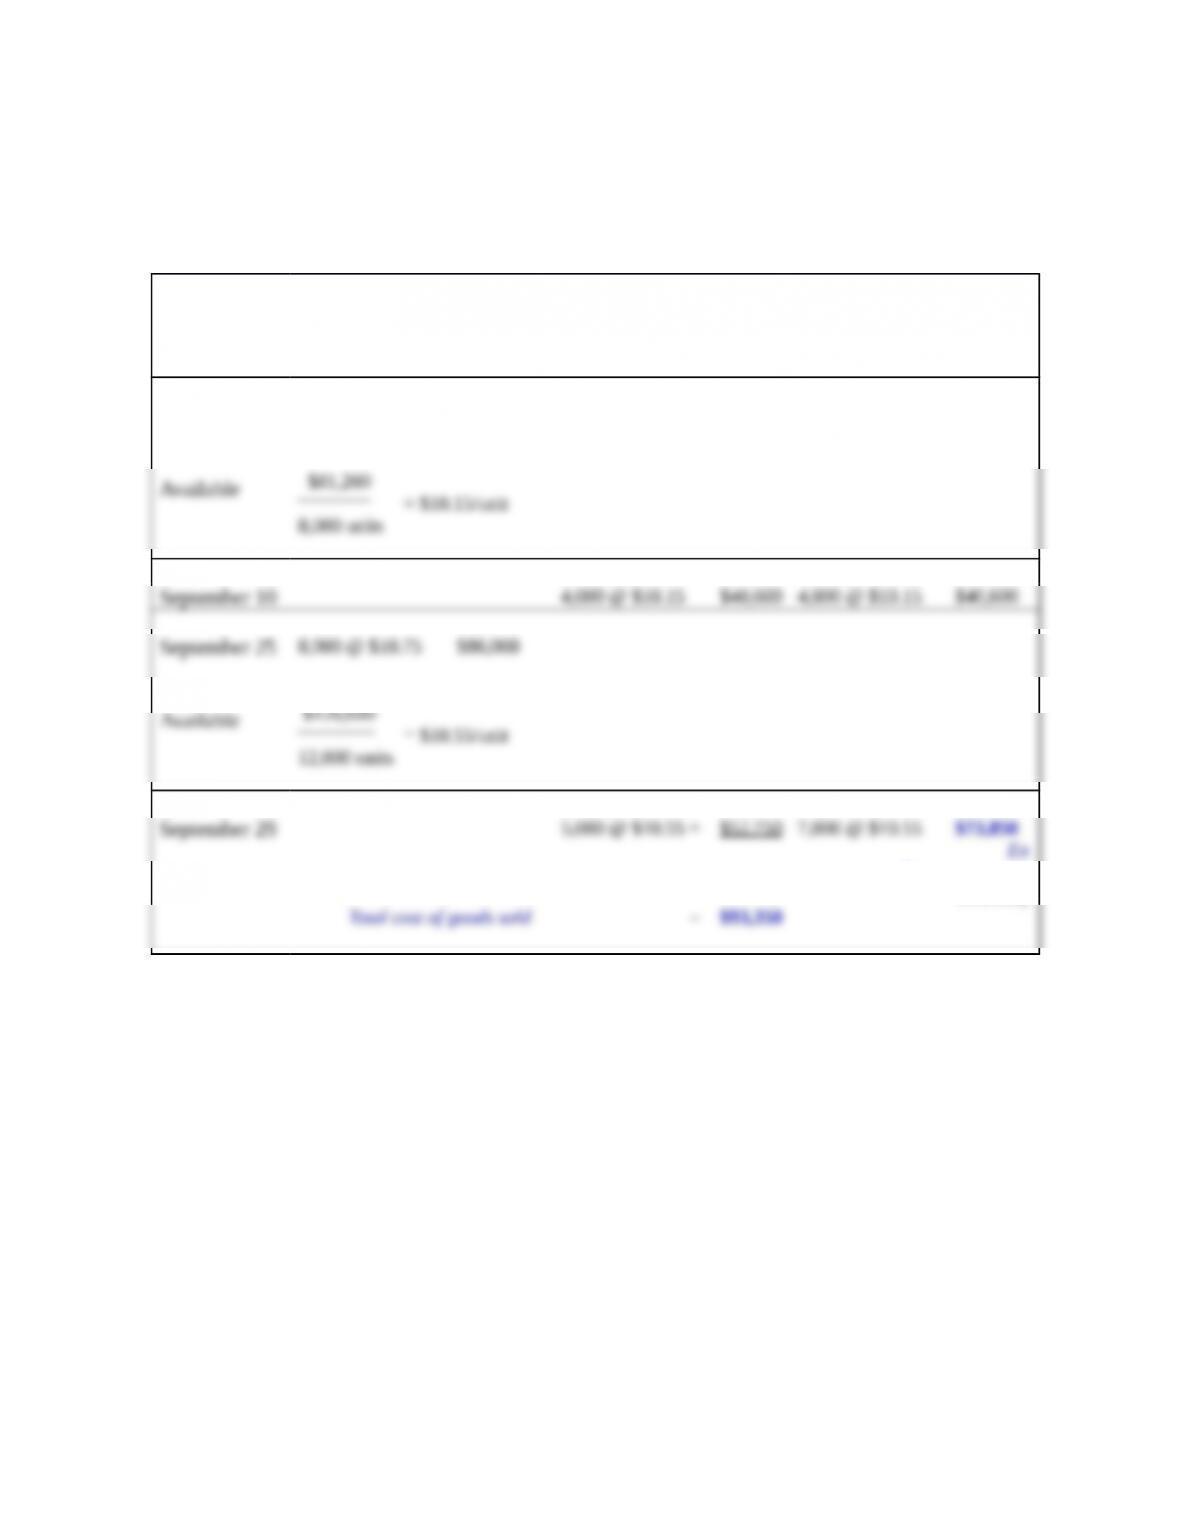
* Alternatively, could be determined by multiplying the units sold by the average
Exercise 8–16 (concluded)
Requirement 2
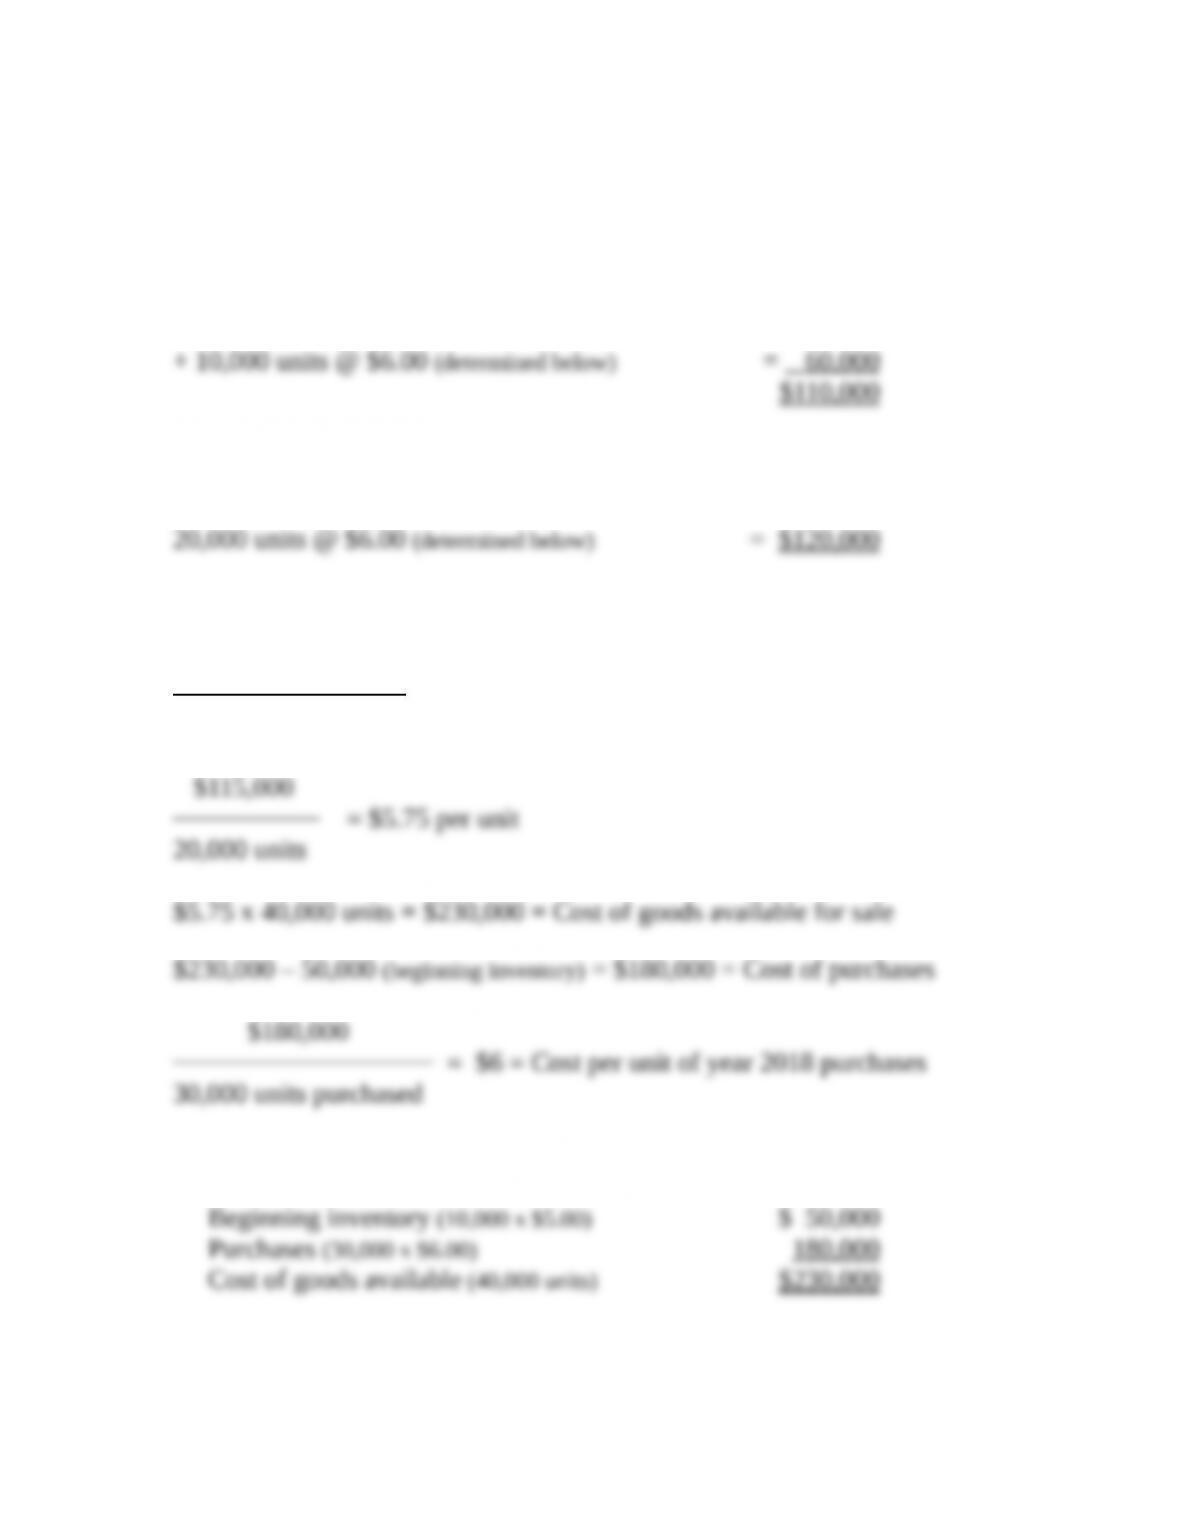
Date Purchased Sold Balance
Beginning
inventory
5,000 @ $10.00 = $50,000 5,000 @ $10.00 $50,000
September 7
3,000 @ $10.40 = $31,200
$126,600
En
ding
inventory
Exercise 8–17
Requirement 1
FIFO cost of goods sold:
10,000 units @ $5.00 = $50,000
Requirement 2
LIFO cost of goods sold:
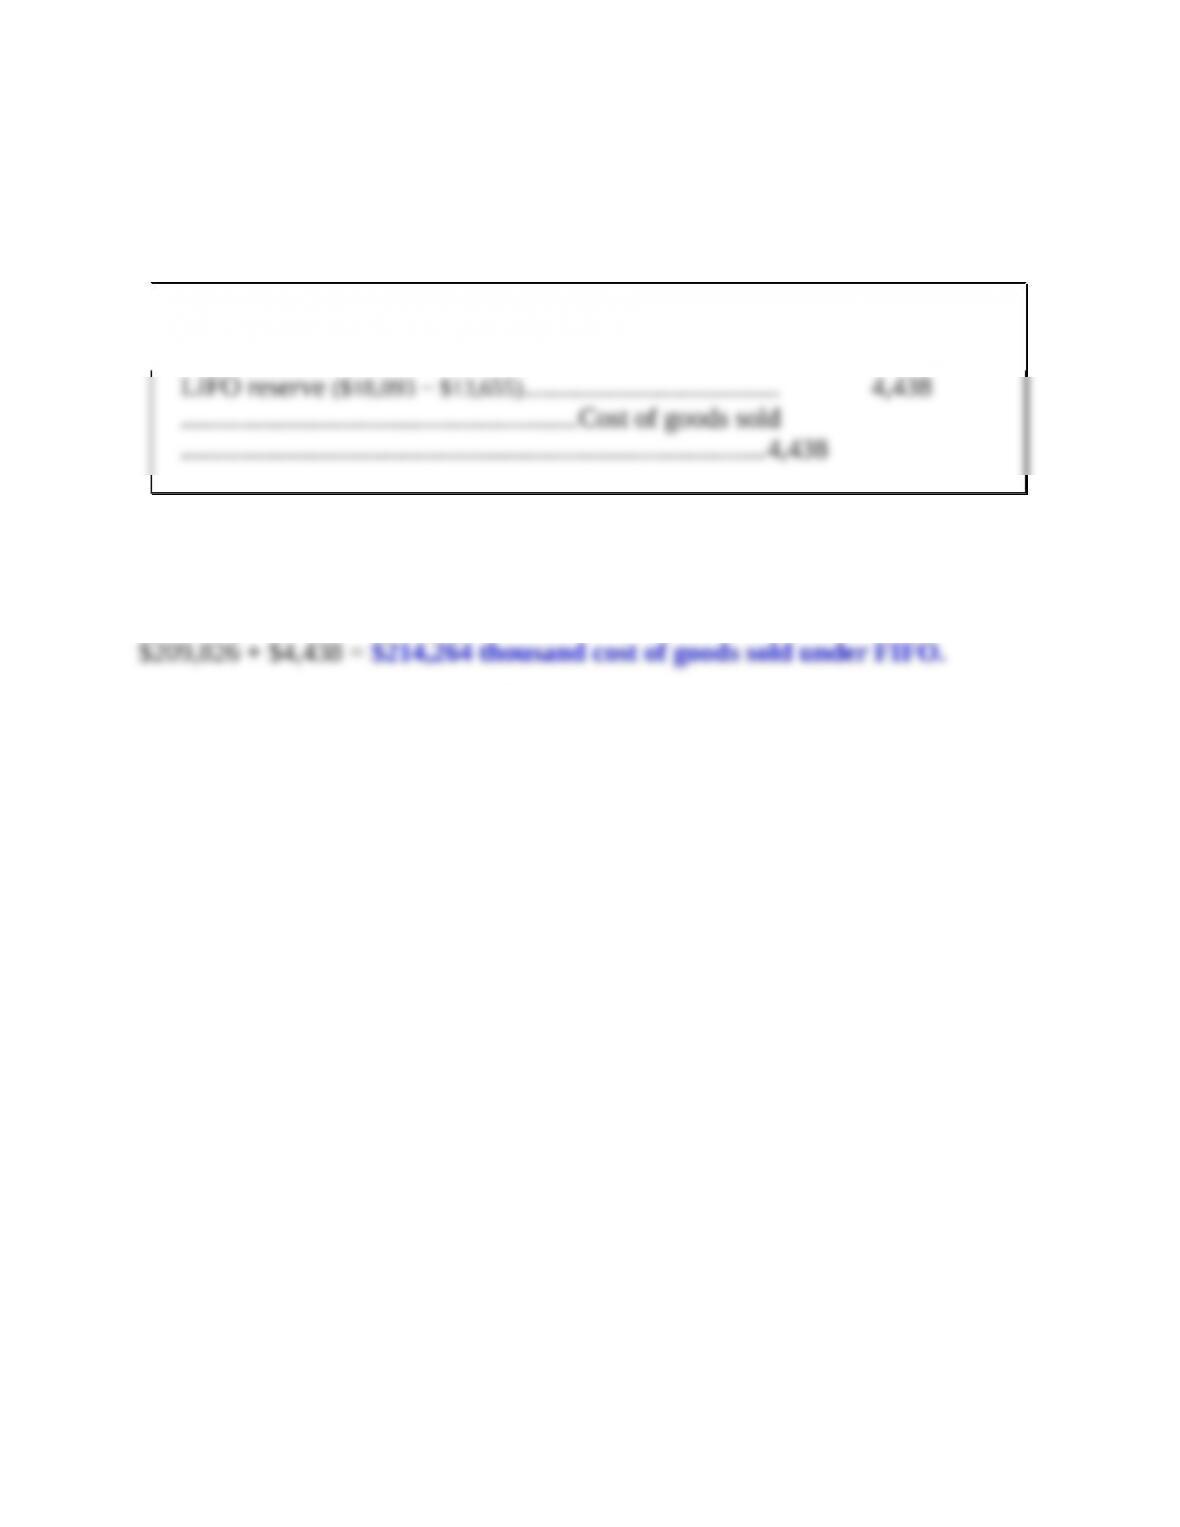
Calculations to determine cost per unit of year 2018 purchases:
Cost of goods sold
= Weighted-average cost per unit
Number of units sold
Cost of goods available for sale:
Exercise 8–18
Requirement 1
January 31, 2016 ($ in
thousands)
Requirement 2
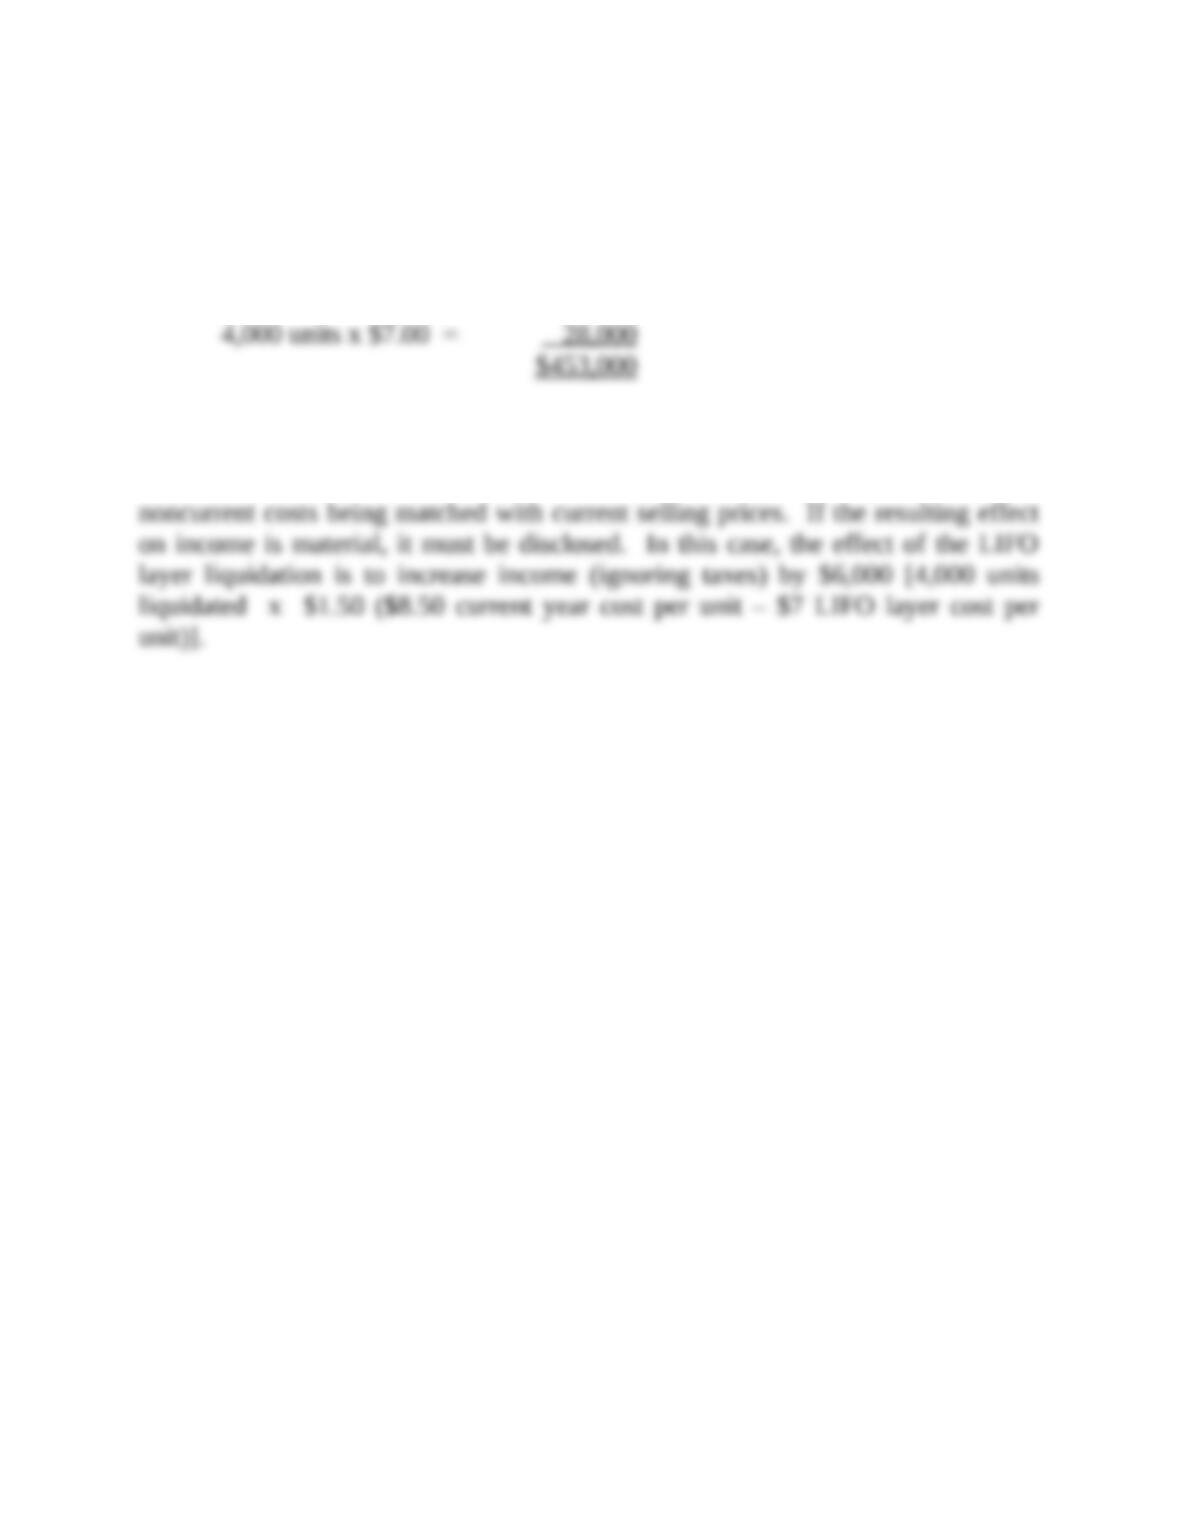
Cost of goods sold is provided as $209,826 (thousand) on a LIFO basis. To convert
LIFO to FIFO, the adjustment in Requirement 1 converting FIFO to LIFO is
reversed and cost of goods sold is thereby increased by $4,438.
Exercise 8–19
Requirement 1
Cost of goods sold:
50,000 units x $8.50 = $425,000
Requirement 2
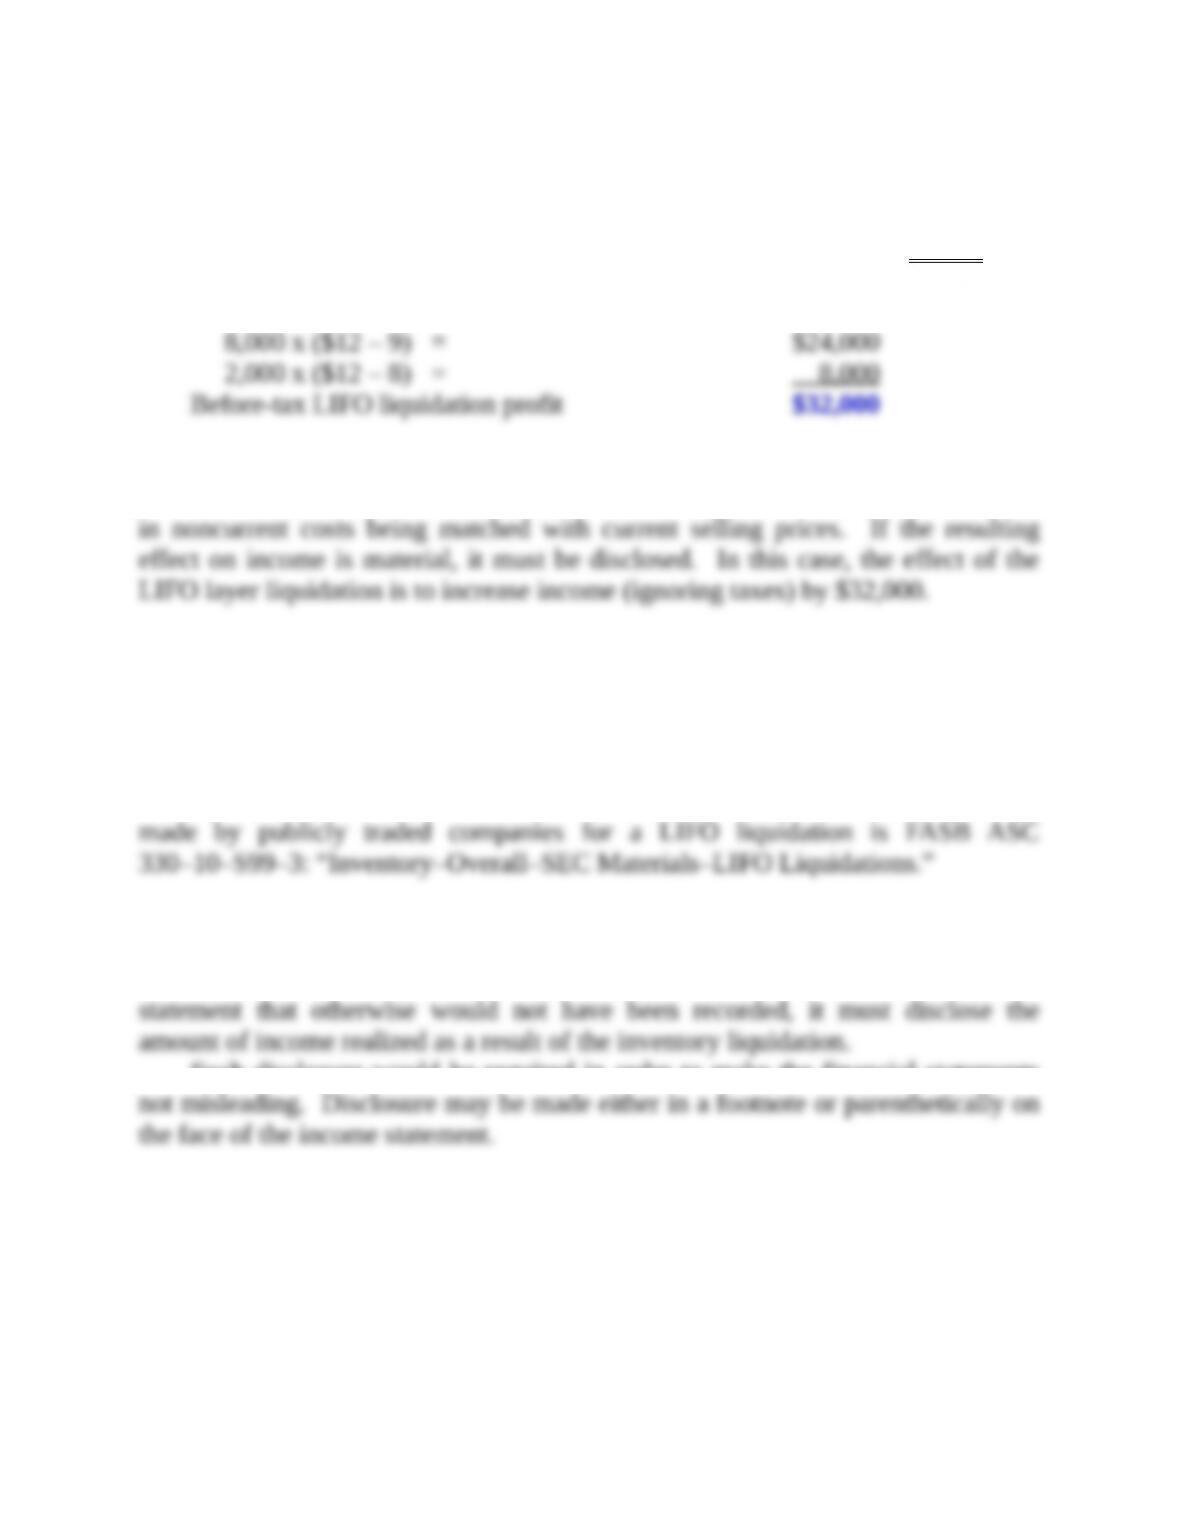
When inventory quantity declines during a reporting period, liquidation of
LIFO inventory layers carried at different costs prevailing in prior year’s results in
Exercise 8–20
Units liquidated 10 ,000
Units liquidated multiplied by the difference between
their current cost and acquisition cost:
When inventory quantity declines during a reporting period, liquidation of
LIFO inventory layers carried at different costs that prevailed in prior year’s results
Exercise 8–21
Requirement 2
The specific citation that describes the disclosure requirements that must be
Requirement 3
When a company using LIFO liquidates a substantial portion of its LIFO
inventory and as a result includes a material amount of income in its income
Such disclosure would be required in order to make the financial statements
Exercise 8–22
($ in millions)
HOME DEPOT LOWE’S
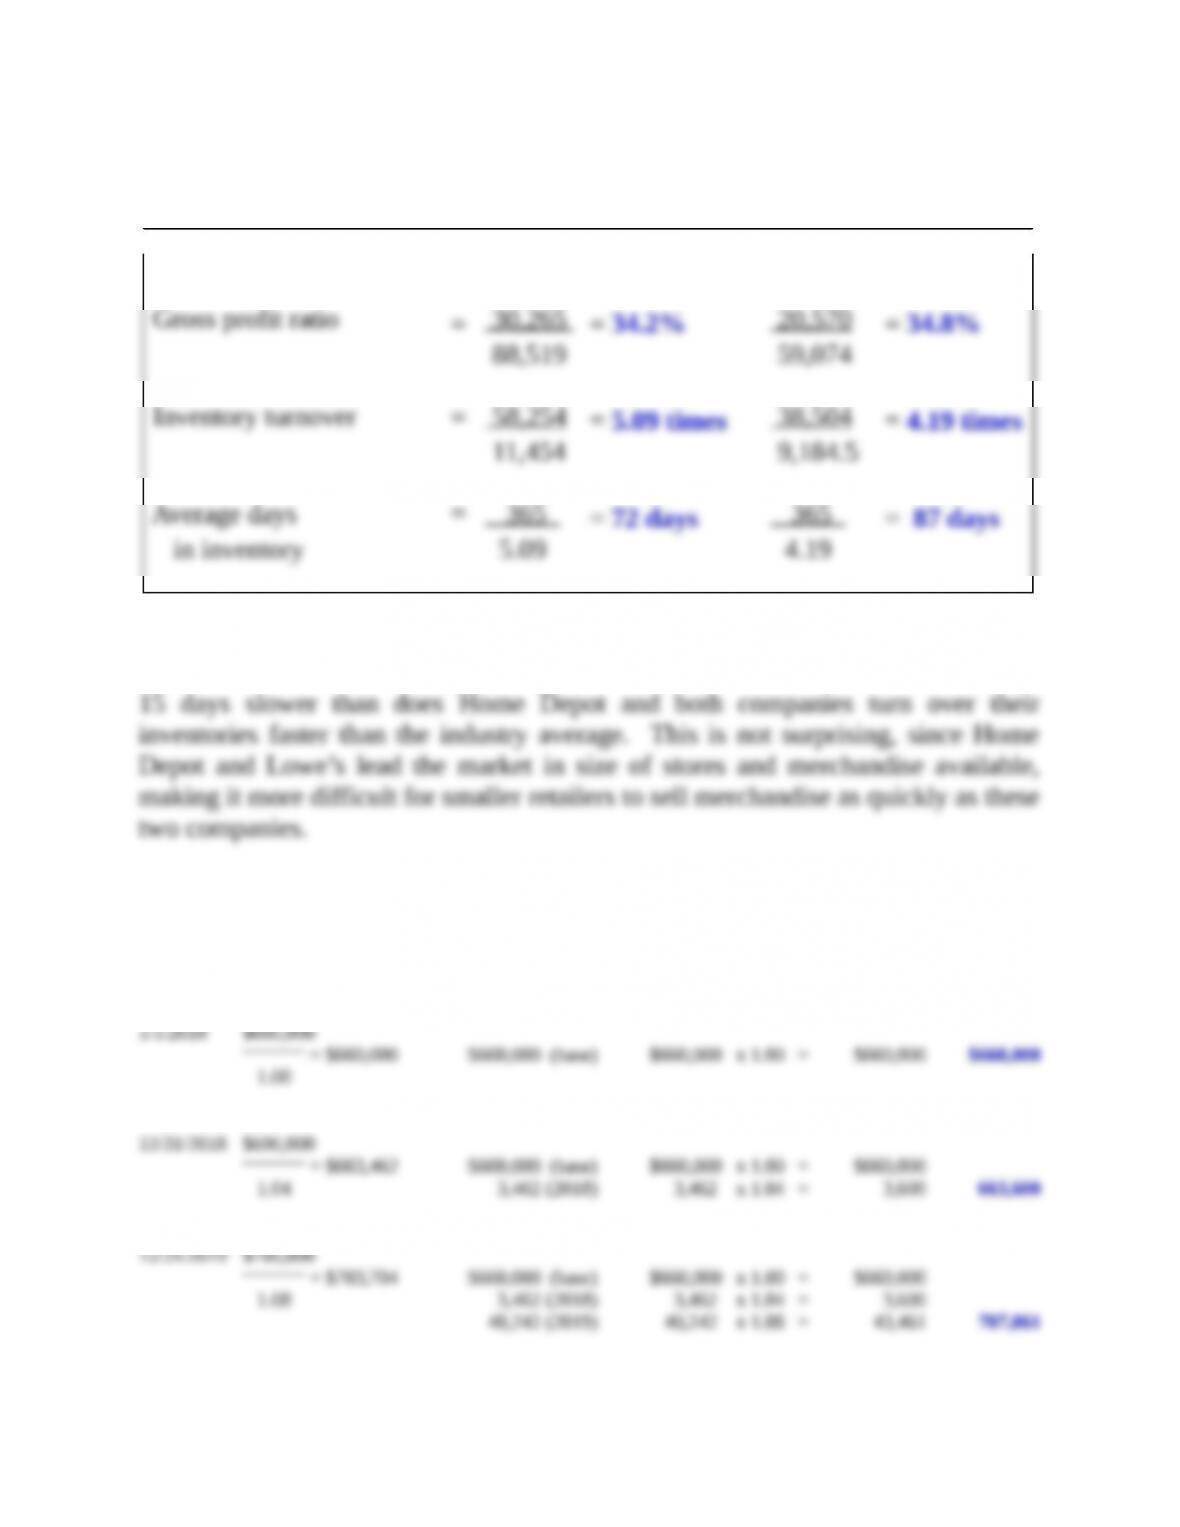
The gross profit ratios for the two companies are similar and both slightly
exceed the industry average of 33%. On average, Lowe’s turns over its inventory
Exercise 8–23
Ending
Ending Inventory Inventory Layers Inventory Layers Inventory
Date at Base Year Cost at Base Year Cost Converted to Cost DVL Cost
1/1/2018 $660,000
12/31/2019 $760,000