Exercise 4–23
The FASB Accounting Standards Codification® represents the single source of
authoritative U.S. generally accepted accounting principles. The specific citation
for each of the following items is:
1. The calculation of the weighted average number of shares for basic
earnings per share purposes:
FASB ASC 260–10–55–2: “Earnings per Share–Overall–Implementation
Guidance and Illustration–Computing a Weighted Average.”
The weighted-average number of shares is an arithmetical mean average of
shares outstanding and assumed to be outstanding for EPS computations.
Exercise 4–23 (continued)
2. The alternative formats permissible for reporting comprehensive income:
FASB ASC 220–10–45–1: “Comprehensive Income–Overall–Other
Presentation Items–Reporting Comprehensive Income.”
1A. An entity reporting comprehensive income in a single continuous
financial statement shall present its components in two sections, net income
and other comprehensive income. If applicable, an entity shall present the
following in that financial statement:
a. A total amount for net income together with the components that make
up net income.
b. A total amount for other comprehensive income together with the
1B. An entity reporting comprehensive income in two separate but
consecutive statements shall present the following:
a. Components of and the total for net income in the statement of net
income
b. Components of and the total for other comprehensive income as well as a
1C. An entity shall present, either in a single continuous statement of
comprehensive income or in a statement of net income and statement of


Exercise 4–23 (concluded)
3. The classifications of cash flows required in the statement of cash flows:
FASB ASC 230–10–45–1: “Statement of Cash Flows–Overall–Other
Presentation Matters–Form and Content.”
Exercise 4–24
List A List B
f 1. Intraperiod tax allocation a. An other comprehensive income item.
g 2. Comprehensive income b. Starts with net income and works
backwards to convert to cash.
Exercise 4–25

Requirement 1
Inventory turnover ratio = Cost of goods sold
Average inventory
Requirement 2
By itself, this one ratio provides very little information. In general, the higher
the inventory turnover, the lower the investment must be for a given level of sales.
However, to evaluate the adequacy of this ratio it should be compared with
It’s just one piece in the puzzle, though. Other points of reference should be
The ratio also can be useful when assessing the current ratio. The more liquid
Exercise 4–26
Requirement 1
Turnover ratios for Anderson Medical Supply Company for 2018:
Inventory turnover ratio = $4,800,000
Requirement 2
The company turns its inventory over 6 times per year compared to the
industry average of 5 times per year. The asset turnover ratio also is slightly better
Exercise 4–27

Requirement 1
a. Profit margin on sales $180 ÷ $5,200 = 3.5%

Requirement 2
Retained earnings beginning of period $100,000
Add: Net income 180 ,000
Exercise 4–28

Requirement 1
a. Profit margin on sales $180 ÷ $5,200 = 3.46%

Requirement 2

Exercise 4–29
Quarter
First Second Third
Cumulative income before taxes $50,000 $90,000 $190,000
Estimated annual effective tax rate 34% 30% 36%

Exercise 4–30
Incentive compensation $300 million ÷ 4 = $75 million
Exercise 4–31
Quarters Ending
March 31 June 30 Sept. 30 Dec. 31
Advertising $200,000 $200,000 $200,000 $200,000
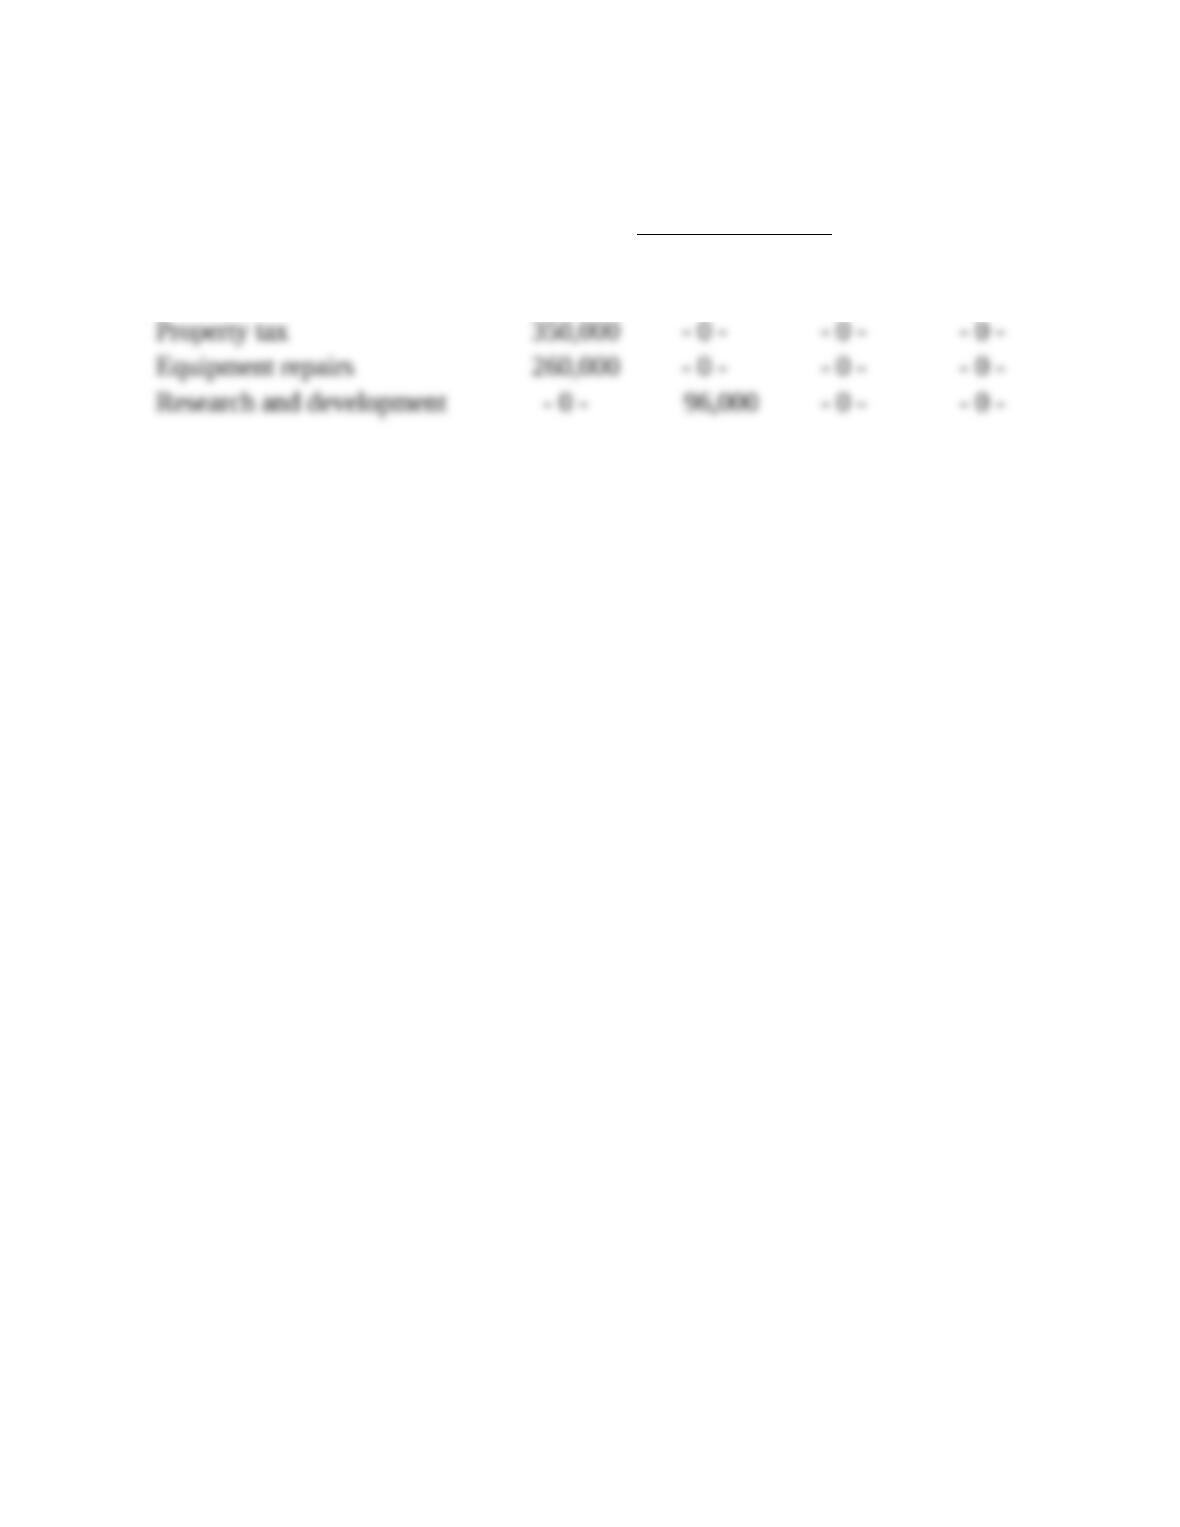
Note: this solution assumes that advertising, property tax, and equipment repairs
Exercise 4–32
Quarters Ending
March 31 June 30 Sept. 30 Dec. 31
Advertising $800,000 $ – 0 – $ – 0 – $ – 0 –