Solutions to Chapter 4
Measuring Corporate Performance
1.
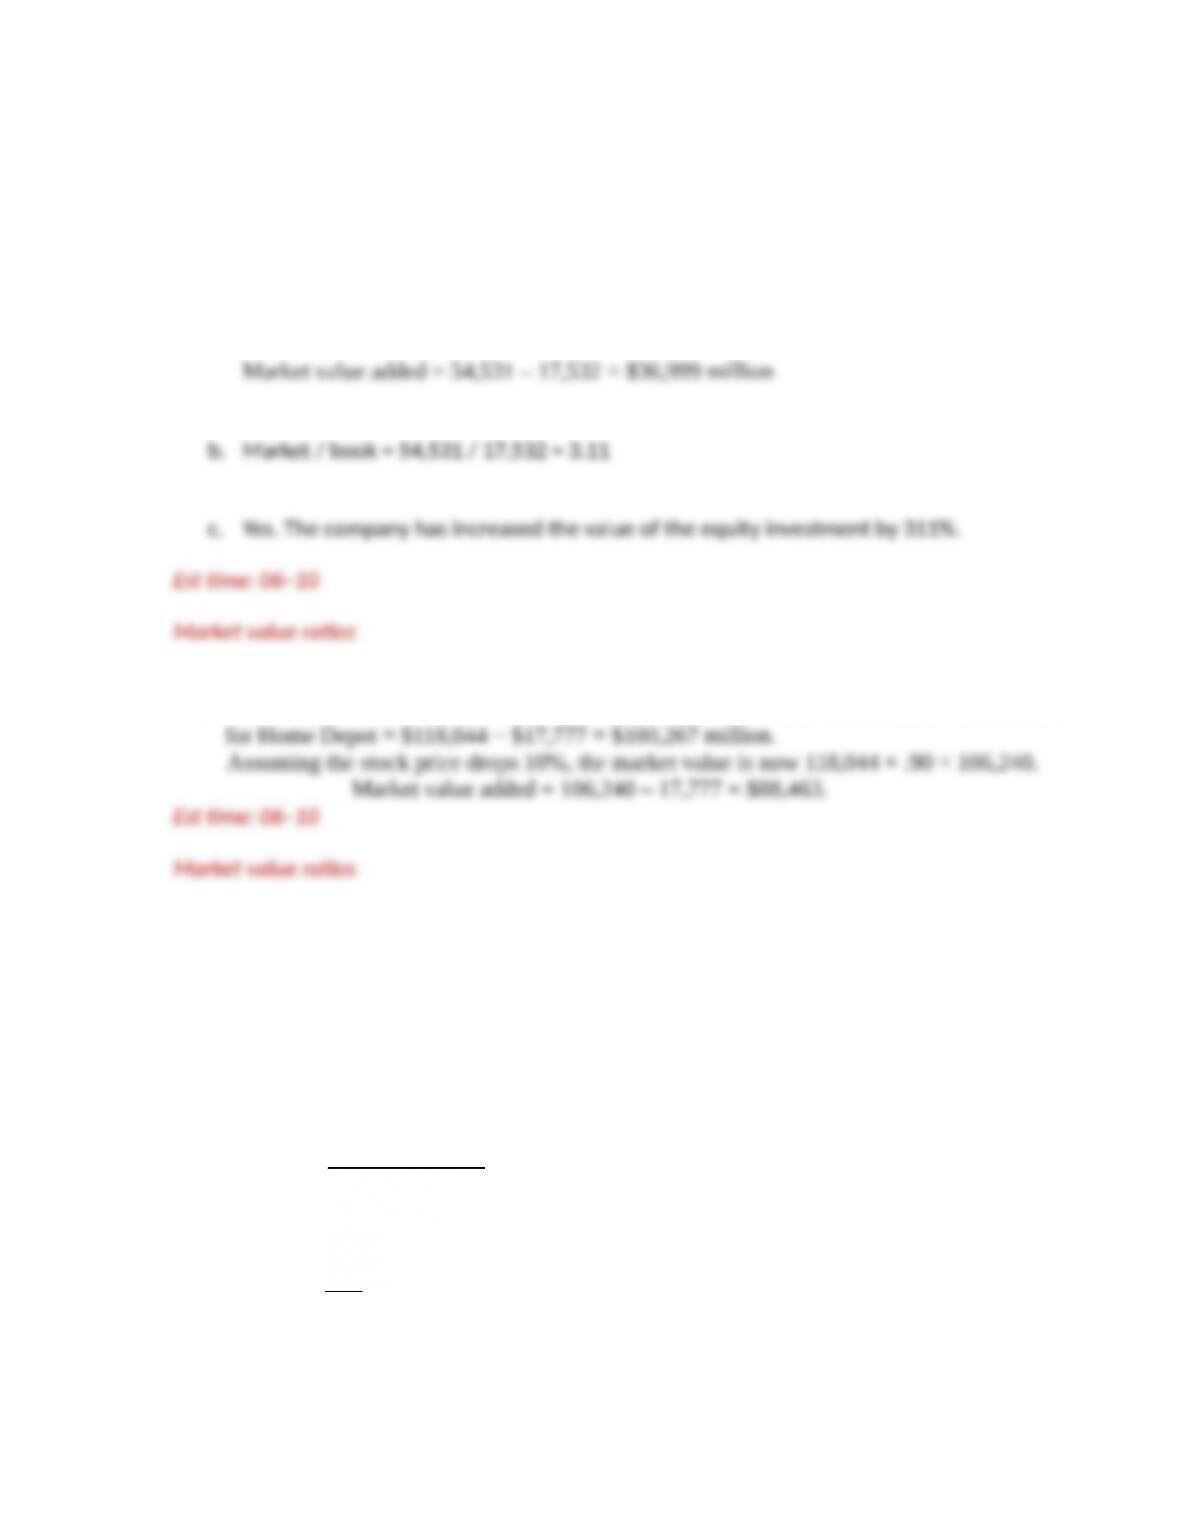
a. Market value = 657 mil × $83 = $54,531 million
2. The market value = 1.754 million × $67.30 = $118,044 million. The market value added
3.
a EVA = a,er-tax interest + net income – (cost of capital × total capitaliza2on)
.085 ×
[
256+121
]
=38.76
EVA=
(
1−.35
)
×12+63−¿
b
ROC=
(
1−.35
)
×12+63
256+121 =.1878
c
ROE=63
256 =.2461
4-.
Copyright © 2018 McGraw-Hill Education. All rights reserved. No reproduction or distribution without the prior written consent of McGraw-Hill
Education.
d Yes. The EVA indicates the firm is producing value in excess of the cost of capital.
4. EVA = after-tax interest + net income – (cost of capital × total capitalization)
EVA =
(
1−.35
)
×830+6,345−
(
.10 ×27,213
)
=$4,163.20
Est time: 06–10
Market value ratios
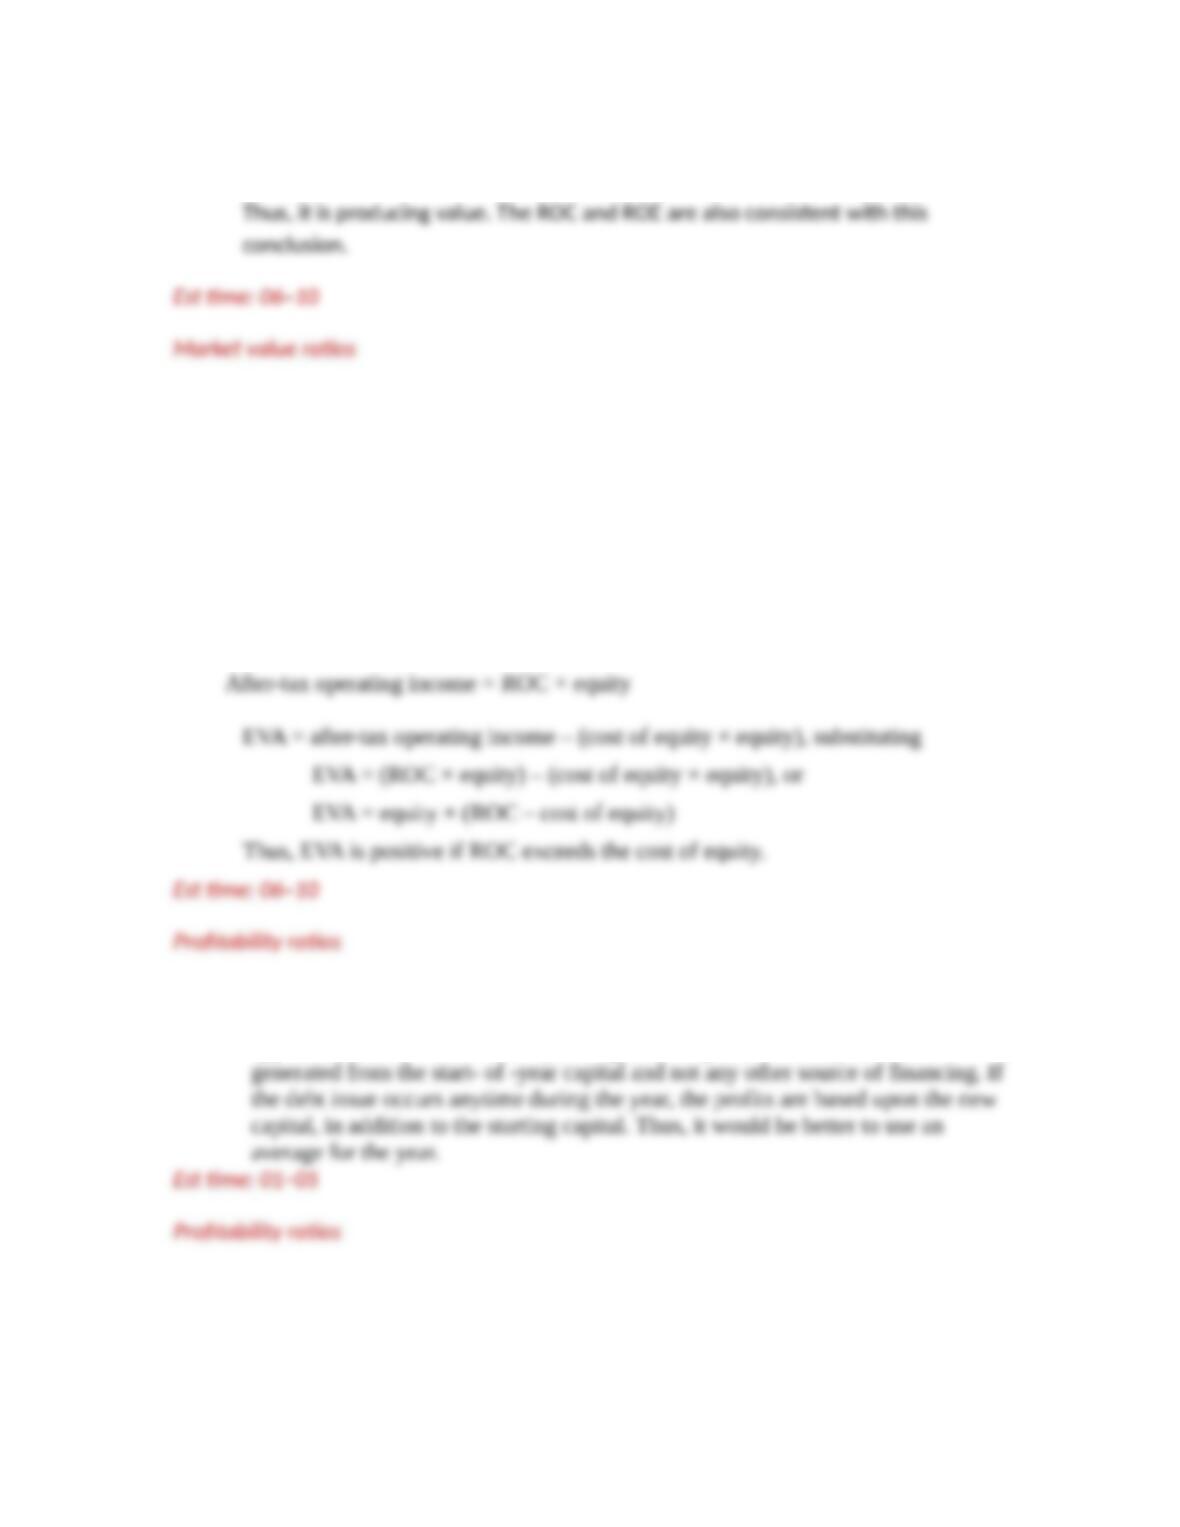
5. ROC = after-tax operating income/equity, or
6. Since Microlimp does not raise any new money during the year, the proper
approach is to use the start- of- year capital. The profits for the year were
7.
4-.
Copyright © 2018 McGraw-Hill Education. All rights reserved. No reproduction or distribution without the prior written consent of McGraw-Hill
Education.

a Return on equity
%13129796.0
2/)121,9724,9(
223,1
d. Return on assets
%04.60604.0
2/)503,27714,27(
)35.1(685223,1
e. Return on capital
=1, 223+685´(1–.35)
[(7, 018 +9, 724) +(6,833+9,121)] / 2 =0.1020 =10.20%
f. Days sales in inventory
=238
4, 060 / 365 =21.40 days
g. Inventory turnover
11.19
2/)238187(
060,4
h. Average collection period
=2, 490
13,193 / 365 =68.89 days
i. operating profit margin
%64.121264.0
193,13
)35.1(685223,1
j. Long-term debt ratio
42.0
724,9018,7
018,7
4-.
Copyright © 2018 McGraw-Hill Education. All rights reserved. No reproduction or distribution without the prior written consent of McGraw-Hill
Education.
k. Total debt ratio
65.0
714,27
178,6018,7794,4
l. Times interest earned
75.3
685
566,2
m. Cash coverage ratio
42.7
685
518,2566,2
n. Current ratio
74.0
794,4
525,3
o. Quick ratio
52.0
794,4
382,289
8.
a Debt / equity = 410/190 = 2.58
4-.
Copyright © 2018 McGraw-Hill Education. All rights reserved. No reproduction or distribution without the prior written consent of McGraw-Hill
Education.
9. Average collection period equals receivables divided by average daily sales:
Average collection period
days 236
365/800,9
333,6
Est time: 01–05
Short-term solvency ratios
10. Days sales in inventories
days 2
365/000,73
400
Est time: 01–05
Short-term solvency ratios
11. EBIT = revenues – COGS – depreciation
= $3,000,000 – $2,500,000 – $200,000 = $300,000
12.
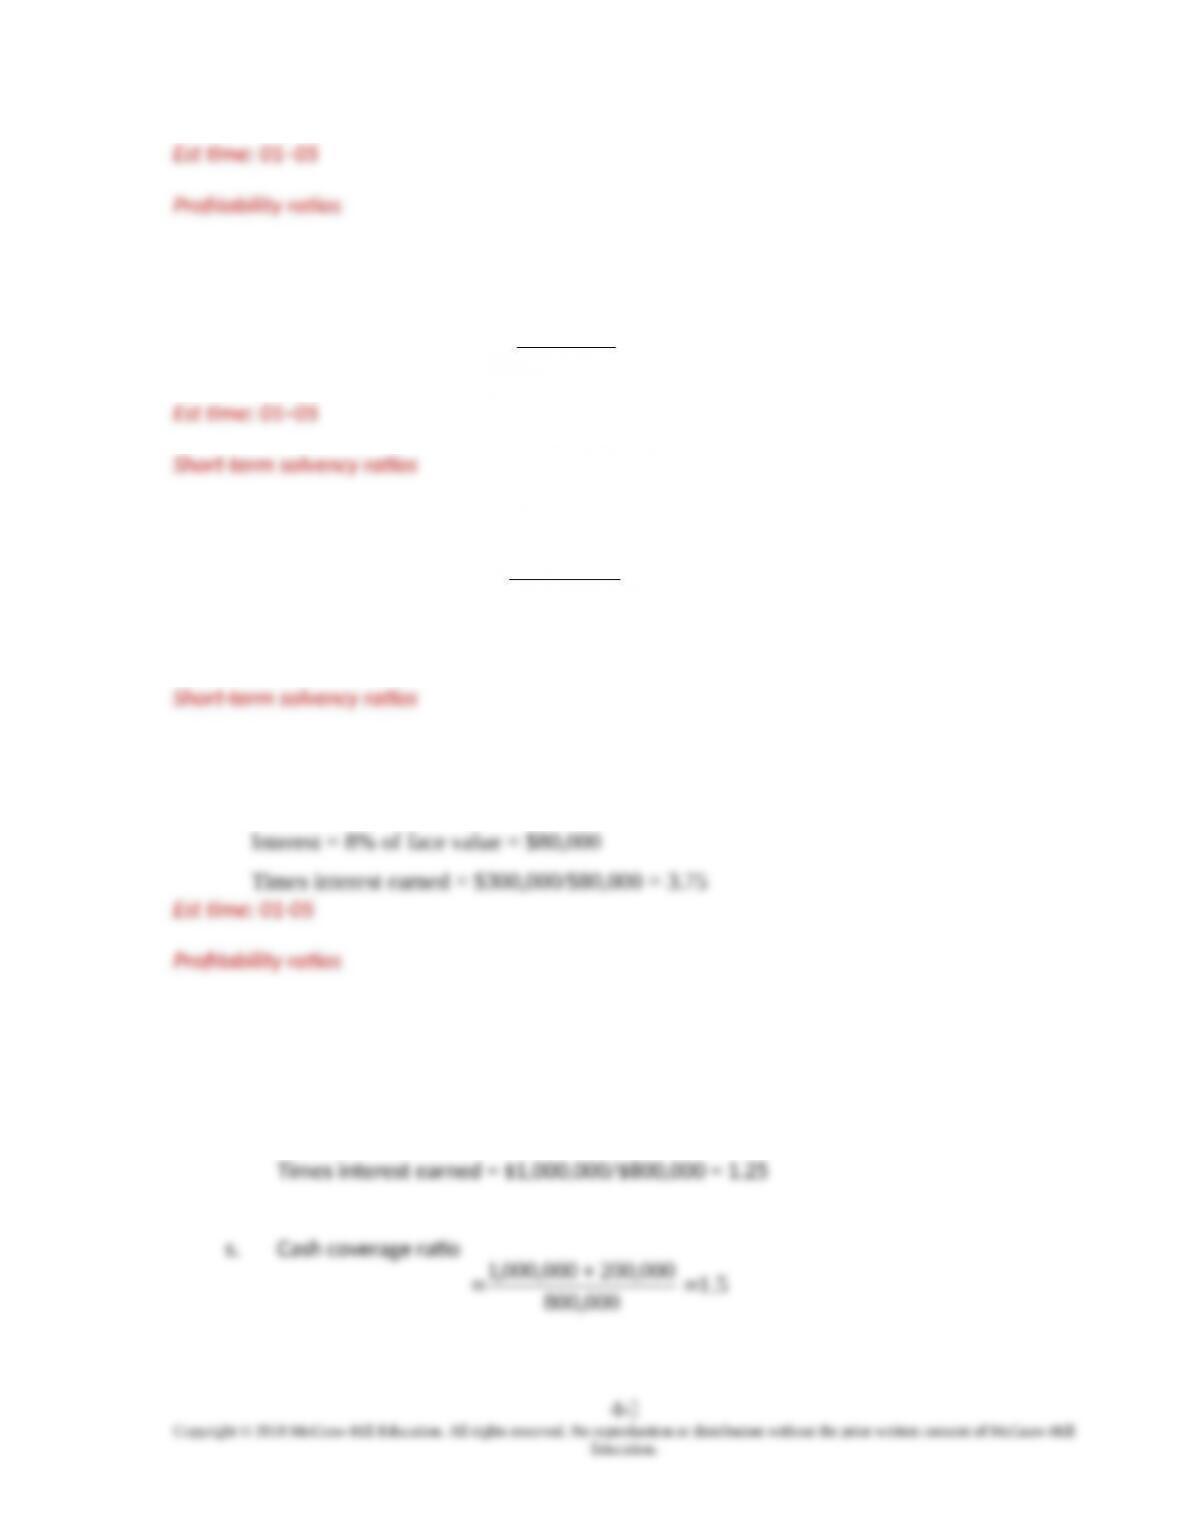
a Interest expense = 0.08 $10 million = $800,000
13.
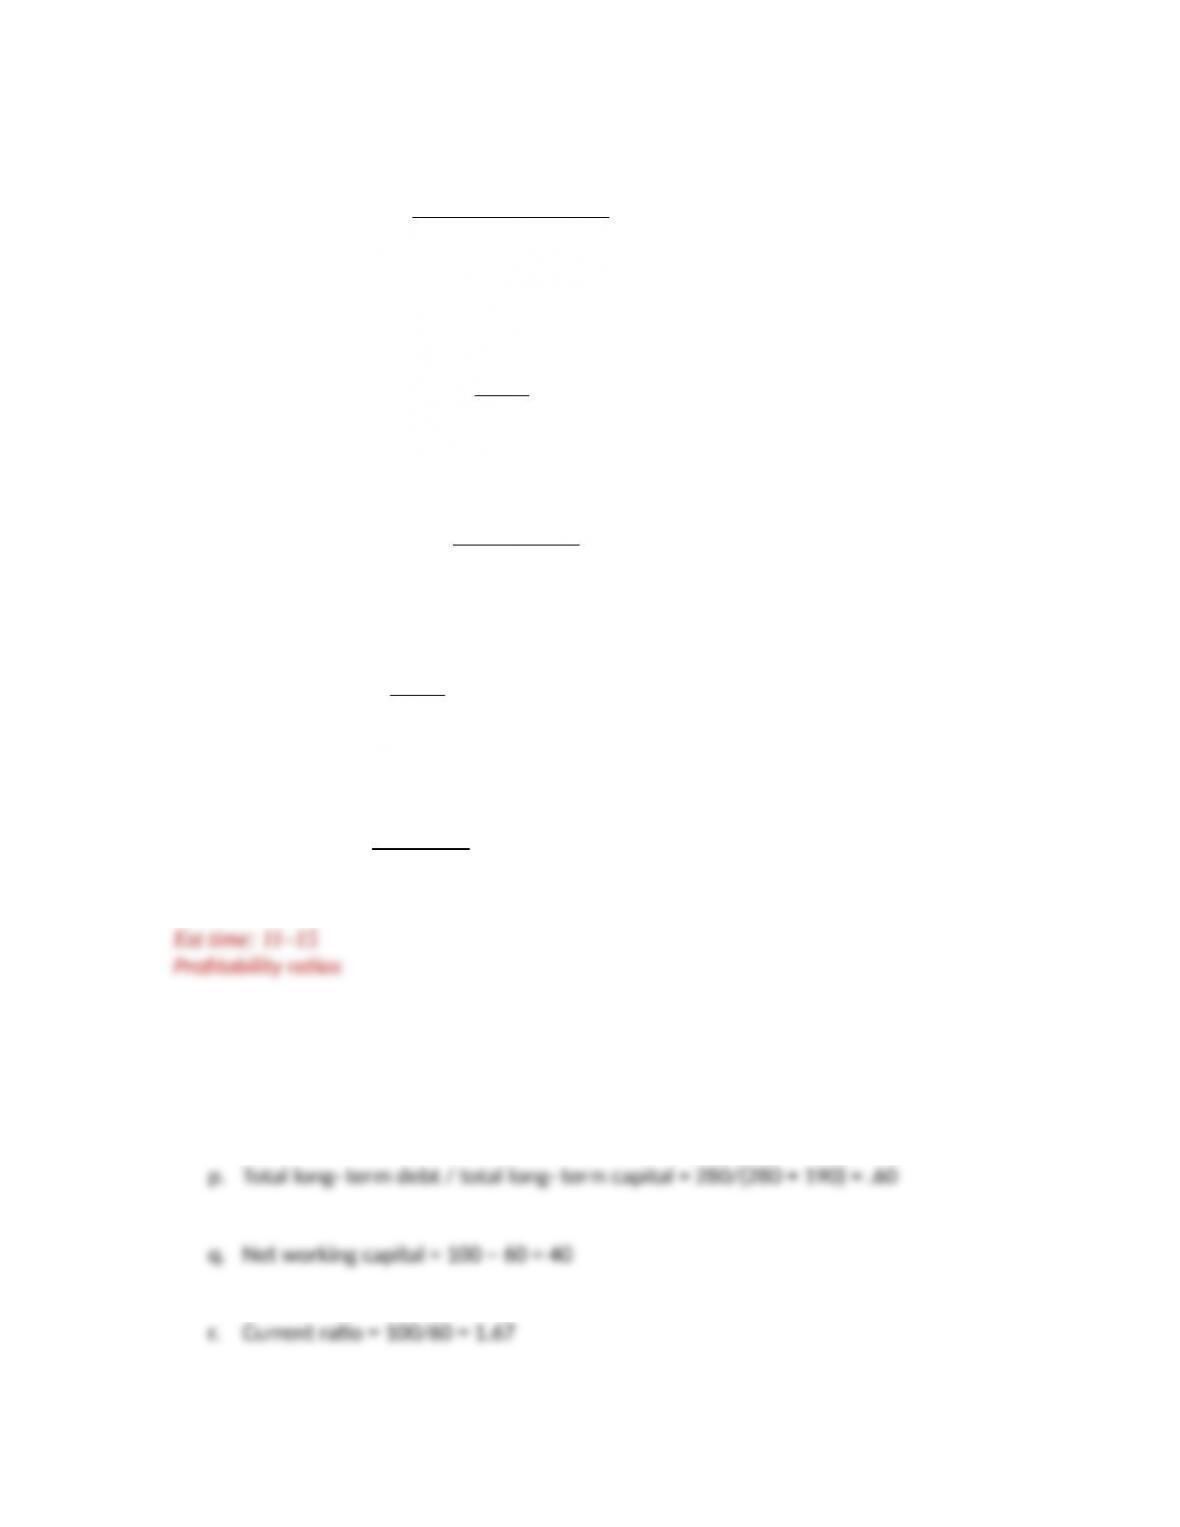
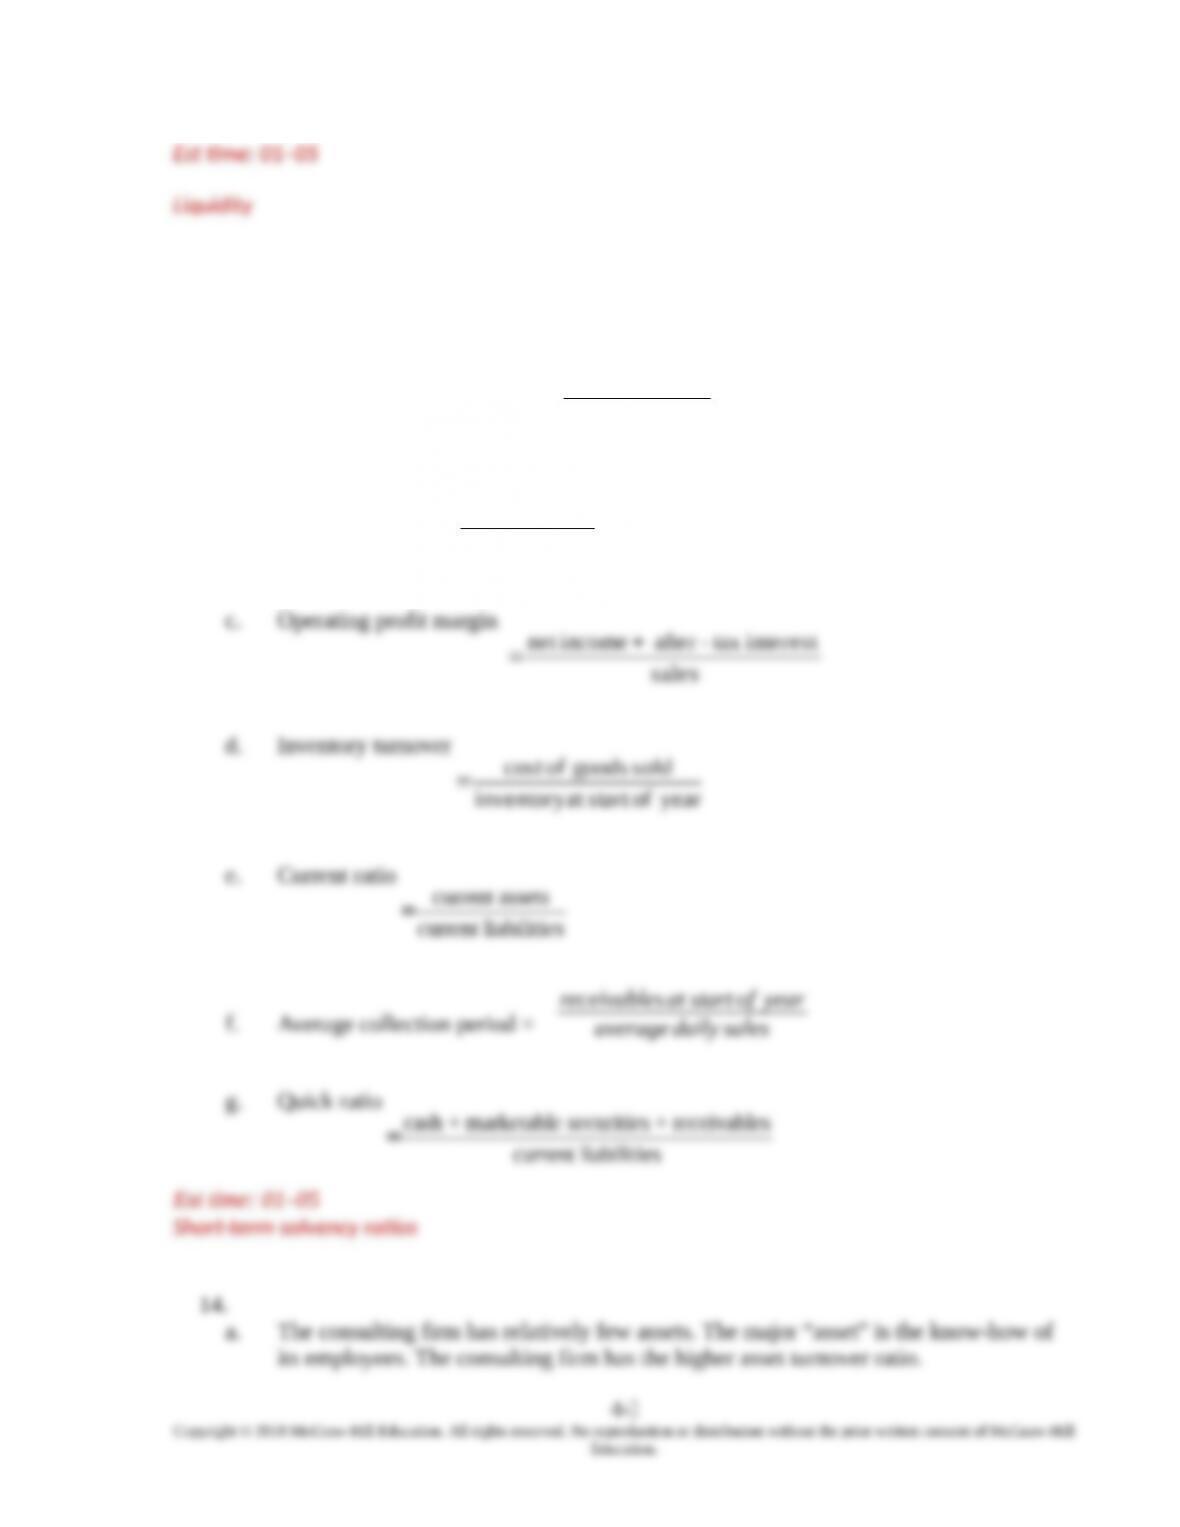
a. Long-term debt-equity ratio
equity
debt term–long
b. Return on equity
equity average
incomenet
c. Operating profit margin
sales
interesttax –after incomenet
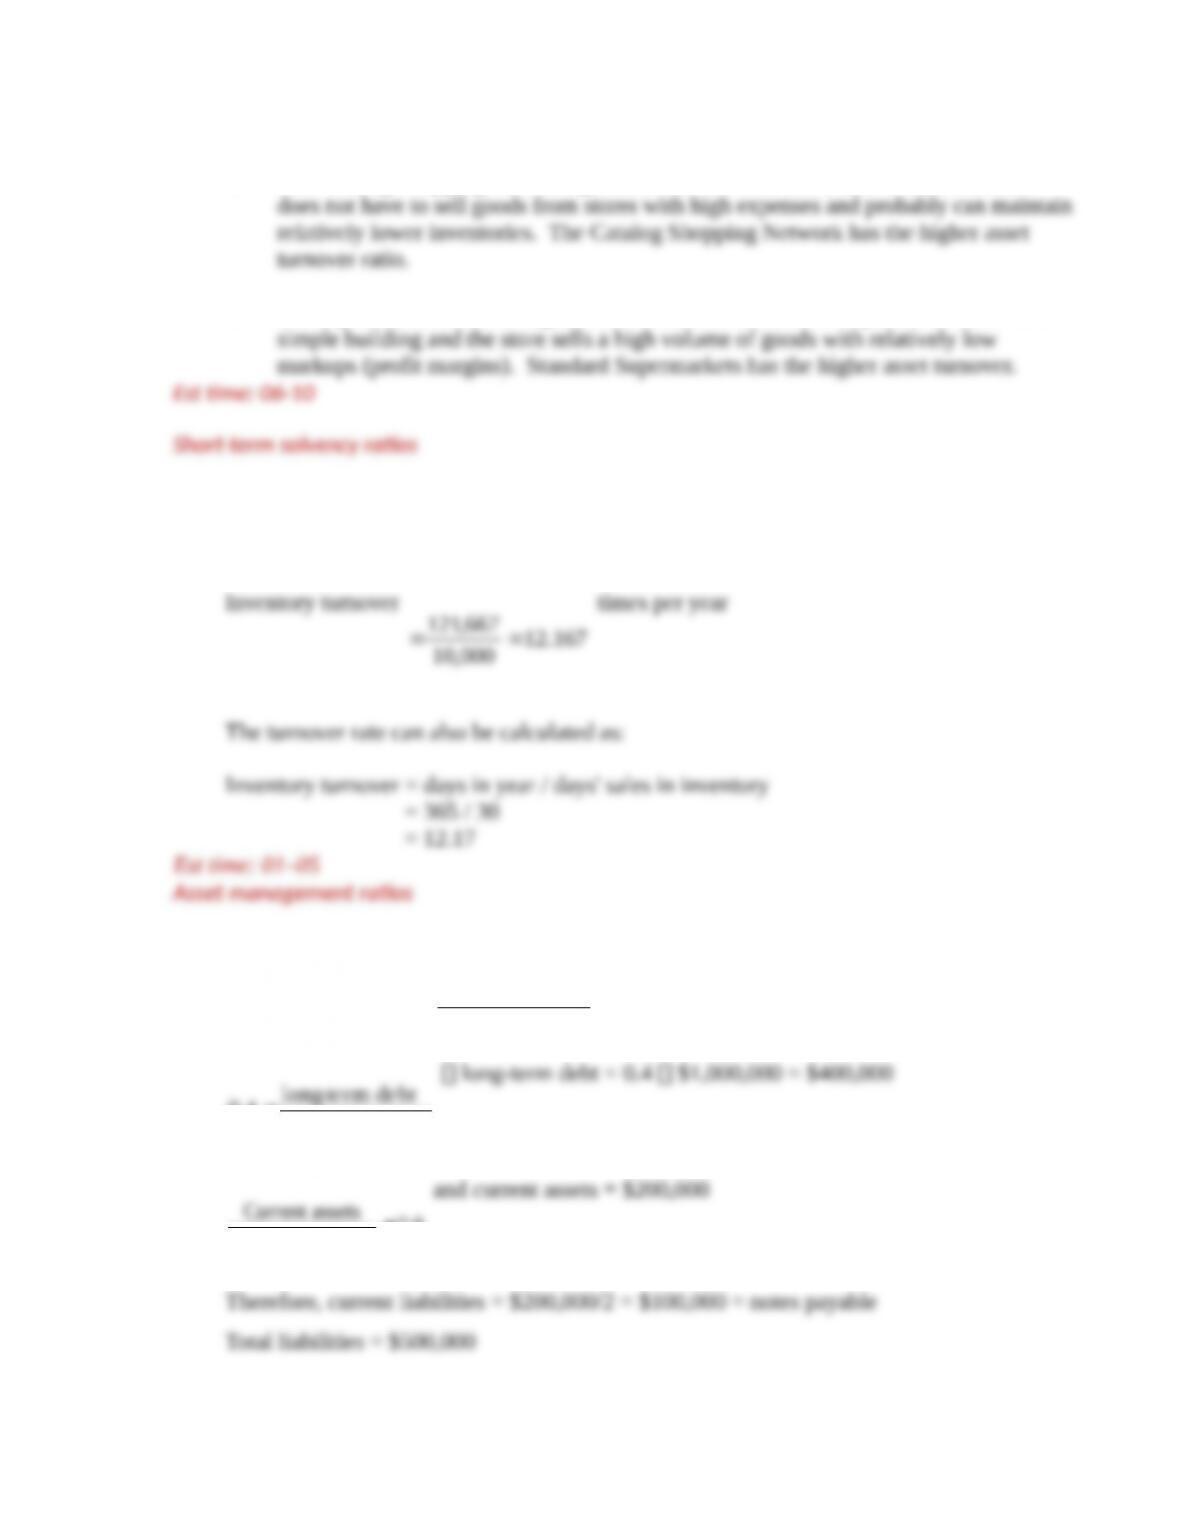
b. The Catalog Shopping Network generates far more sales relative to assets since it
c. The supermarket has a far higher ratio of sales to assets. The supermarket itself is a
15. Annual cost of goods sold = $10,000 365/30 = $121,667
16. Debt-equity ratio
equity
debt term-long
000,000,1$
debt term-long
4.0
long-term debt = 0.4 $1,000,000 = $400,000
Current assets 2.0
Current liabilities =
and current assets = $200,000
Therefore, current liabilities = $200,000/2 = $100,000 = notes payable
Total liabilities = $500,000
4-.
Copyright © 2018 McGraw-Hill Education. All rights reserved. No reproduction or distribution without the prior written consent of McGraw-Hill
Education.
17.
5.0
equityBook
debtBook
2
equityBook
equityMarket
25.0
2
5.0
equityMarket
debtBook
Est time: 01–05
Market and book values
18. The current ratio will be unaffected. Inventories replace cash, but total current
19.
a. No change: Inventory is a current asset as is the proceeds from a sale of
b. Increase: A new bank loan is an increase in a long- term liability. In this
c. No change: Unless used, the existence of a line of credit does not impact
4-.
Copyright © 2018 McGraw-Hill Education. All rights reserved. No reproduction or distribution without the prior written consent of McGraw-Hill
Education.
e. No change: Cash and inventory are both current assets. Thus, trading one
20.
a. False: A number below 1, implies debt is less than equity and that may
b. False: For example, if a firm only has cash, marketable securities, and
c. False: The ROE uses net income, while the ROA uses after-tax operating
21.
a. The shipping company, which has more tangible assets, will tend to have the higher
b. United Foods is in a more mature industry and probably has fewer favorable
c. The paper mill will have higher sales per dollar of assets. It is less capital-intensive
d. The discount outlet sells many of its goods for cash. The power company bills
4-.
Copyright © 2018 McGraw-Hill Education. All rights reserved. No reproduction or distribution without the prior written consent of McGraw-Hill
Education.
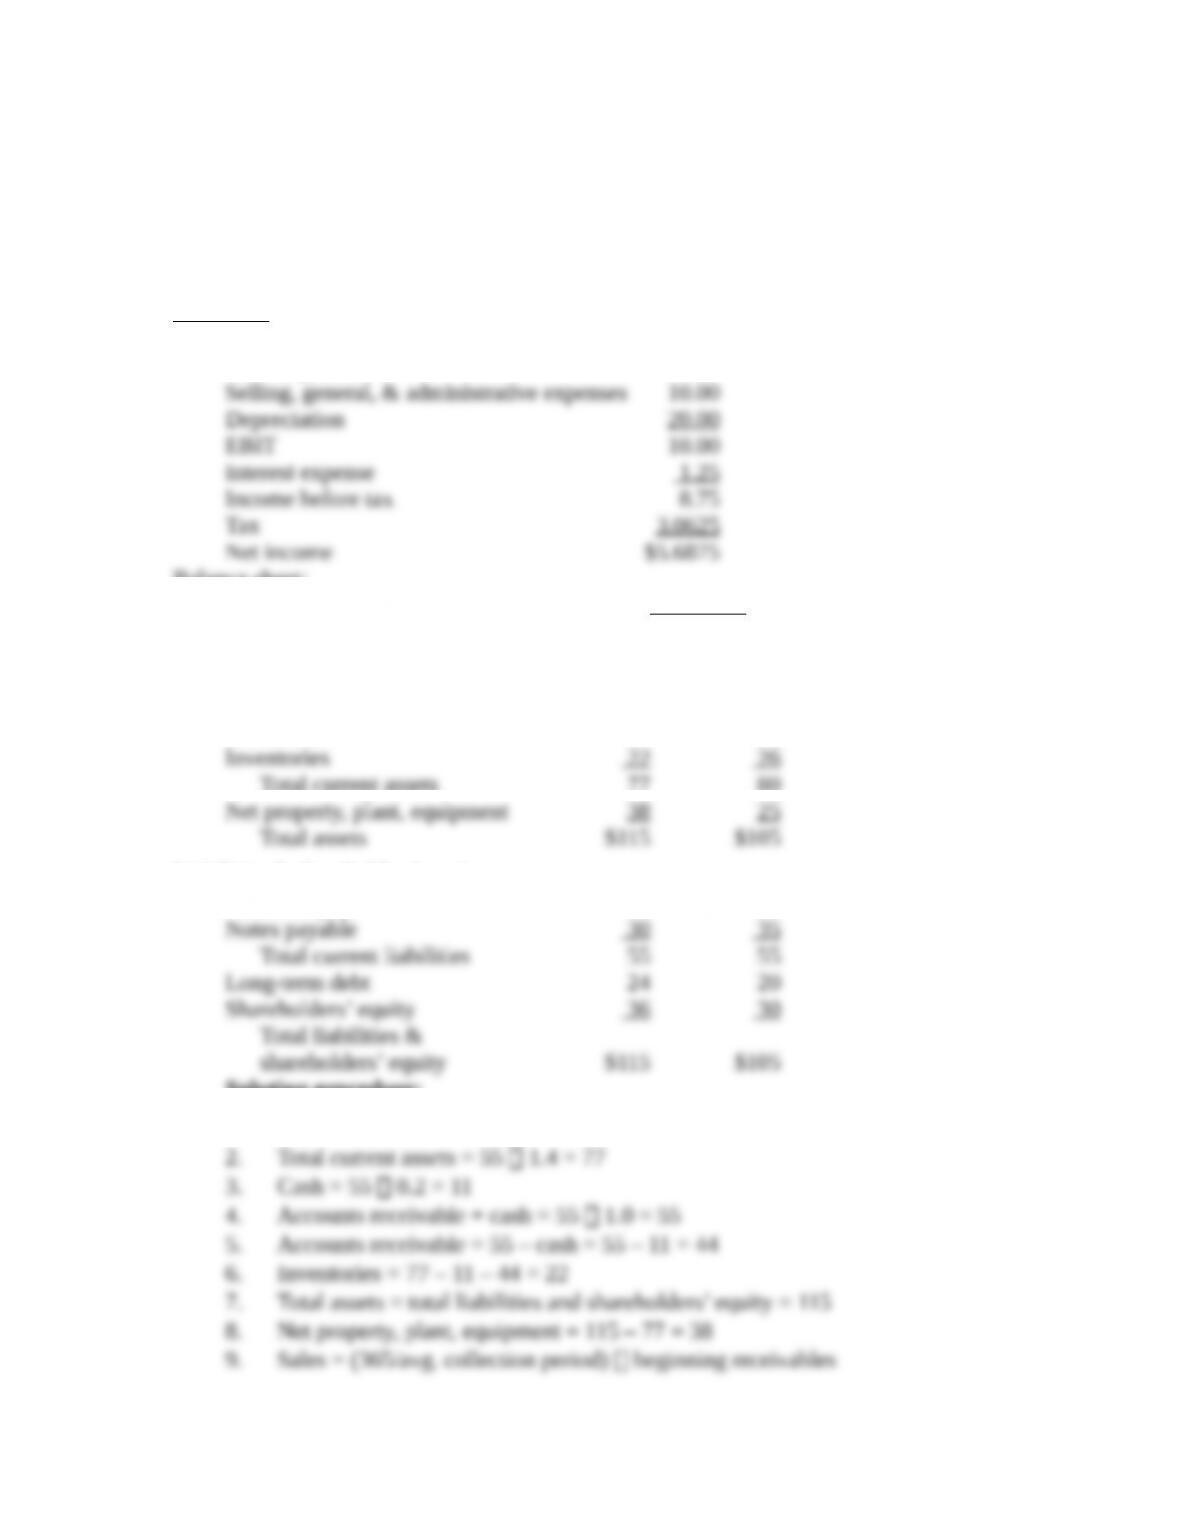
22.
Income statement:
$ Millions
Net sales $170.00
Cost of goods sold 130.00
Balance sheet:
$ Millions
This Year Last Year
Assets
Cash and marketable securities $ 11 $ 20
Receivables 44 34
Total current assets 77 80
Liabilities & shareholders’ equity
Accounts payable $ 25 $ 20
Solution procedure:
1. Total current liabilities = 25 + 30 = 55
4-.
Copyright © 2018 McGraw-Hill Education. All rights reserved. No reproduction or distribution without the prior written consent of McGraw-Hill
Education.
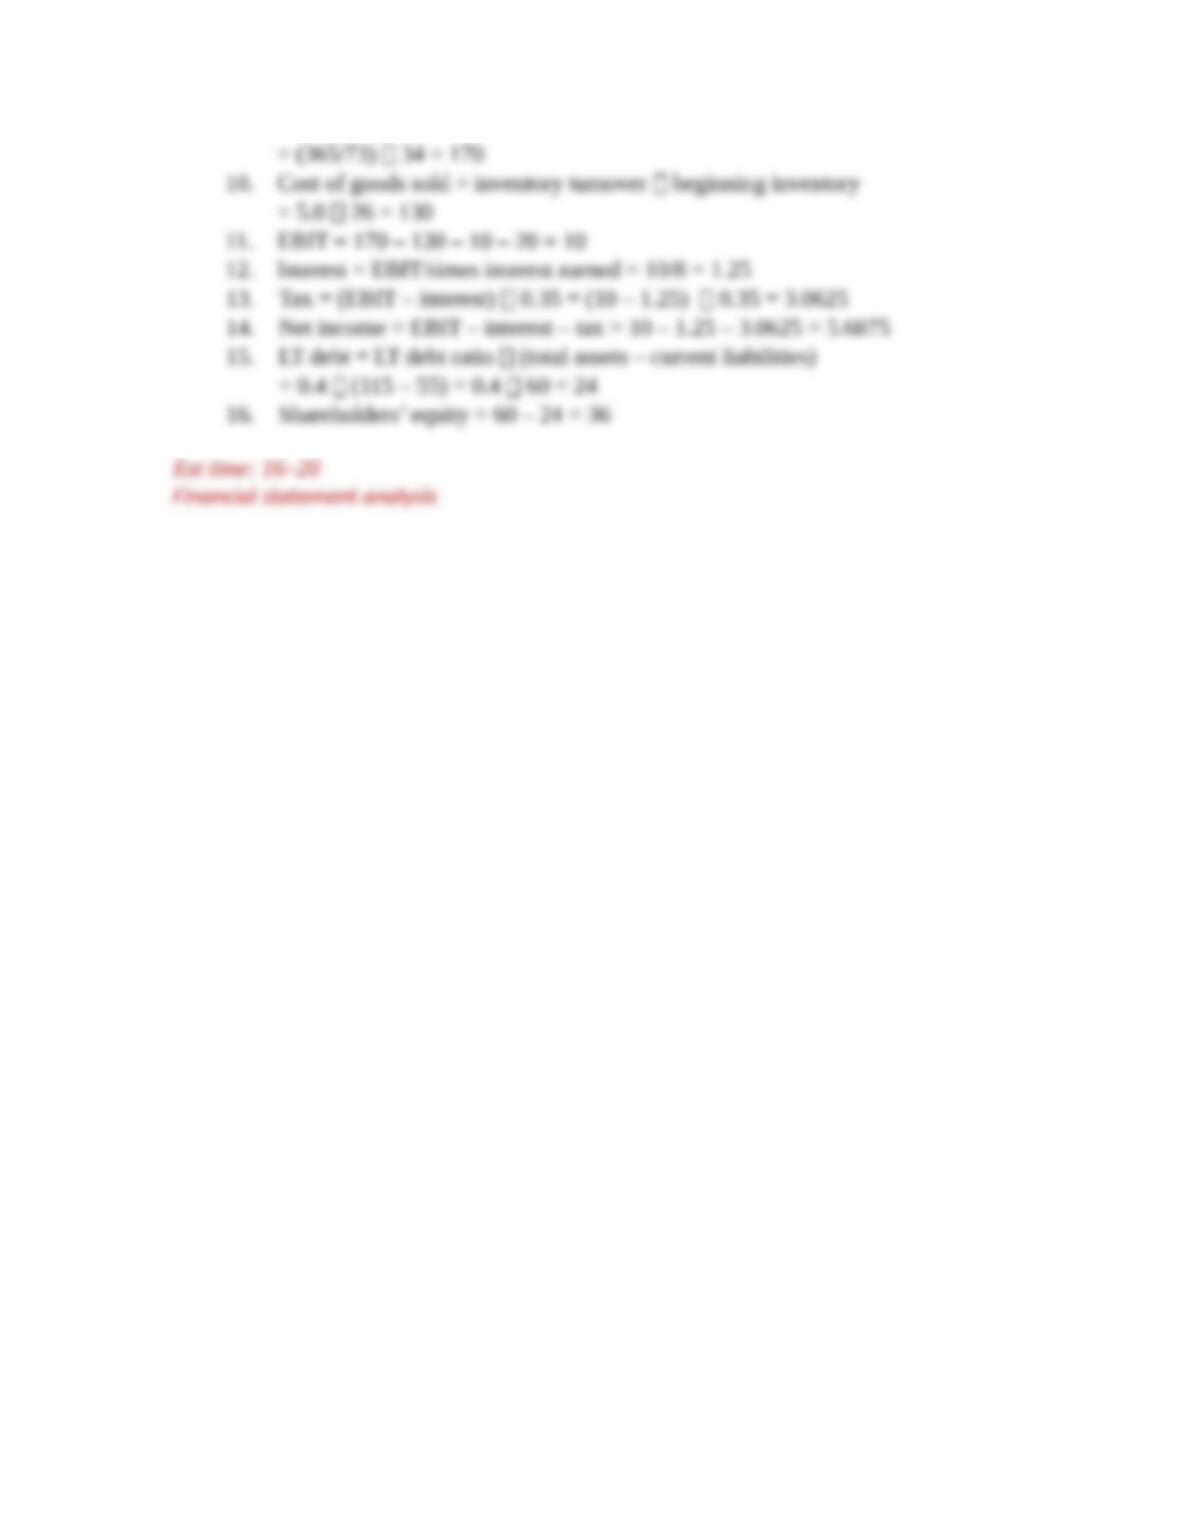
23. a. See table and graph below.
profit
Margin (%)
Asset
Turnover
All manufacturing 7.17 0.76
Food products 7.39 1.13
Retail trade 5.53 2.14
Publishing 15.96 0.41
Chemicals 10.31 0.46
pharmaceutical 13.31 0.36
Machinery 7.63 0.81
Electrical 8.78 0.55
Motor vehicles 4.82 1.24
Computer and electronic 12.64 0.51
4-.
Copyright © 2018 McGraw-Hill Education. All rights reserved. No reproduction or distribution without the prior written consent of McGraw-Hill
Education.
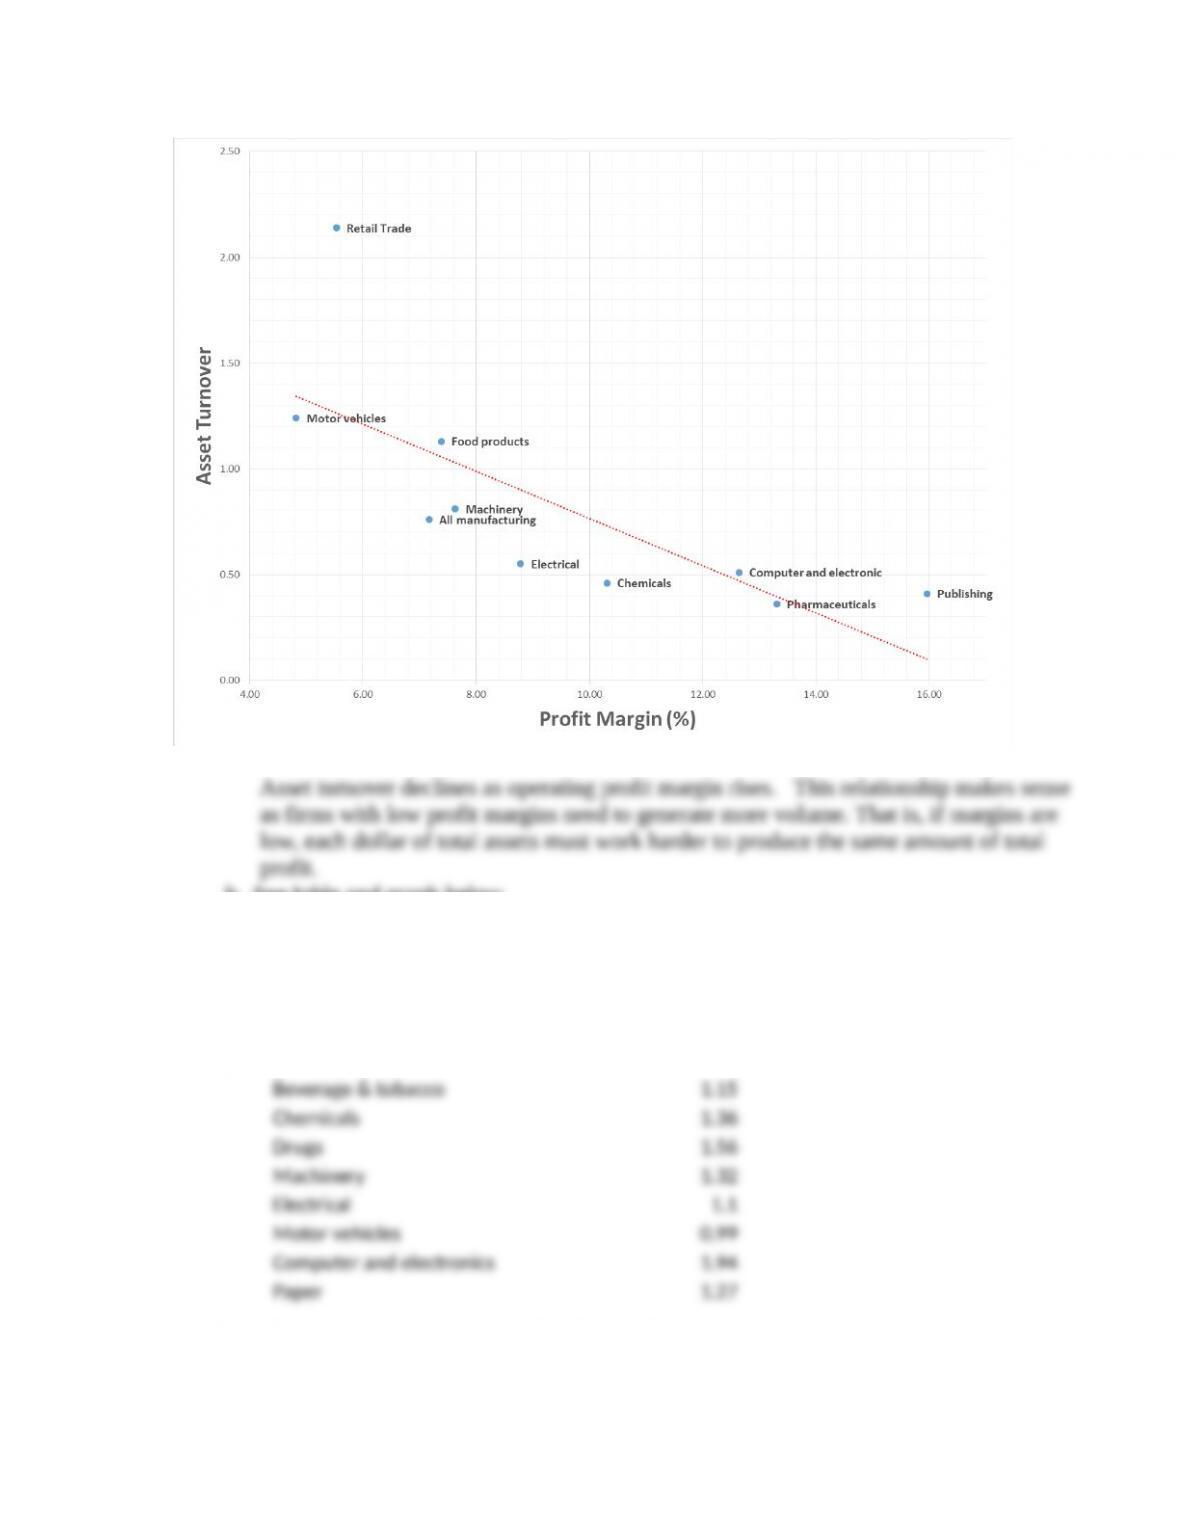
b. See table and graph below
Current ratio Quick ratio
All manufacturing 1.43
Food products 1.4
Clothing 1.39
4-.
Copyright © 2018 McGraw-Hill Education. All rights reserved. No reproduction or distribution without the prior written consent of McGraw-Hill
Education.
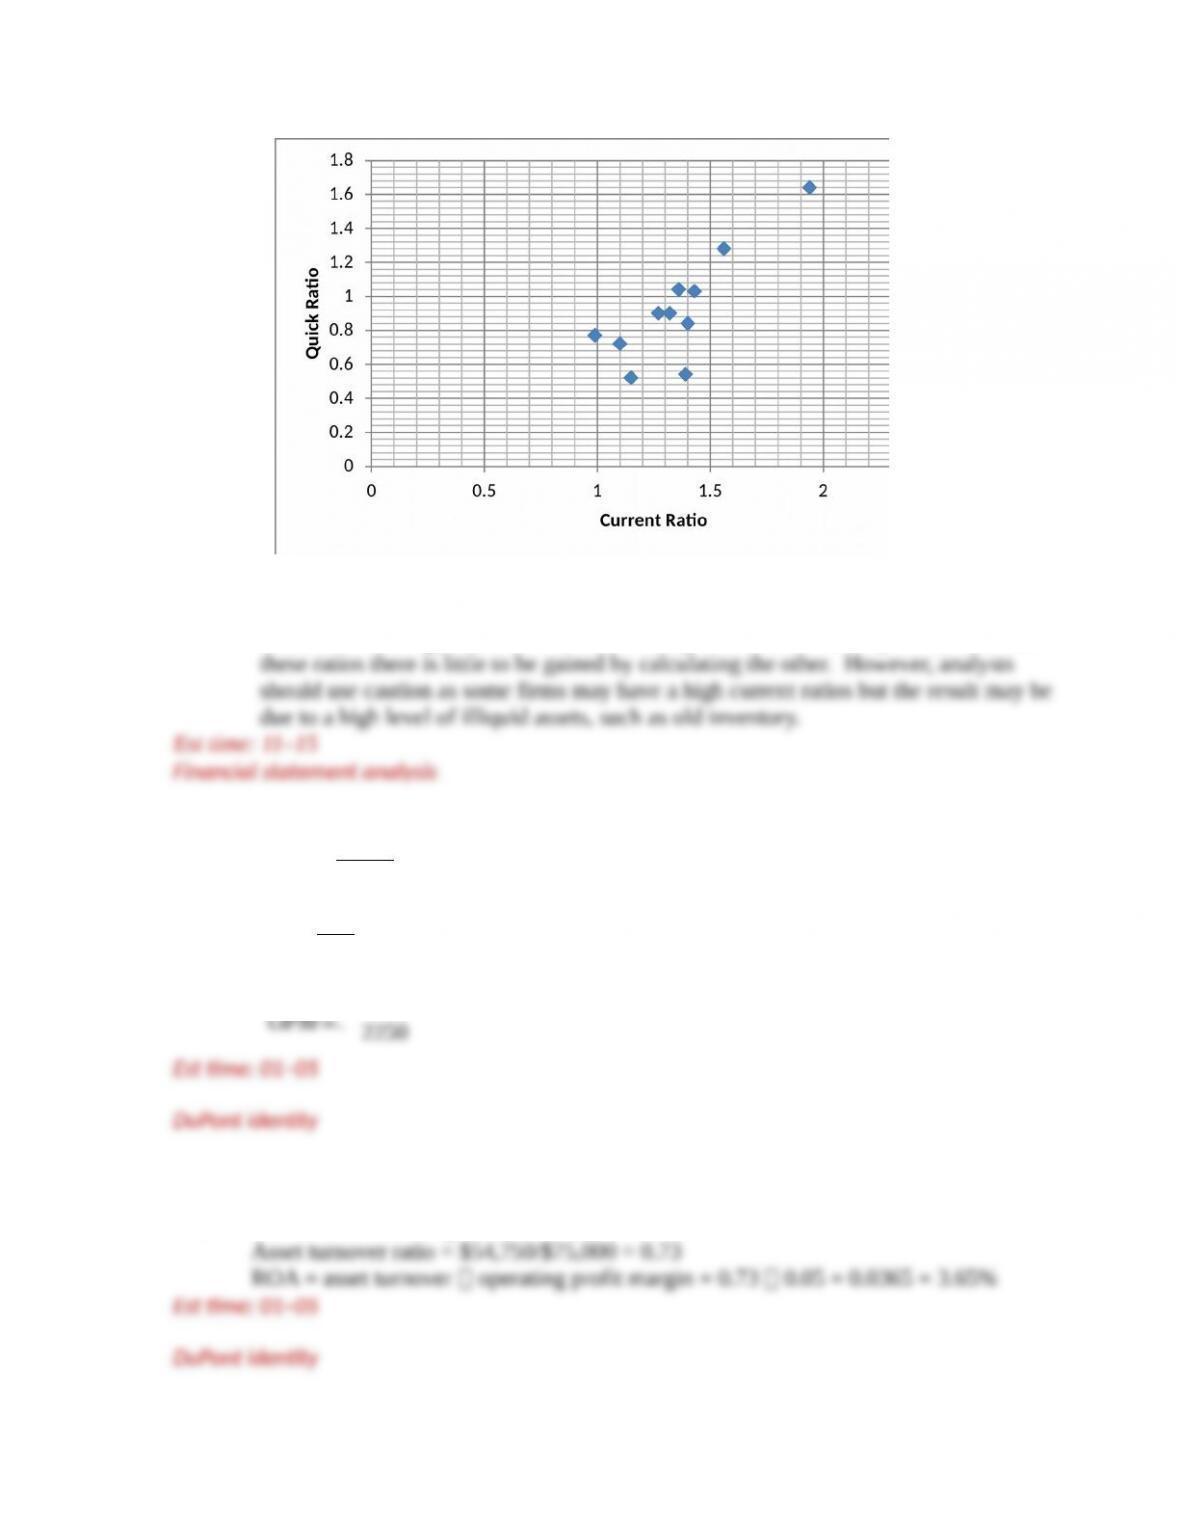
These two measures of liquidity appear to move together. Higher quick ratios are
associated with higher current ratios. You may conclude that once you know one of
24.
ROA=sales
assets ×
(
operating profit margin
)
.15=100
150 × OPM
OPM=.
2250
Est time: 01–05
DuPont identity
25. Total sales = $3,000 365/20 = $54,750
4-.
Copyright © 2018 McGraw-Hill Education. All rights reserved. No reproduction or distribution without the prior written consent of McGraw-Hill
Education.
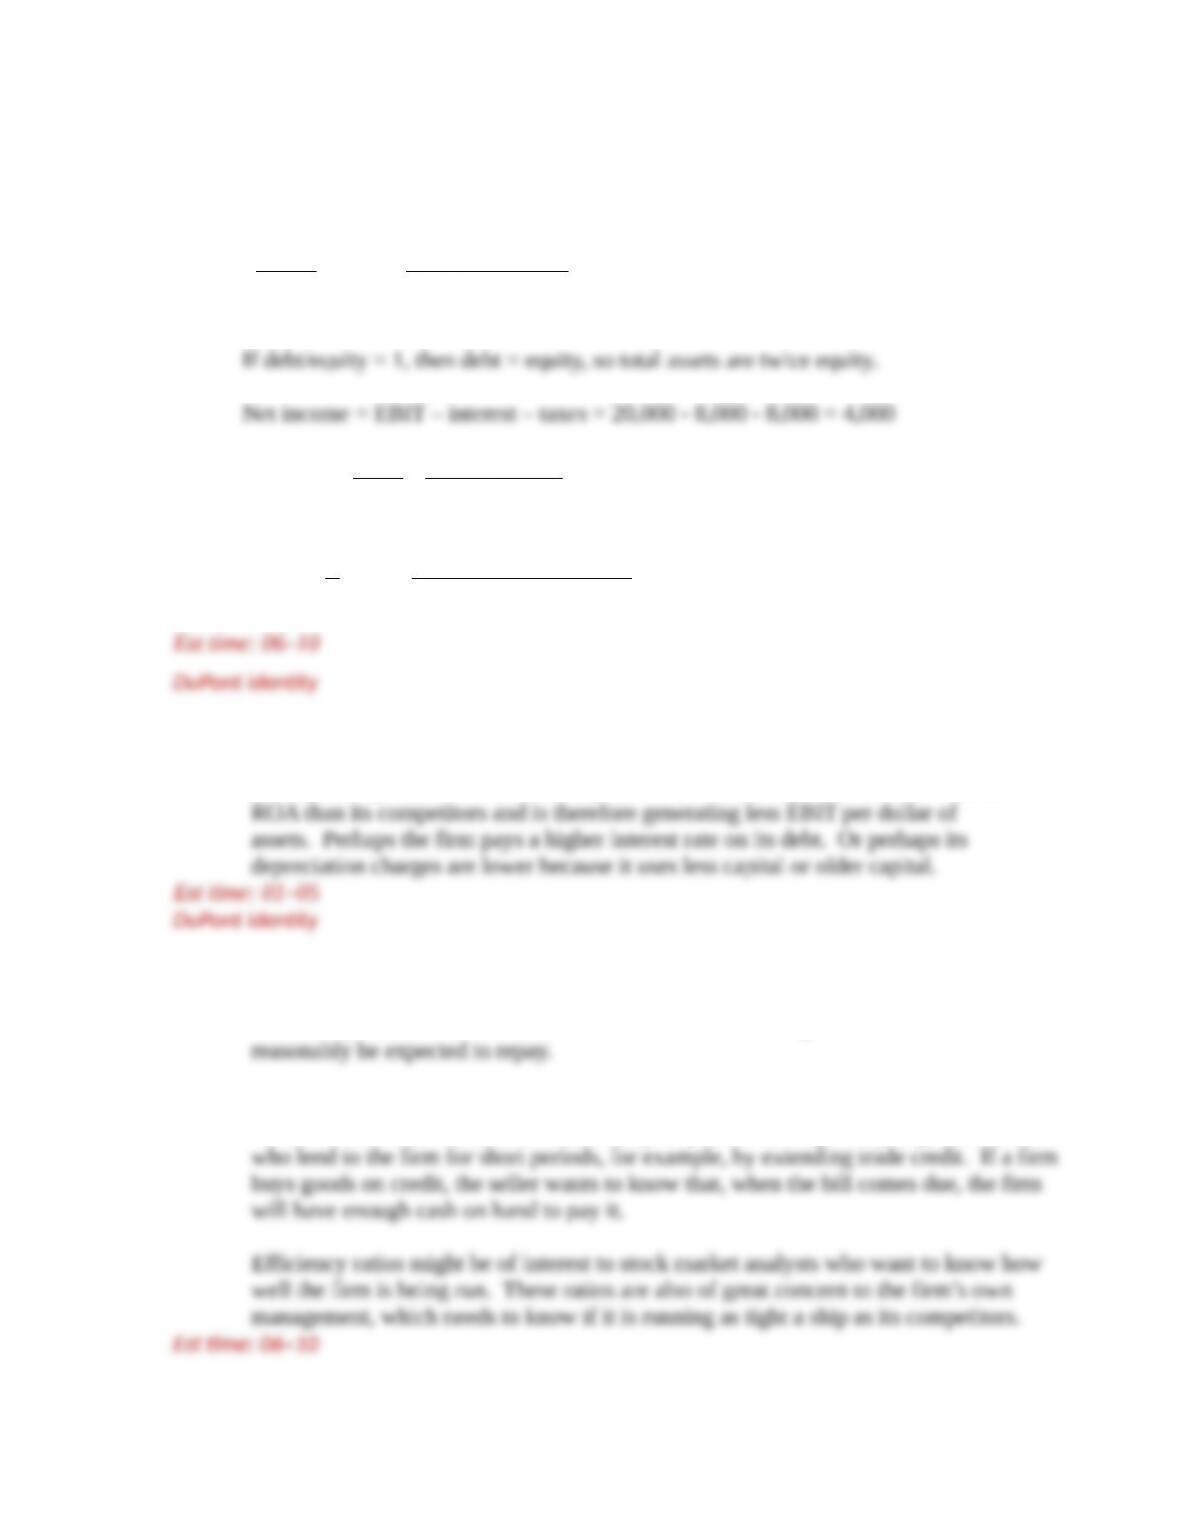
26.
a. ROA = asset turnover operating profit margin = 3 0.05 = 0.15 = 15%
b. Using Equation 4.2 for ROE, modified to include ROA from above
ROE=assets
equity × ROA × net income
Aftertax
operating income
If debt/equity = 1, then debt = equity, so total assets are twice equity.
Net income = EBIT – interest – taxes = 20,000 – 8,000 – 8,000 = 4,000
Tax rate=taxes
EBT =8,000
20,000−8,000 =.66∨66
ROE=2
1×.15×4,000
4,000+8,000 ×(1−.66)=.18∨18
Est time: 06–10
DuPont identity
27. The firm has less debt relative to equity than the industry average, but its ratio of
EBIT plus depreciation to interest expense is lower. Perhaps the firm has a lower
28. Leverage ratios are of interest to banks or other investors lending money to the
firm. They want to be assured that the firm is not borrowing more than it can
Liquidity ratios are also of interest to creditors who prefer that a firm’s current assets are
well in excess of its current liabilities. Liquidity ratios are especially important to those
4-.
Copyright © 2018 McGraw-Hill Education. All rights reserved. No reproduction or distribution without the prior written consent of McGraw-Hill
Education.

4-.
Copyright © 2018 McGraw-Hill Education. All rights reserved. No reproduction or distribution without the prior written consent of McGraw-Hill
Education.