1. Cash flow from operations can be positive even if net income is negative. For
example, if depreciation expenses are large, then negative net income might
2. An increase in accounts receivable reduces cash flow by $10,000. An increase in
3.
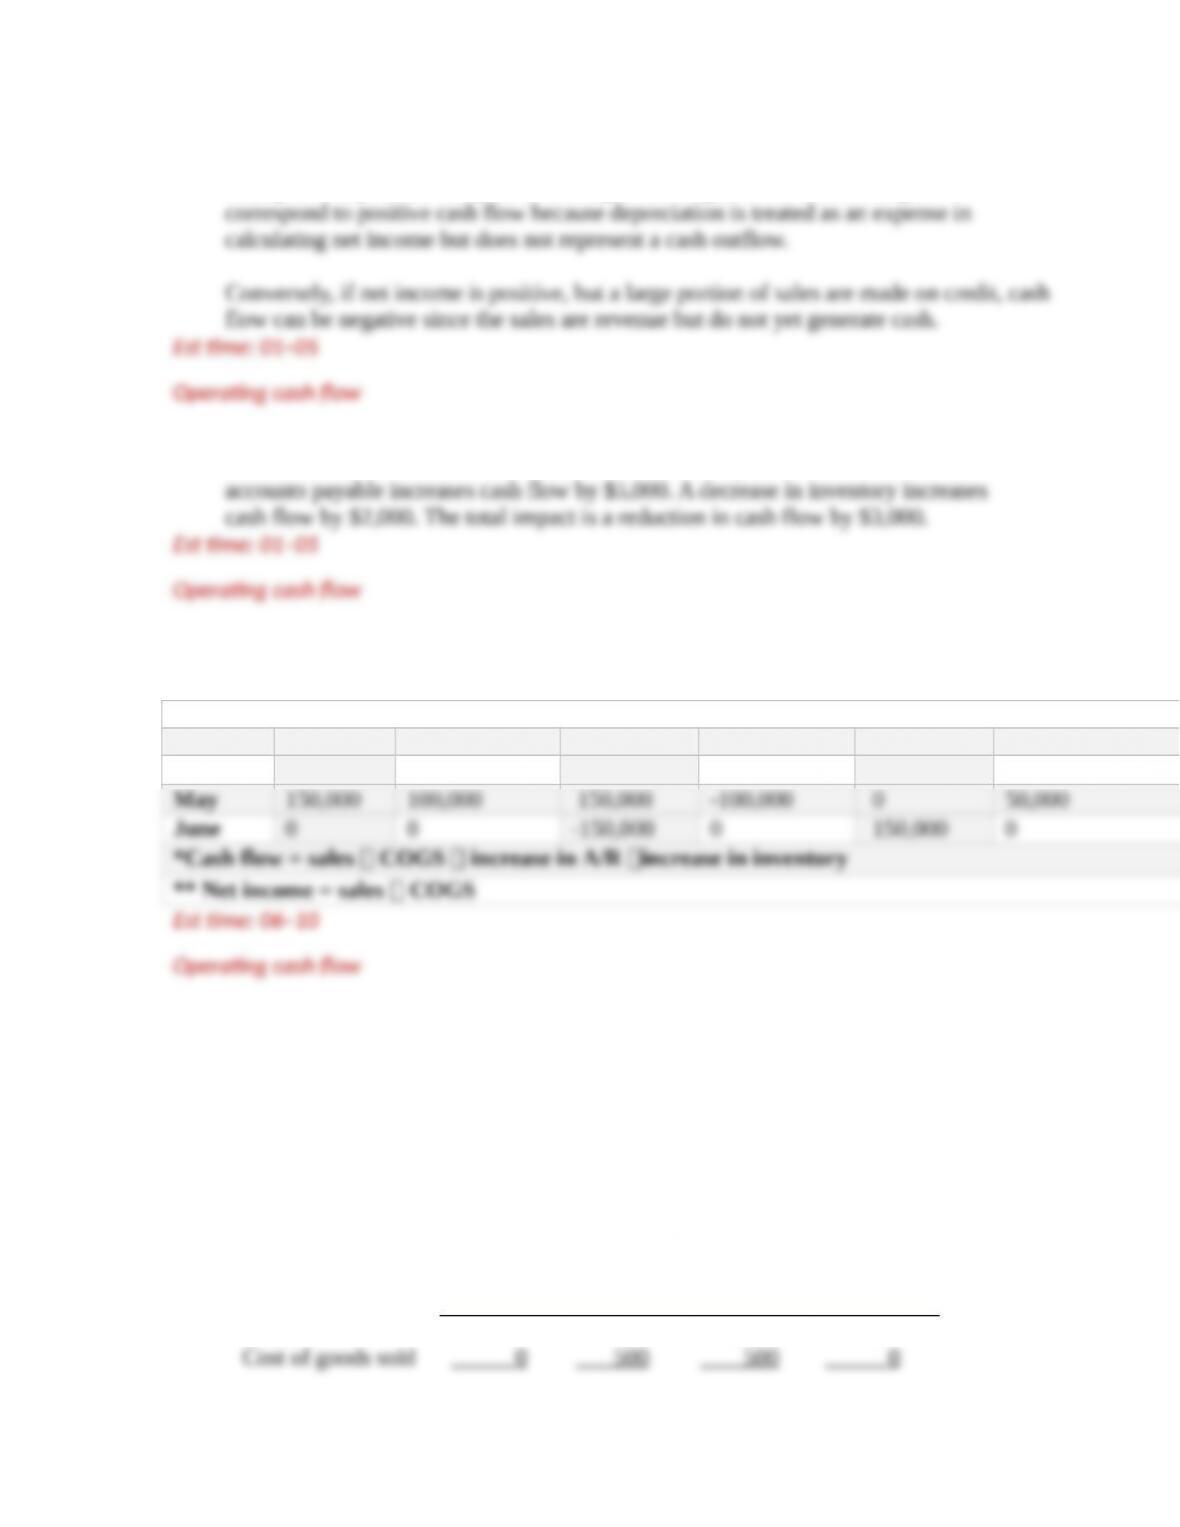
Candy Canes, Inc.
Month
Sales
Cost of goods
Δ ↑A/R
Δ↑Inventory
Cash flow*
Net income**
April 0 0 0 100,000 -100,000 0
4. The calculations are presented in the following table. Sales occur in quarters 2 and
3, so this is when the cost of goods sold is recognized. Therefore, net income is
zero in quarters 1 and 4. In quarter 1, the production of the kits is treated as an
investment in inventories. The level of inventories then falls as goods are sold in
quarters 2 and 3. Accounts receivable in quarters 2 and 3 equal the sales in those
quarters since it takes one quarter for receivables to be collected. Notice that cash
flow in quarter 1 equals the cost of producing the kits and that in quarters 3 and 4
cash flow equals cash received for the kits previously sold.
a. Quarter 1 Quarter 2 Quarter 3 Quarter 4
Sales $0 $550 $600 $ 0
3-.
Copyright © 2018 McGraw-Hill Education. All rights reserved. No reproduction or distribution without the prior written consent of McGraw-Hill
Education.
b., c.
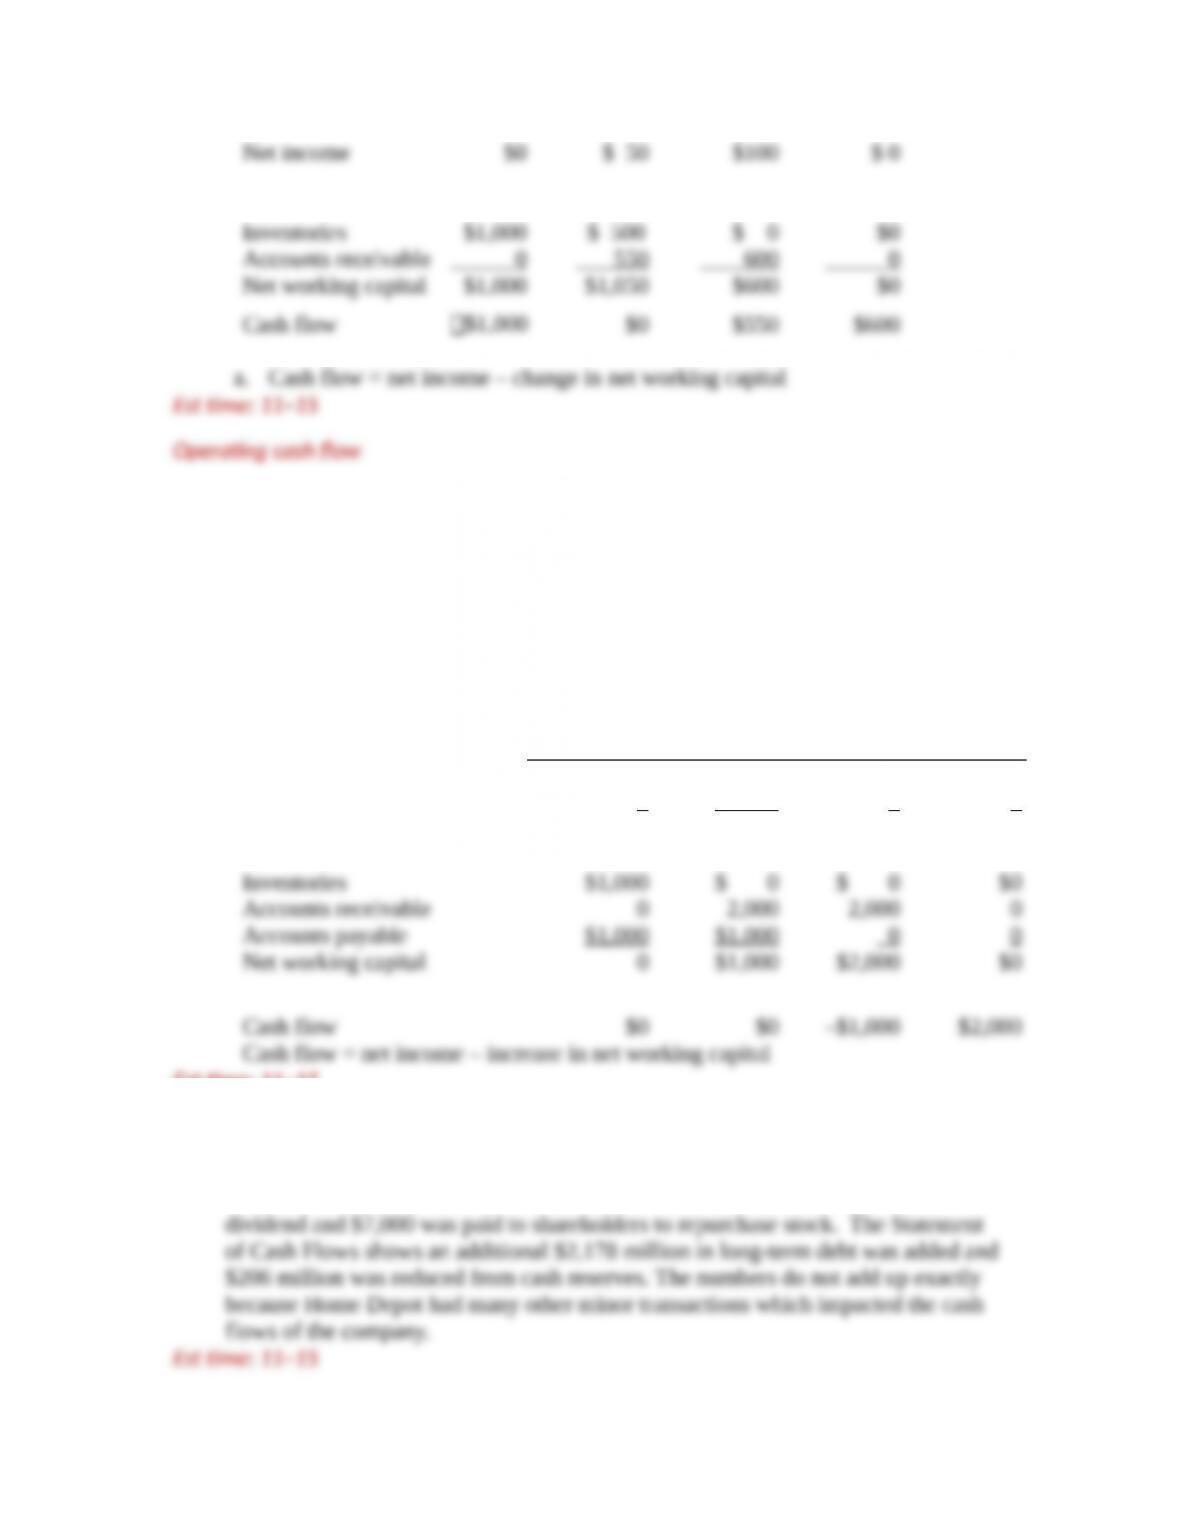
5. The table below shows the firm’s net income and investment in net working capital
for each month from January to April. Sales revenue and production costs are
recognized at the time of sale in February. Since the firm neither pays for goods nor
receives cash for sales, cash flow is zero in January and February. Cash flow occurs
in March and April, when cash is actually being exchanged. The sow ears are paid
for in March and cash is received for the purses in April.
Value Added Inc. (in 000s)
January February March April
Sales $0 $2,000 $0 $0
Cost of goods sold 0 $1,000 0 0
Net income $0 $1,000 $0 $0
Est time: 11–15
Operating cash o
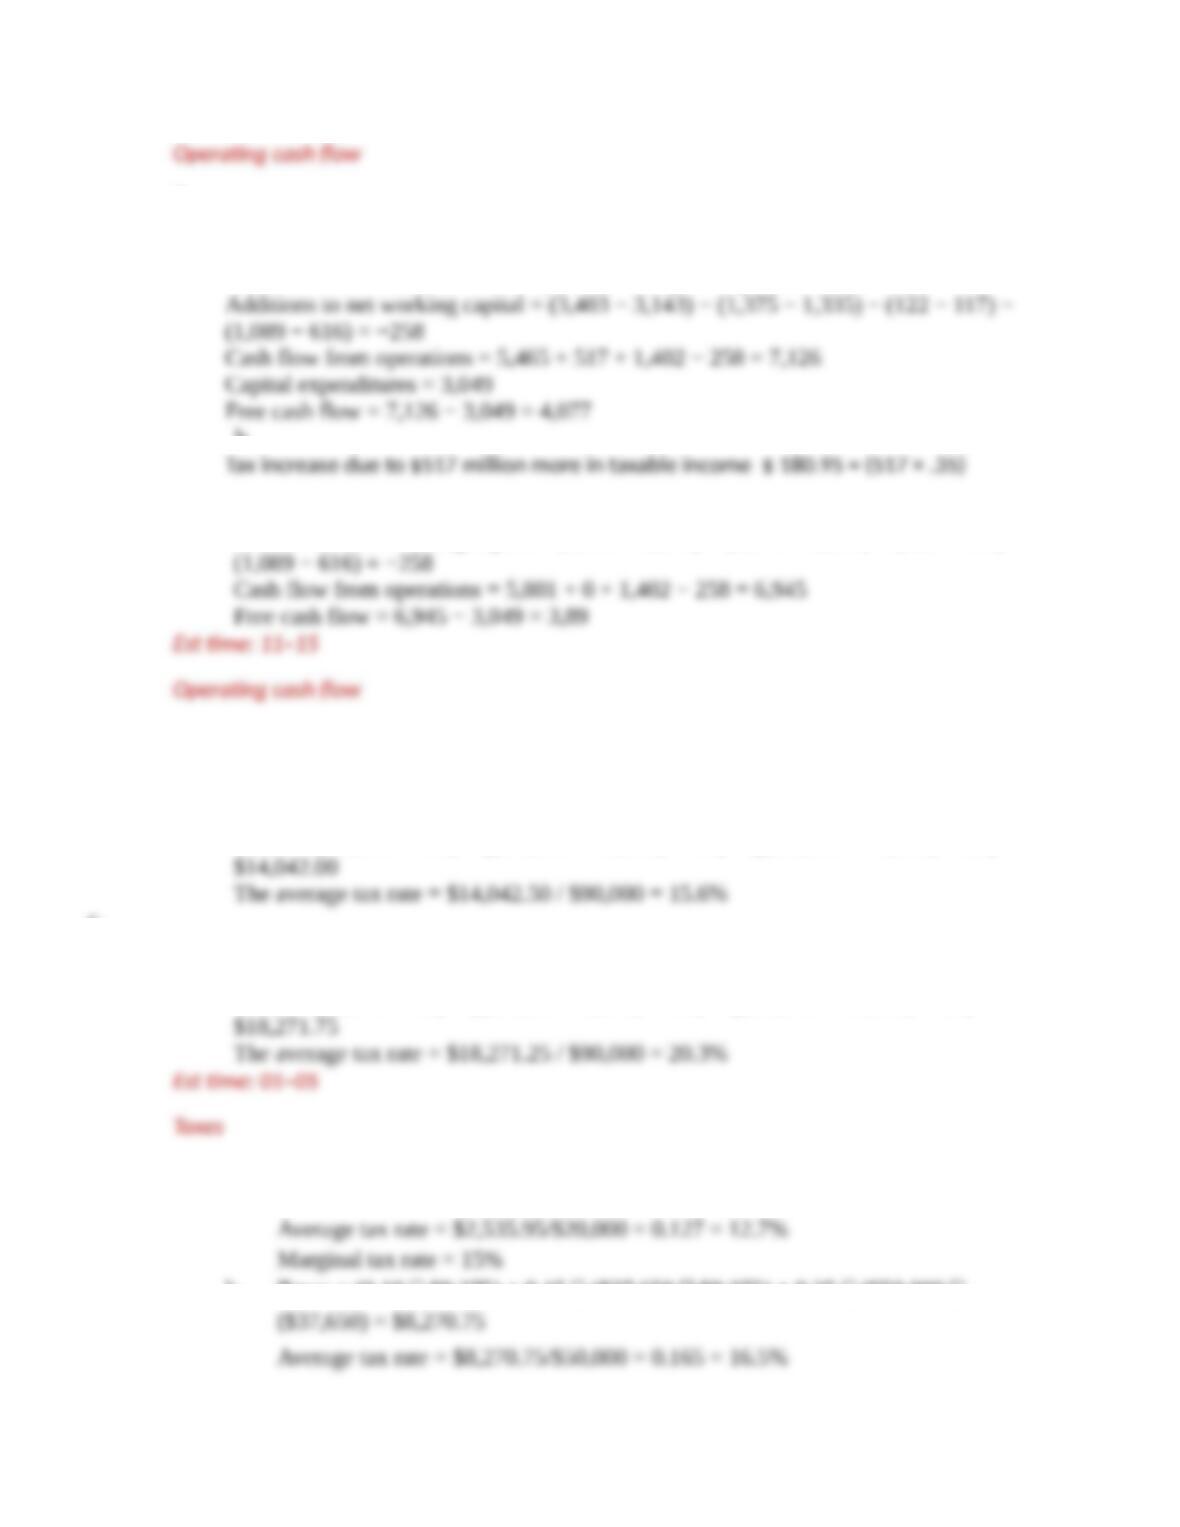
6. In section 3.3, the free cash flow is calculated at $7,362 million. Total cash
distributed to shareholders was $9,530 million. Of this, $2,530 was paid as a
3-.
Copyright © 2018 McGraw-Hill Education. All rights reserved. No reproduction or distribution without the prior written consent of McGraw-Hill
Education.
7.
a. Cash flow from operations = net income + interest + depreciation – additions to
net working capital
Free cash flow = cash flow from operations – capital expenditures
b.
c.
Additions to net working capital = (3,403 − 3,143) − (1,375 − 1,335) − (122 − 117) −
8.
a.
For a married couple, the marginal tax rate on $90,000 of income is 25%.
b.
Taxes = ($18,550 × .10) + (($75,300 – 18,550) × .15) + (($90,000 – 75,300) × .25) =
c.
For a single person, the marginal tax rate on $90,000 of income is also 25%.
d.
Taxes = ($9,275 × .10) + (($37,650 – 9,275) × .15) + (($90,000 – 37,650) × .25) =
9.
a. Taxes = (0.10 $9,275) + 0.15 ($20,000 $9,275) = $2,535.95
b. Taxes = (0.10 $9,275) + 0.15 ($37,650 $9,275) + 0.25 ($50,000
3-.
Copyright © 2018 McGraw-Hill Education. All rights reserved. No reproduction or distribution without the prior written consent of McGraw-Hill
Education.
Marginal tax rate = 25%
c. Taxes = (0.10 $9,275) + 0.15 ($37,650 $9,275) + 0.25 ($91,150
d. Taxes = (0.10 $9,275) + 0.15 ($37,650 $9,275) + 0.25 ($91,150
10. Taxes = (0.10 $18,550) + 0.15 ($75,300 $18,550) + 0.25 ($95,000
11. Taxes = (0.15 $50,000) + 0.25 ($75,000 $50,000) + 0.34 ($100,000
12.
a. Taxes on your salary = (0.10 $9,275) + 0.15 ($37,650 $9,275)
b. If you rearrange income so that your salary and the firm’s profit are both
3-.
Copyright © 2018 McGraw-Hill Education. All rights reserved. No reproduction or distribution without the prior written consent of McGraw-Hill
Education.
c. Any personal income between $37,650 and $50,000 will create the same
13. a.
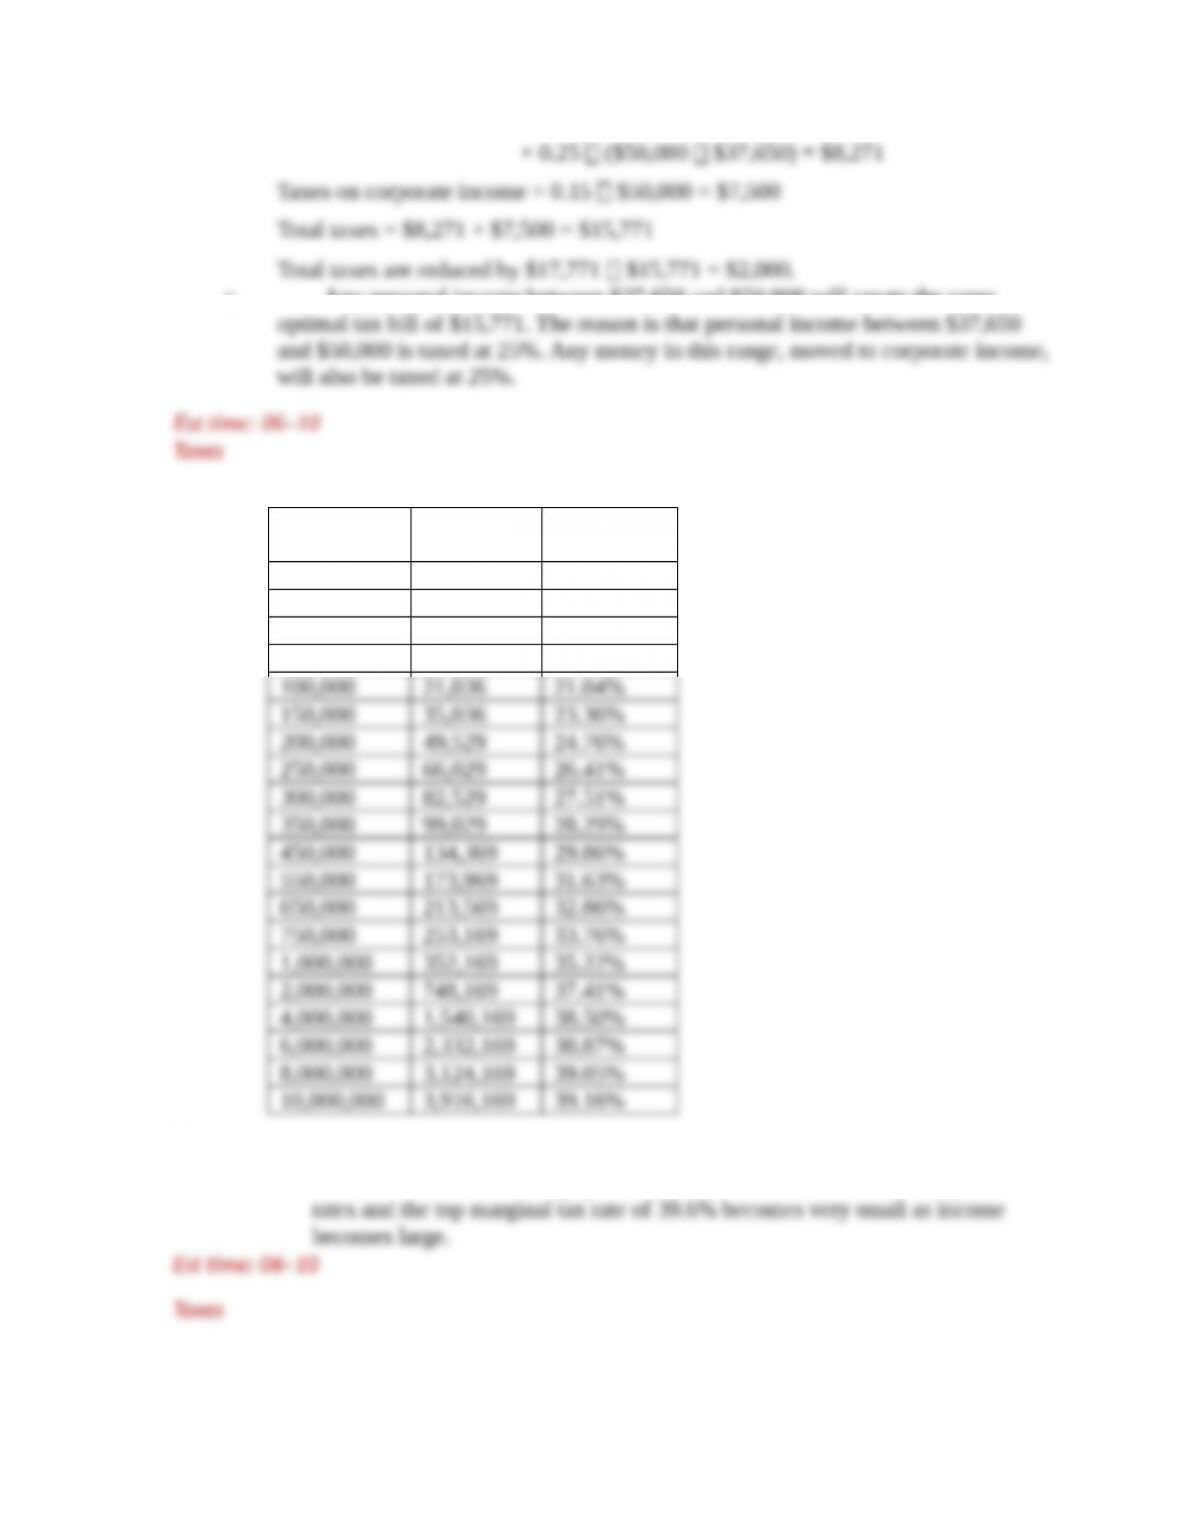
Income Taxes Due Average Tax
Rate (%)
10,000 1,036 10.36%
20,000 2,536 12.68%
40,000 5,771 14.43%
80,000 15,771 19.71%
..
…
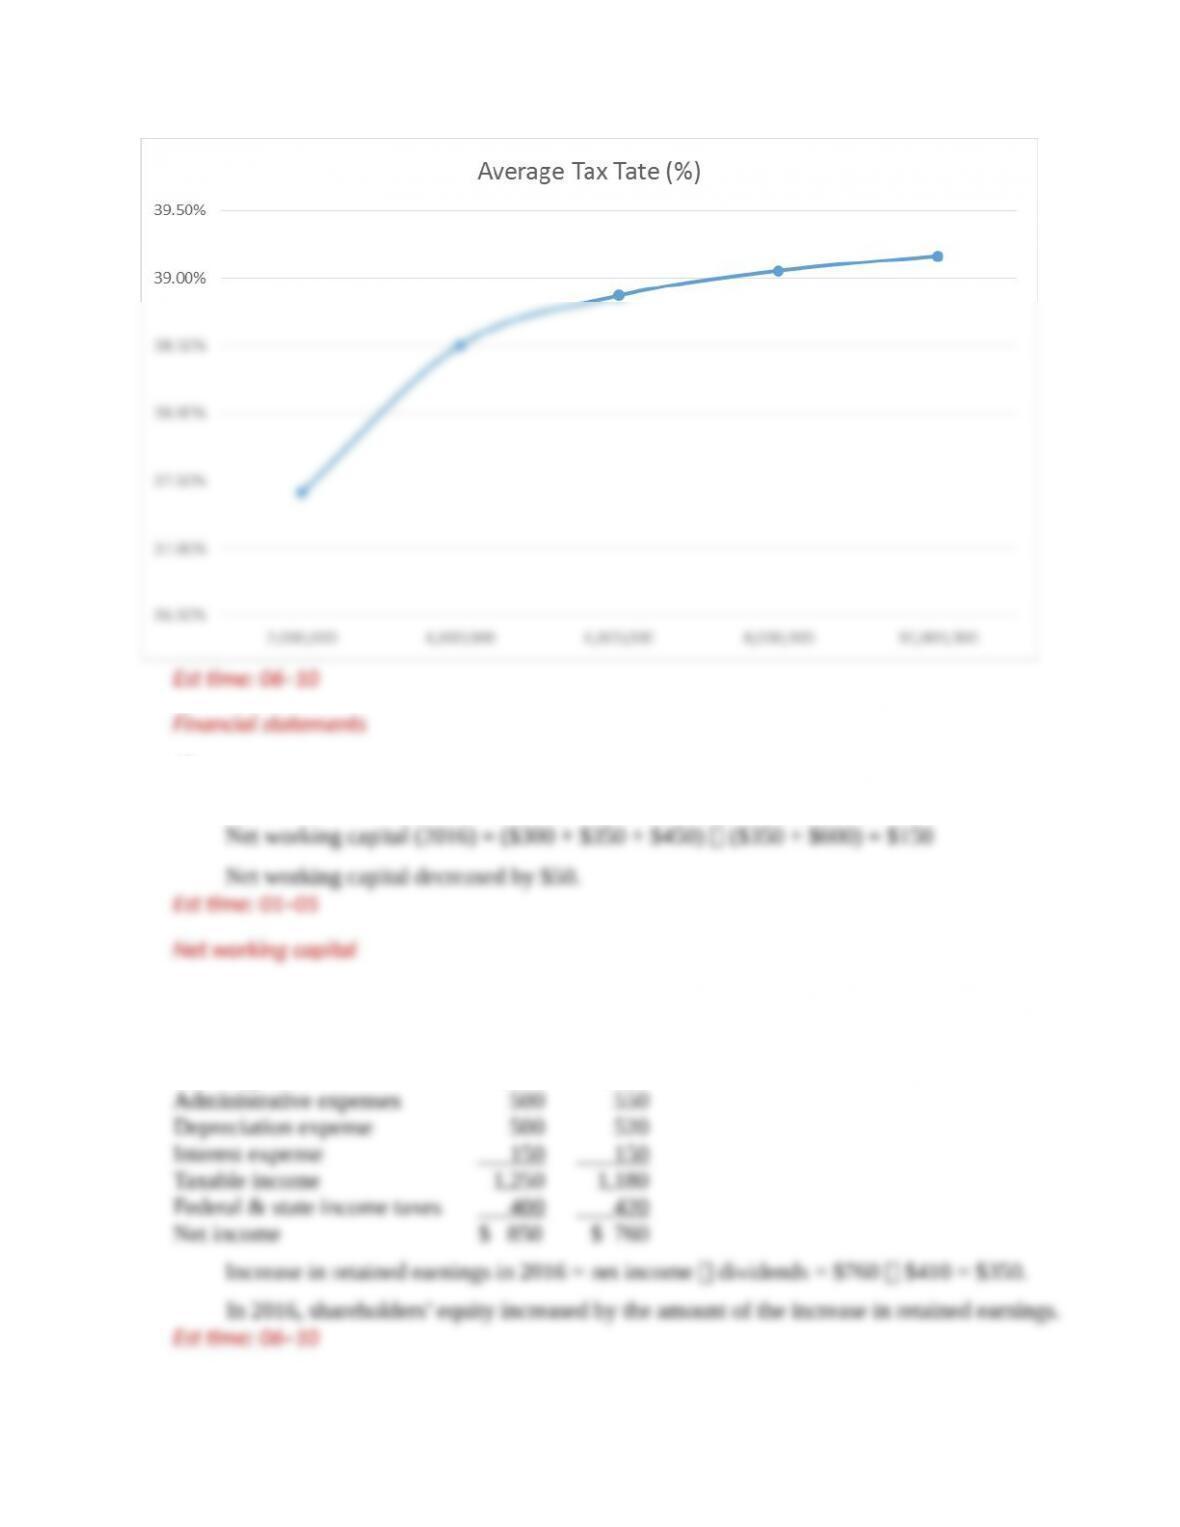
b. As shown in the table and graph above, the difference between average tax
14.
3-.
Copyright © 2018 McGraw-Hill Education. All rights reserved. No reproduction or distribution without the prior written consent of McGraw-Hill
Education.
Assets 2015 201
6
Liabilities and
Shareholders’ Equity 2015 2016
Cash & marketable securities $ 800 $ 300 Accounts payable $ 300 $ 350
Inventories 300 350 Notes payable 1,000 600
Accounts receivable 400 450 Long-term debt 2,000 2,400
15.
Net working capital (2015) = ($800 + $300 + $400) ($300 + $1,000) = $200
16.
2015 2016
Revenue $4,000 $4,100
Cost of goods sold 1,600 1,700
3-.
Copyright © 2018 McGraw-Hill Education. All rights reserved. No reproduction or distribution without the prior written consent of McGraw-Hill
Education.
17. Earnings per share in 2015 = $850,000/500,000 shares = $1.70
18. Net fixed assets increased by $800,000 during 2016, while depreciation expense in
19.
Market Value Balance Sheet, 2016
(figures in thousands of dollars)
Assets
Liabilities &
Shareholders’ Equity
Cash
$ 300
Accounts payable
$ 350
Inventories 350 Notes payable 600
20.
Cash provided by operations
Net income $ 760
Noncash expenses
3-.
Copyright © 2018 McGraw-Hill Education. All rights reserved. No reproduction or distribution without the prior written consent of McGraw-Hill
Education.
Cash flows from investments
Cash provided by (used for) financing activities
21. Average tax bracket in 2015 = taxes/taxable income = $400/$1,250 = 0.320 =
32.0%
3-.
Copyright © 2018 McGraw-Hill Education. All rights reserved. No reproduction or distribution without the prior written consent of McGraw-Hill
Education.