Solutions to Chapter 11
Introduction to Risk, Return, and the Opportunity Cost of Capital
1.
a. For the period 1900–2015, average rate of return = 11.4% (see Table 11-1).
2. Investors would not have invested in bonds during the period 1977–1981 if they had
expected to earn negative average returns. Unanticipated events must have led to these
The results for this period demonstrate the perils of attempting to measure “normal”
maturity (or risk) premiums from historical data. While experience over long periods may
3. If investors become less willing to bear investment risk, they will require a higher risk
premium to compensate them for holding risky assets. Security prices of risky
4. Given that a −20% return is well below the historical average market return, a −20%
11-3
Copyright © 2018 McGraw-Hill Education. All rights reserved. No reproduction or distribution without the prior written consent of
McGraw-Hill Education.
5. Based on the historical risk premium of the S&P 500 (7.6%) and a risk-free rate of
2.0%, one would predict an expected rate of return of 9.6%. If the stock has the same
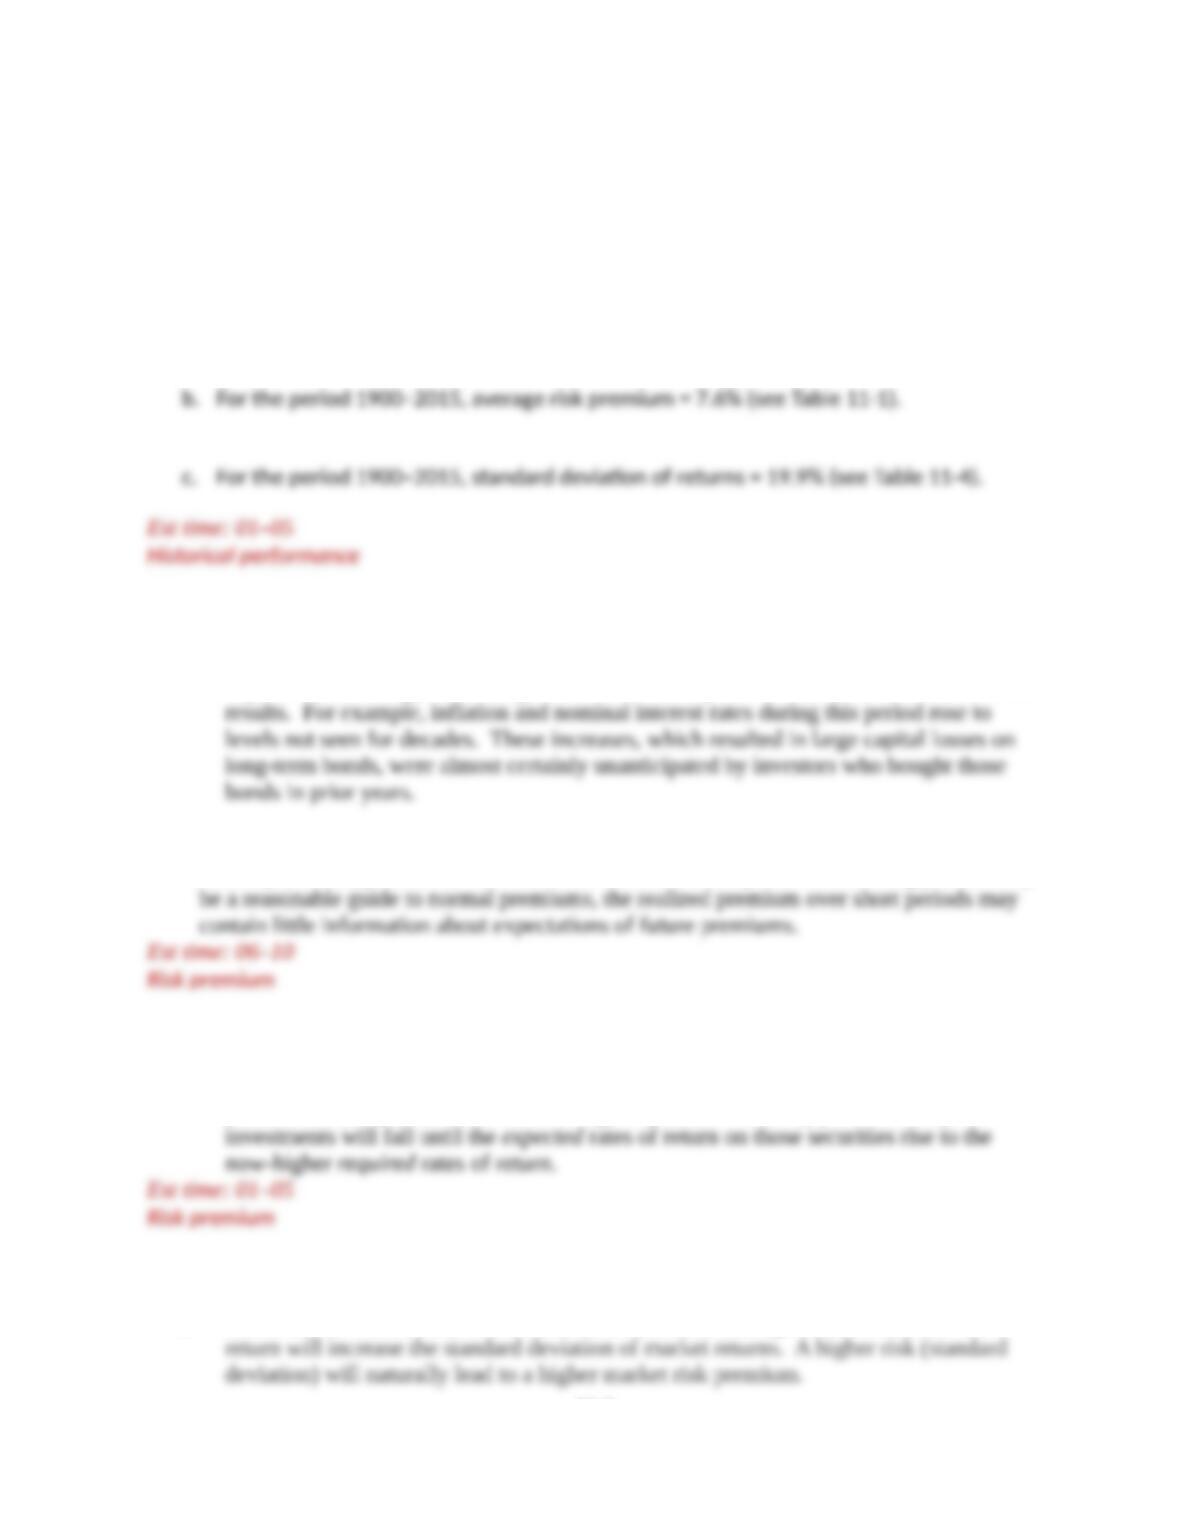
6. a.
b. The average risk premium was 12.61%.
c. The variance (the average squared deviation from the mean) was 1.42%.
11-3
Copyright © 2018 McGraw-Hill Education. All rights reserved. No reproduction or distribution without the prior written consent of
McGraw-Hill Education.

7.
a
%0.1515.0
40$
2$)40$44($
price share initial
gain capital
return of Rate
dividend
d. Dividend yield = dividend/ini(al share price = $2/$40 = 0.05 = 5%
8. a. (i)
%0
40$
2$)40$38($
price share initial
dividend gain capital
return of Rate
%85.30385.01
04.01
01
1
rateinflation 1
return of rate nominal1
return of rate Real
(ii)
%505.0
40$
2$)40$40($
return of Rate
%96.00096.01
04.1
05.1
1
rateinflation 1
return of rate nominal1
return of rate Real
(iii)
%1010.0
40$
2$)40$42($
return of Rate
11-3
Copyright © 2018 McGraw-Hill Education. All rights reserved. No reproduction or distribution without the prior written consent of
McGraw-Hill Education.
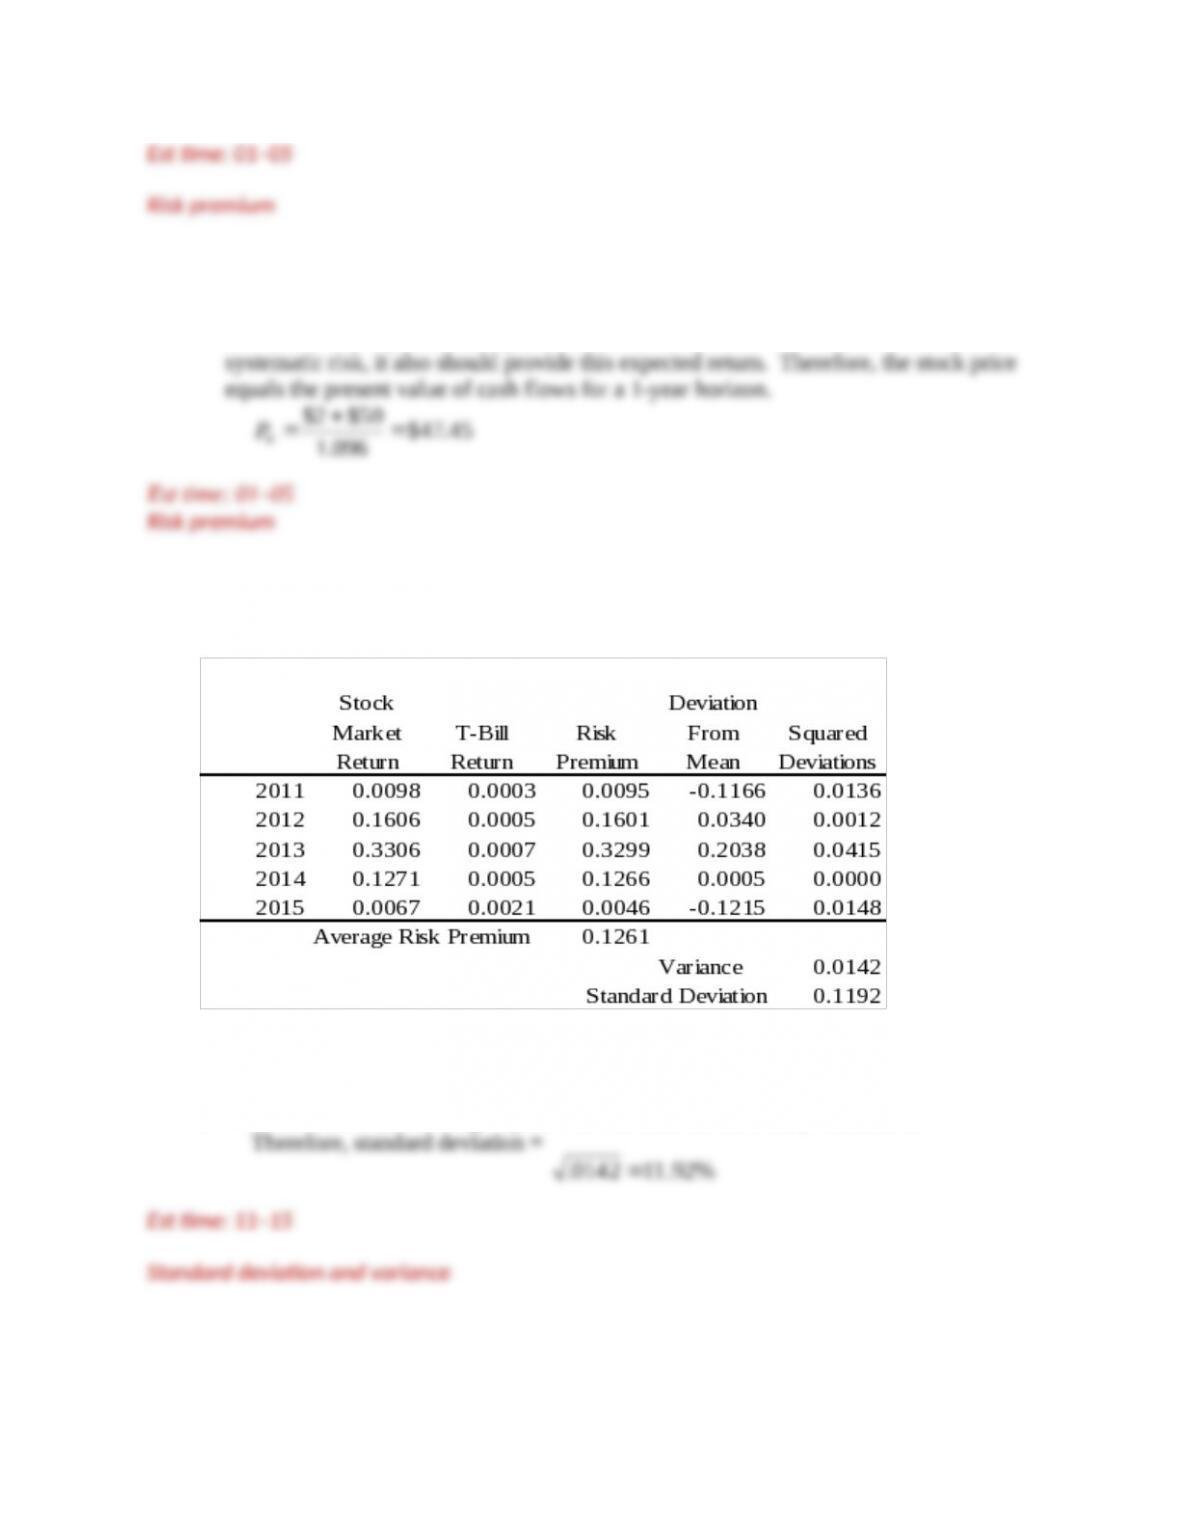
b.
%77.50577.01
04.1
10.1
1
rateinflation 1
return of rate nominal1
return of rate Real
Est time: 01–05
Nominal and real returns
9.
1
rateinflation 1
return of rate nominal1
return of rate Real
10. We use the following relationship:
1
rateinflation 1
return of rate nominal1
return of rate Real
11-3
Copyright © 2018 McGraw-Hill Education. All rights reserved. No reproduction or distribution without the prior written consent of
McGraw-Hill Education.
11.
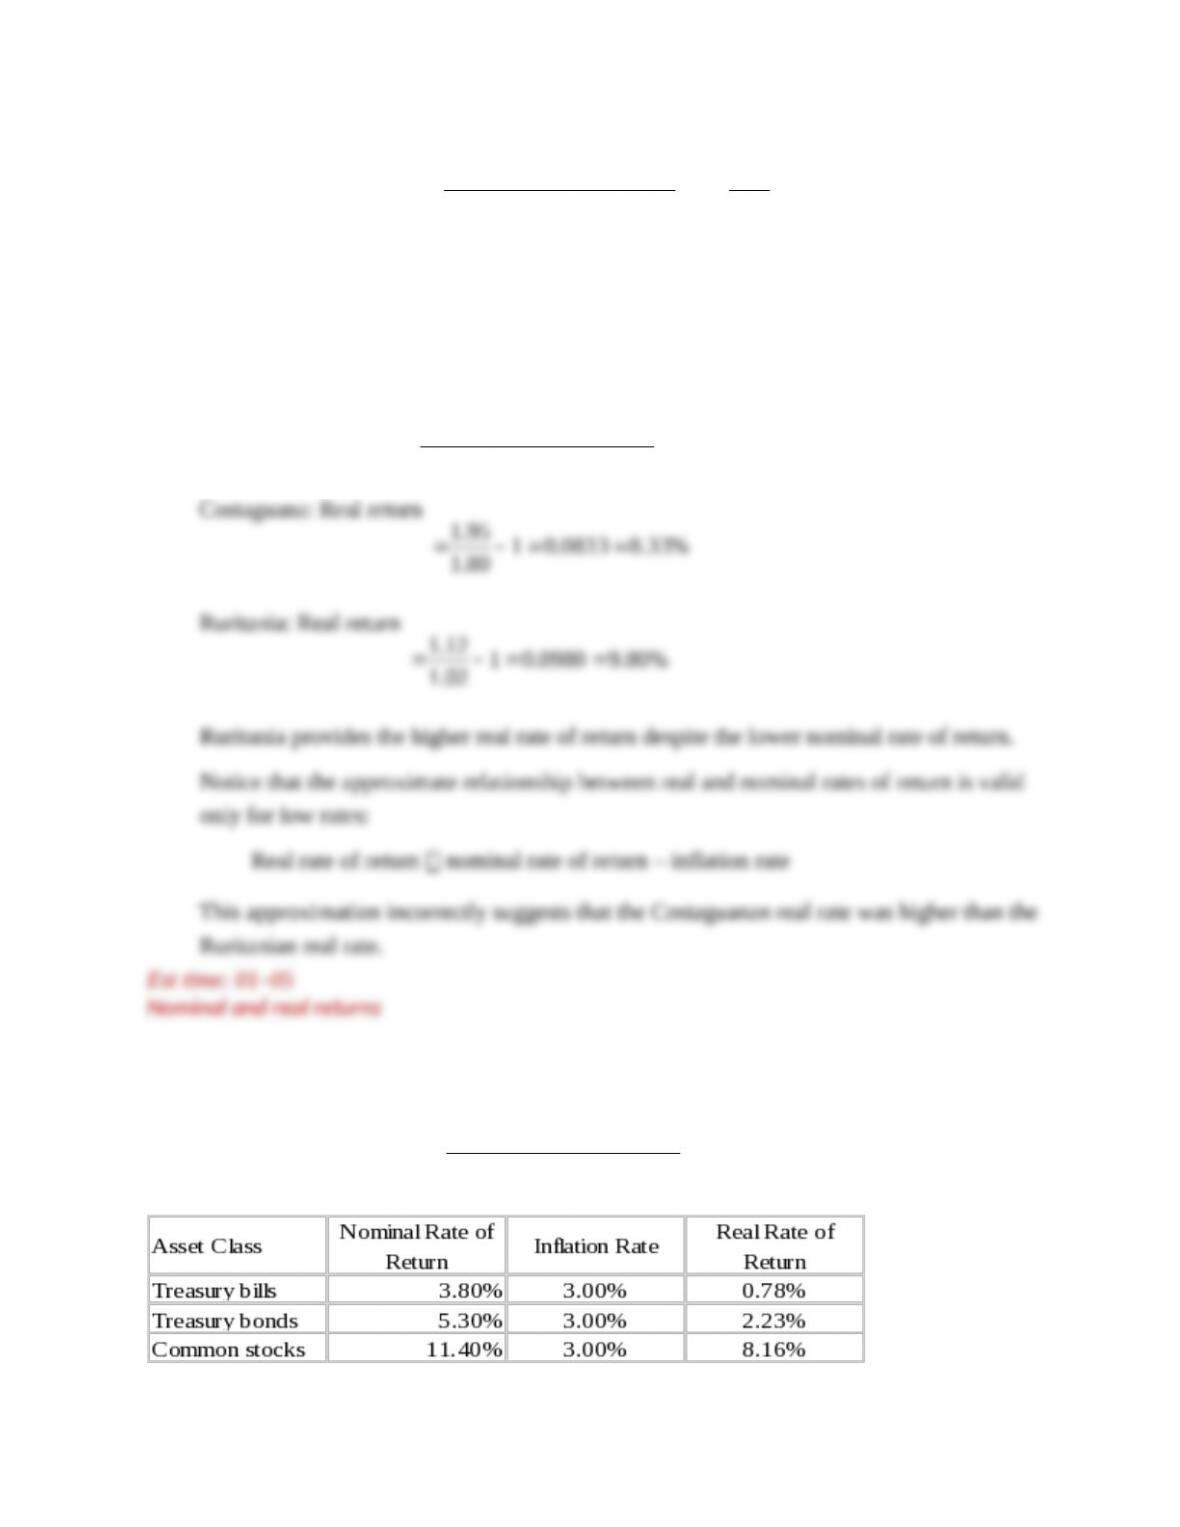
12. In 2016, the Dow was nearly 114% above the 2009 level. Therefore, in 2016, a
40-point movement was far less significant in percentage terms than it was in 2009. We
13.
a. Interest rates tend to fall at the outset of a recession and rise during boom periods.
b. rstock = [0.2 (.05)] + (0.6 .15) + (0.2 .25) = .13 or 13.0%
11-3
Copyright © 2018 McGraw-Hill Education. All rights reserved. No reproduction or distribution without the prior written consent of
McGraw-Hill Education.
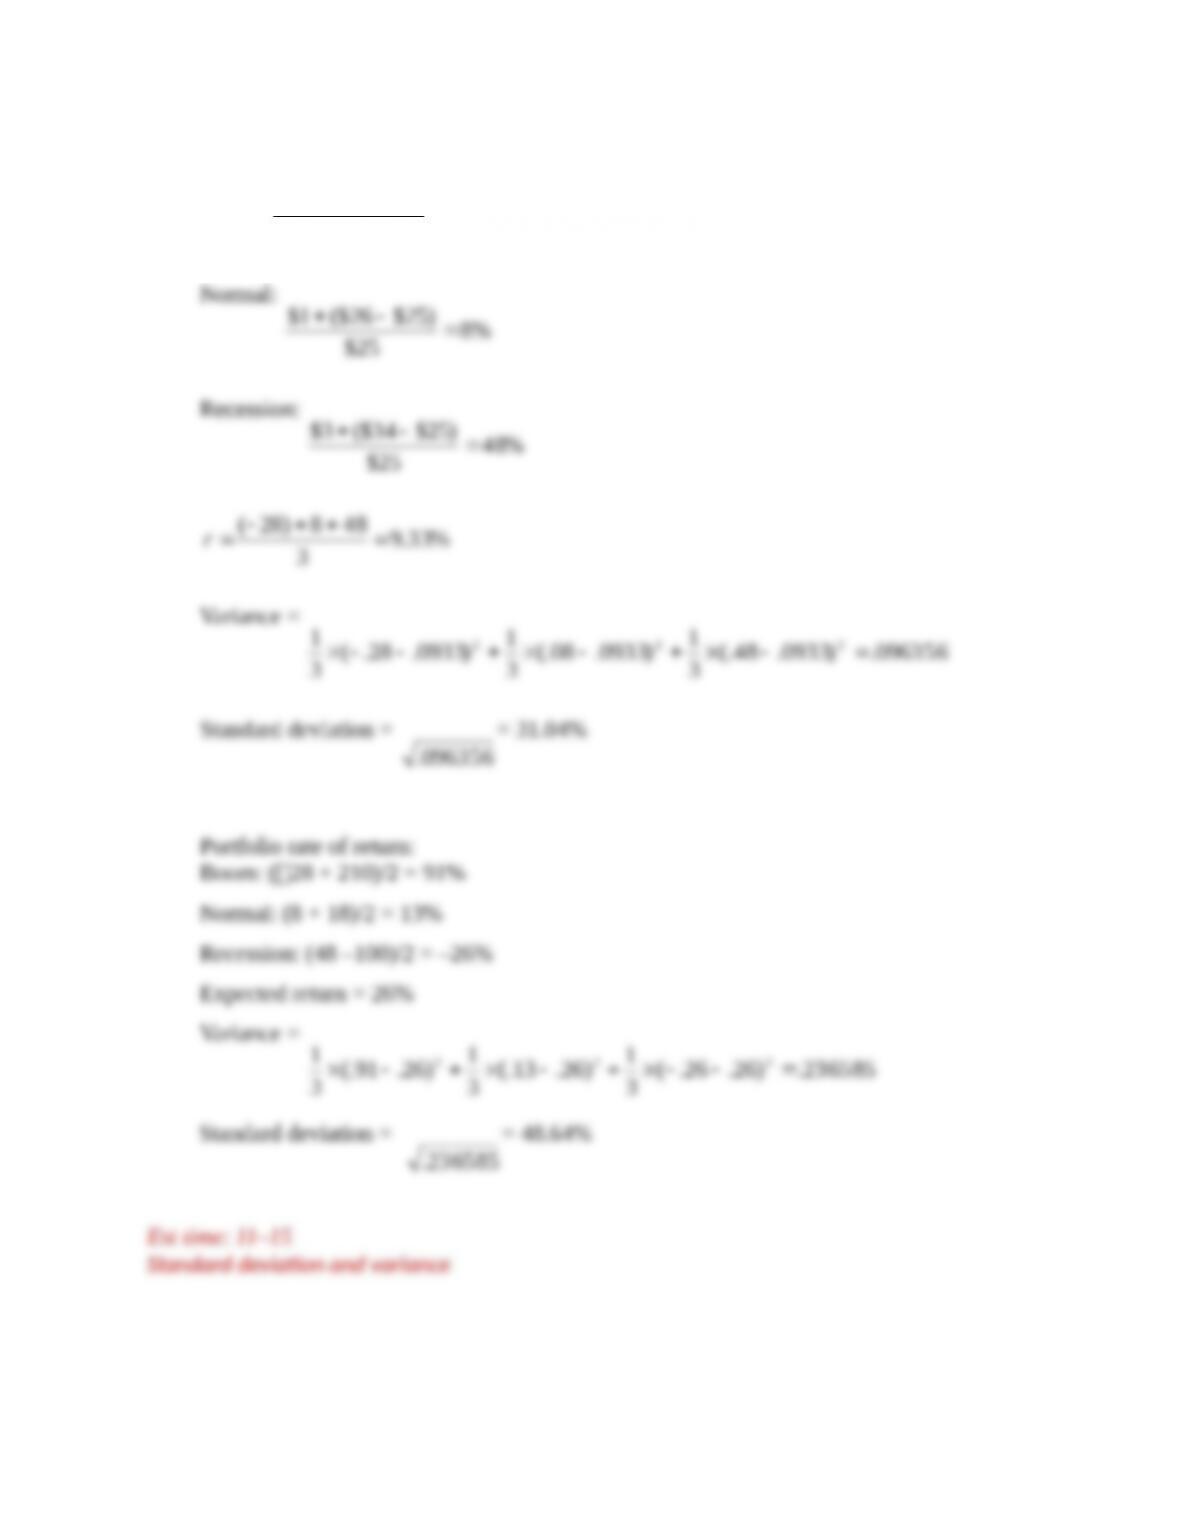
15. Escapist Films:
Boom:
%28
25$
)25$18($0$
16. The return and risk profile results for Mesozoic Funds and the Market are calculated in
the tables below.
11-3
Copyright © 2018 McGraw-Hill Education. All rights reserved. No reproduction or distribution without the prior written consent of
McGraw-Hill Education.
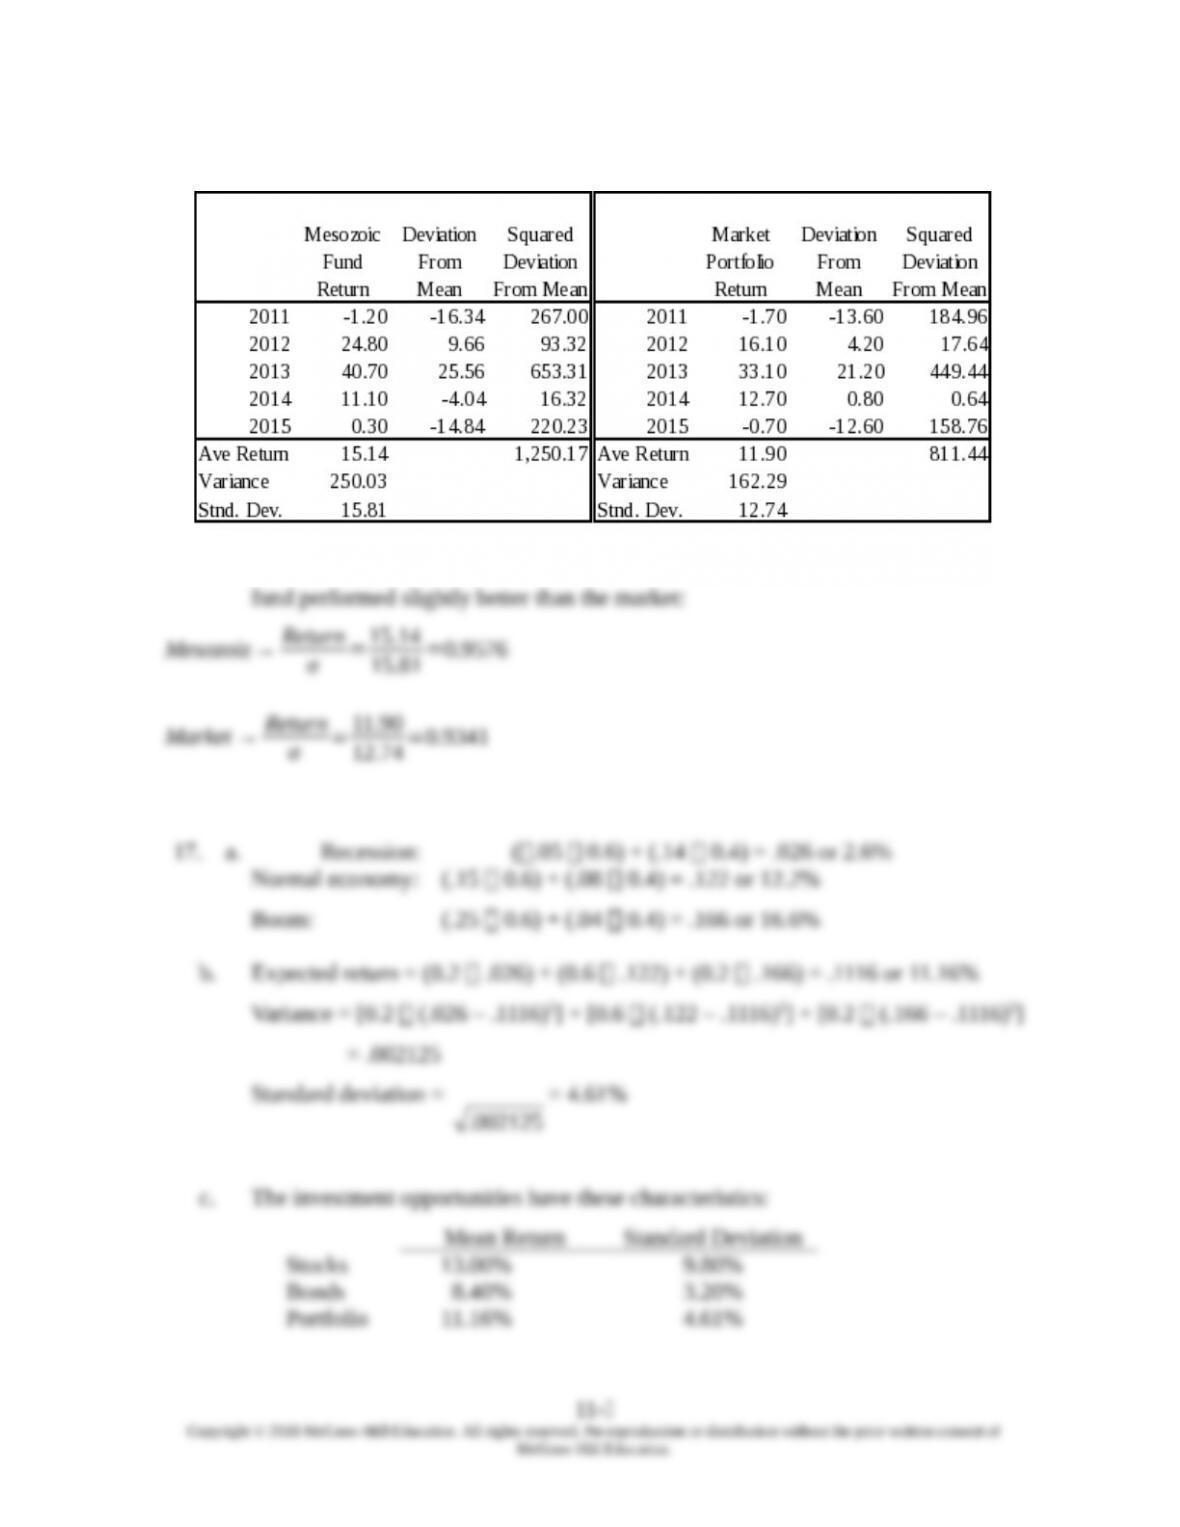
Comparing the risk-return profile of Diana Sauros with the market portfolio reveals that her
The best choice depends on the degree of your aversion to risk. Nevertheless, we
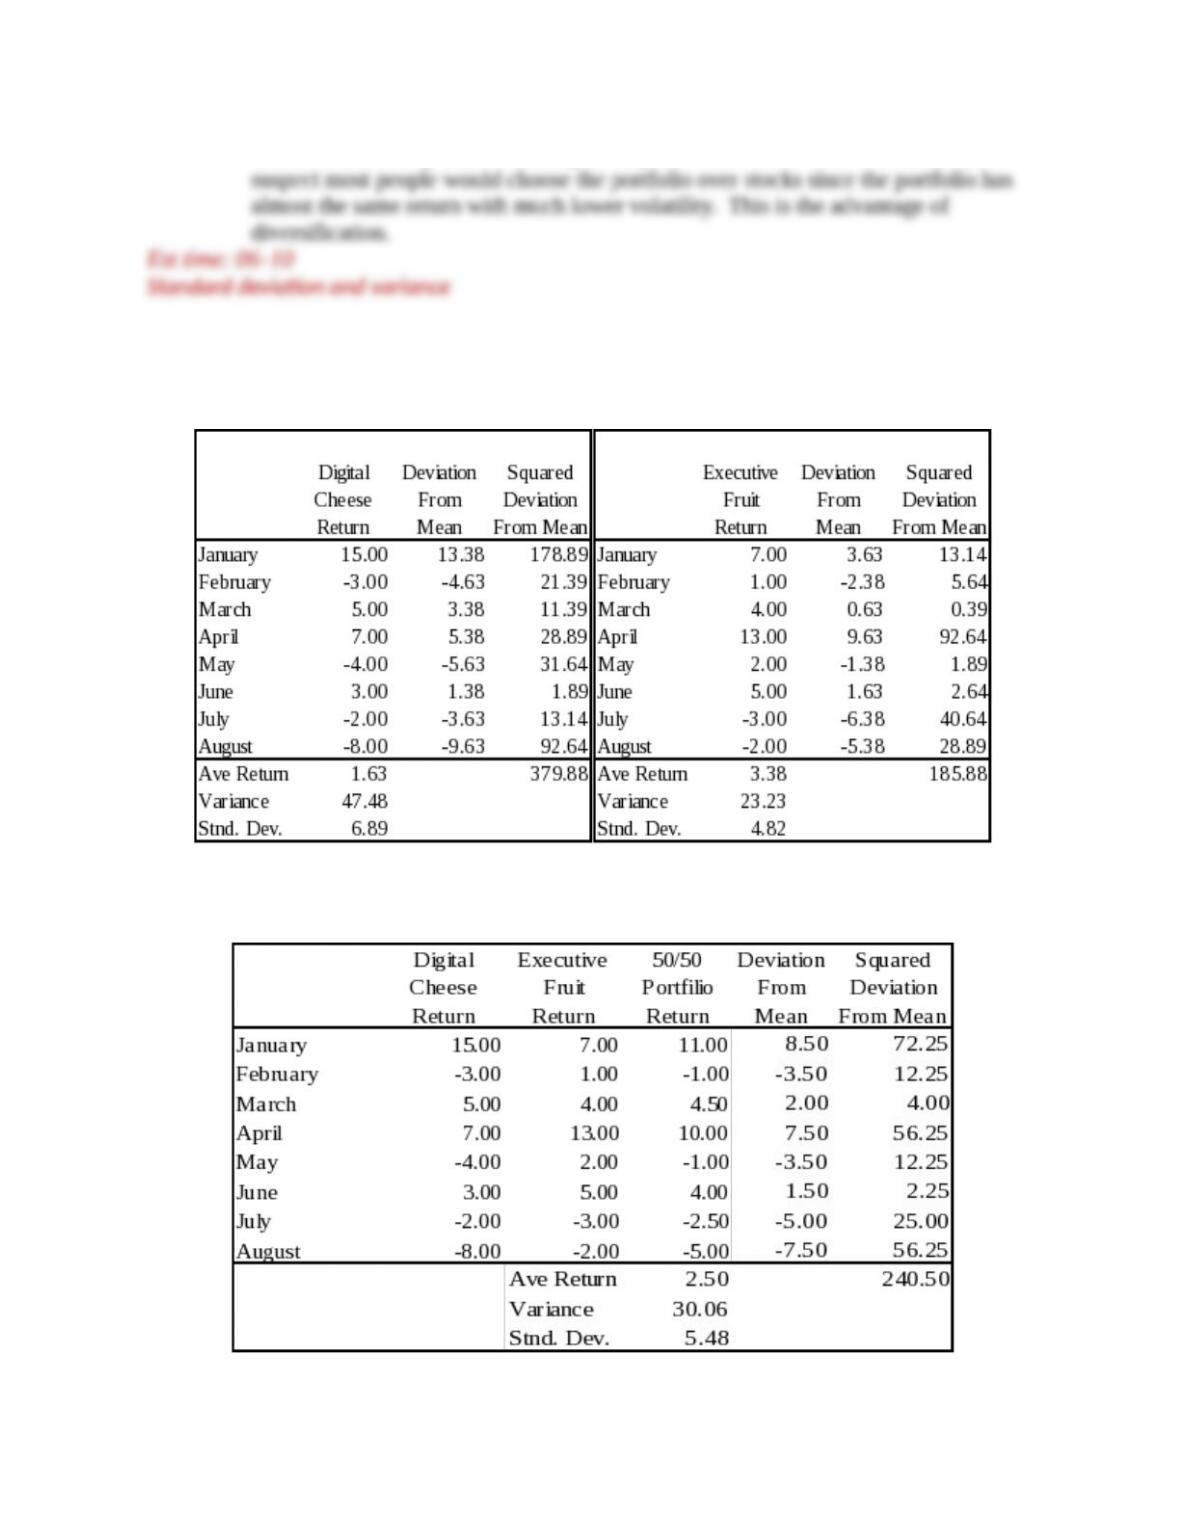
18. a.The calculation of risk is in the following tables. Digital Cheese carries more risk
with a standard deviation of 6.9 versus 4.8 for Executive Fruit:
b. The portfolio returns and variance are calculated as follows:
11-3
Copyright © 2018 McGraw-Hill Education. All rights reserved. No reproduction or distribution without the prior written consent of
McGraw-Hill Education.

c. The portfolio standard deviation is 5.5, which is less than the average of 5.9.
19. Risk reduction is most pronounced when the stock returns vary against each other.
20. a. General Steel should be exposed to higher market risks than General Food Supplies,
b. General Cinemas should be exposed to higher market risks than Club Med, since the
21. The expected rate of return on the stock is 4%. The standard deviation is 22%.
rate of return=(−18+26)
2=4
standard deviation=
√
(−18−4)2+(26−4)2
2=22
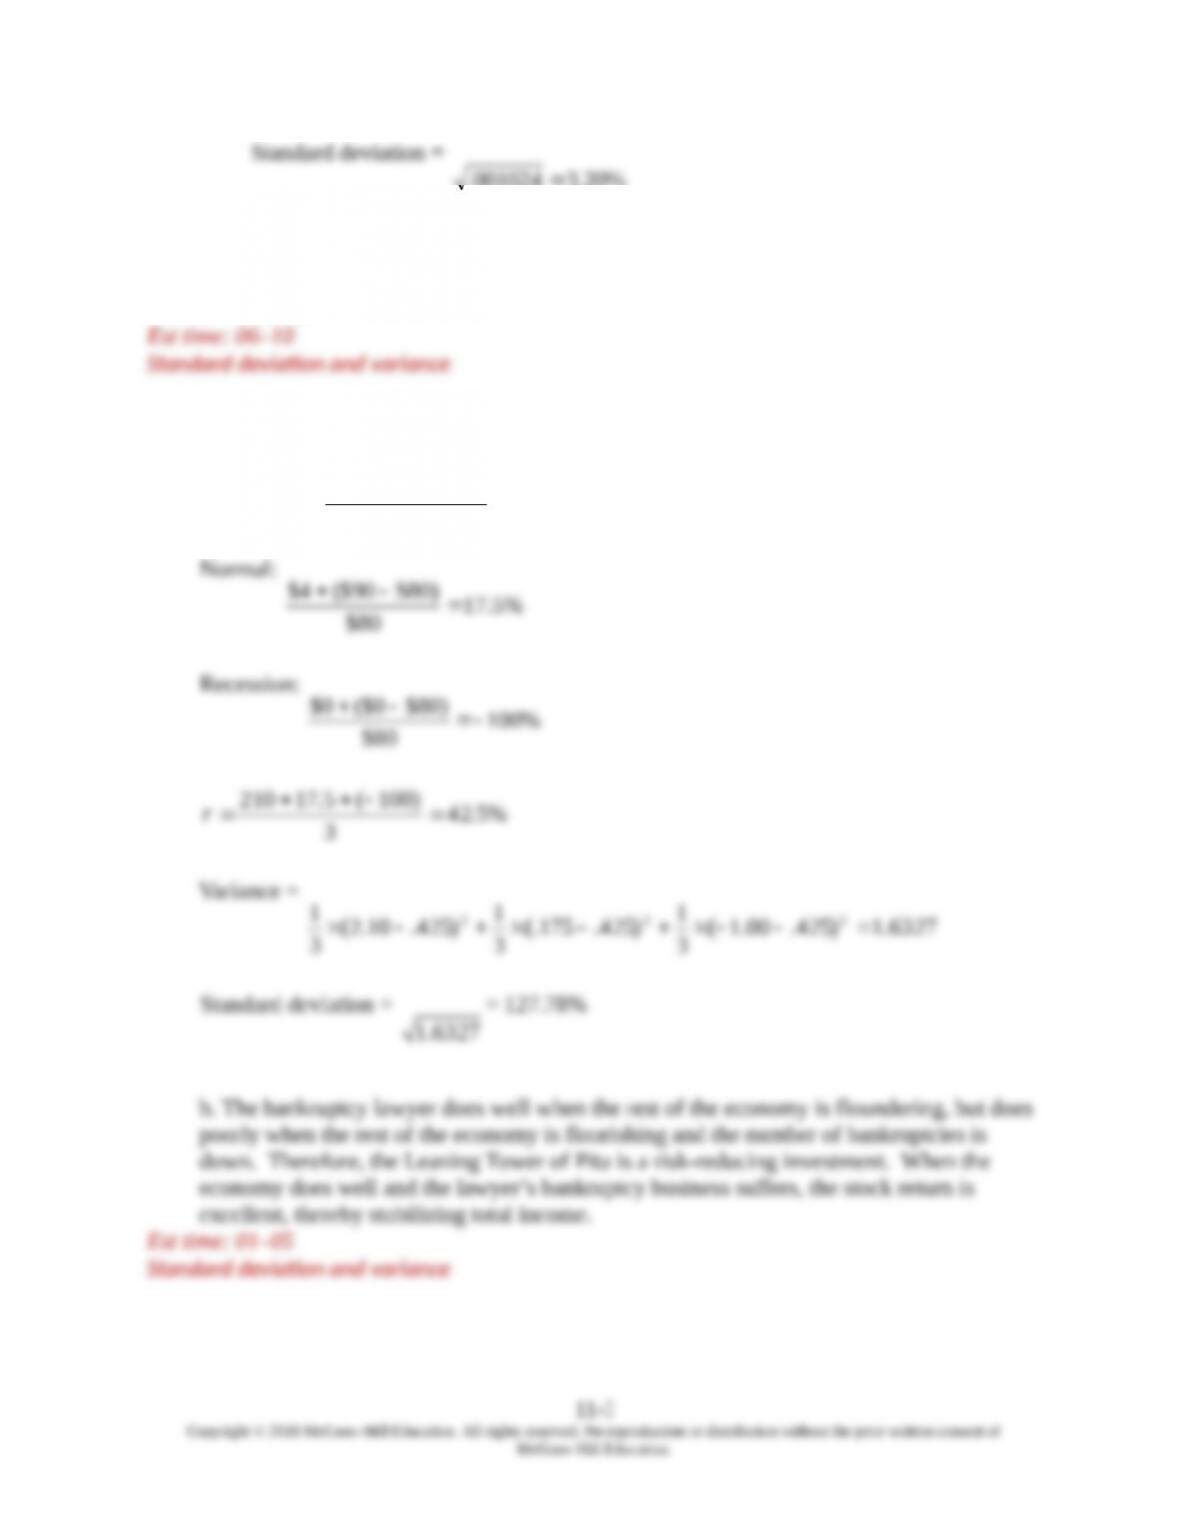
22. Sassafras is not a risky investment for a diversified investor. Its return is better when
the economy enters a recession. Therefore, the company risk offsets the risk of the rest
of the portfolio. Sassafras is a portfolio stabilizer despite the fact that there is a 90%
chance of loss.
Compare Sassafras to purchasing an insurance policy. Most of the time, you lose money
In contrast, the Leaning Tower of Pita has returns that are positively correlated with the
23. a. Using Excel’s AVERAGE and STDEV functions gives monthly data of:
XOM CVX WMT
Average 0.40% 0.30% 0.94%
11-3
Copyright © 2018 McGraw-Hill Education. All rights reserved. No reproduction or distribution without the prior written consent of
McGraw-Hill Education.

b. Using Excel’s CORREL function gives:
XOM CVX WMT
XOM 1
b. Using Excel, the standard deviation for an equally weighted portfolio of Walmart
c. Using Excel, the standard deviation for an equally weighted portfolio of Chevron
and ExxonMobil is 6.87%. Using the values from part (a), the average standard
24. a. True. Diversified portfolios are less risky as compared to securities with equal
returns.
b. True.
11-3
Copyright © 2018 McGraw-Hill Education. All rights reserved. No reproduction or distribution without the prior written consent of
McGraw-Hill Education.