Chapter 6
Common Stock Valuation
Concept Questions
2. P/E ratios measure the price of a share of stock relative to current earnings. All else the same, future
3. As you know, firms can have negative earnings. But, for a firm to survive over a long period, earnings
4. FCF represents the total firm cash flow, which can be used to pay both debt and equity holders. So,
7. In general, companies that need the cash will often forgo dividends since dividends are a cash
8. The general method for valuing a share of stock is to find the present value of all expected future
dividends. The constant perpetual growth model presented in the text is only valid (i) if dividends are
9. The two components are the dividend yield and the capital gains yield. For most companies, the
10. With no dividends, we cannot use the dividend discount model. With negative earnings, we cannot
Copyright © 2018 McGraw-Hill Education. All rights reserved. No reproduction or distribution without the prior written consent of McGraw-Hill
Education.
Solutions to Questions and Problems
NOTE: All end of chapter problems were solved using a spreadsheet. Many problems require multiple
steps. Due to space and readability constraints, when these intermediate steps are included in this
solutions manual, rounding may appear to have occurred. However, the final answer for each problem is
found without rounding during any step in the problem.
Core Questions
To get equity value, we would need to subtract the value of the firm’s debt.
11. Sustainable growth = .08 = .14r ; retention ratio = .5714
Copyright © 2018 McGraw-Hill Education. All rights reserved. No reproduction or distribution without the prior written consent of McGraw-Hill
Education.
Intermediate Questions
16. The growth rates will be 20%, 15%, and 10% in years 1-3, with a 5% rate thereafter.
D1=1.25(1.20) = $1.50
17. P14 = D15 / (k – g) = $4 / (.15 – .055) = $42.11
18. EV = $420 + $38 – $12 = $446
19. P4 = $2.20(1.04) / (.10 – .04) = $38.13
20. P6 = D7 / (k – g) = $1.68(1.055)7 / (.11 – .055) = $44.43
21. P/E ratio values are: 21.77, 19.88, 18.98, 16.16, 17.36, 17.10 ; average = 18.54
EPS growth rates: 16.36%, 3.37%, 16.09%, 15.51%, 14.29% ; average = 13.12%
A reasonable price range would seem to be $146 to $167 per share, although both the P/E and
P/CFPS are at the high end of the price range.
22. k = .03 + 1.10(.075) = 11.25%
Copyright © 2018 McGraw-Hill Education. All rights reserved. No reproduction or distribution without the prior written consent of McGraw-Hill
Education.
23. P/E ratio: N/A, N/A, N/A, N/A, 2,075.00, 225.00 ; average = 1,150.00
EPS growth rates: 17.50%, 45.45%, 69.44%, 107.27%, 50.00% ; average = 57.93%
Expected share price using P/E = 1,150($0.06)(1.5793) = $108.97
24. P/E ratios and P/CFPS are all negative, so these ratios are unusable.
This price is ridiculous, $168! Notice that sales have been exploding, but the company still can’t
25. Parador’s expected future stock price is $67 × 1.13 = $75.71, and expected future earnings per share
26. Parador’s expected future stock price is $67 × 1.13 = $75.71, and expected future sales per share is
27. b = 1 – ($2.04 / $5.00) = .5920; g = 9.50% × .5920 = 5.62%
28. P/E price: 13.10(1.1348)($5.00) = $74.33
29. EPS next year = $5.00(1.0562) = $5.28
30. Clean dividend = $5.28 – ($18.01 – 17.05) = $4.32
32. The values for the end of the year are:
Note, to find the book value in the first year, we can use the following relationship:
Copyright © 2018 McGraw-Hill Education. All rights reserved. No reproduction or distribution without the prior written consent of McGraw-Hill
Education.
We will use this relationship to calculate the book value in the following years, so:
P0 =
$3 .79 – ($14 .57 – 12 . 95 )
1. 082
+
($3 .79 × 1. 11) – ($14 . 57 ×. 1250 )
1 .0822
+
($3 .79 × 1. 112) – ($14 .57 × 1. 125 ×. 1250)
1 .0823
+
($3 .79 × 1. 113) – ($14 . 57 × 1. 1252×. 1250)
1. 0824
+
$14 . 57 × 1 .12503
1. 0824
+
($3 .79 × 1. 113× 1. 06 ) – ($14 . 57 × 1 .12503×. 0820)
1. 0824×(. 0820 – . 06 )
P0 = $148.90
CFA Exam Review by Kaplan Schweser
1. b
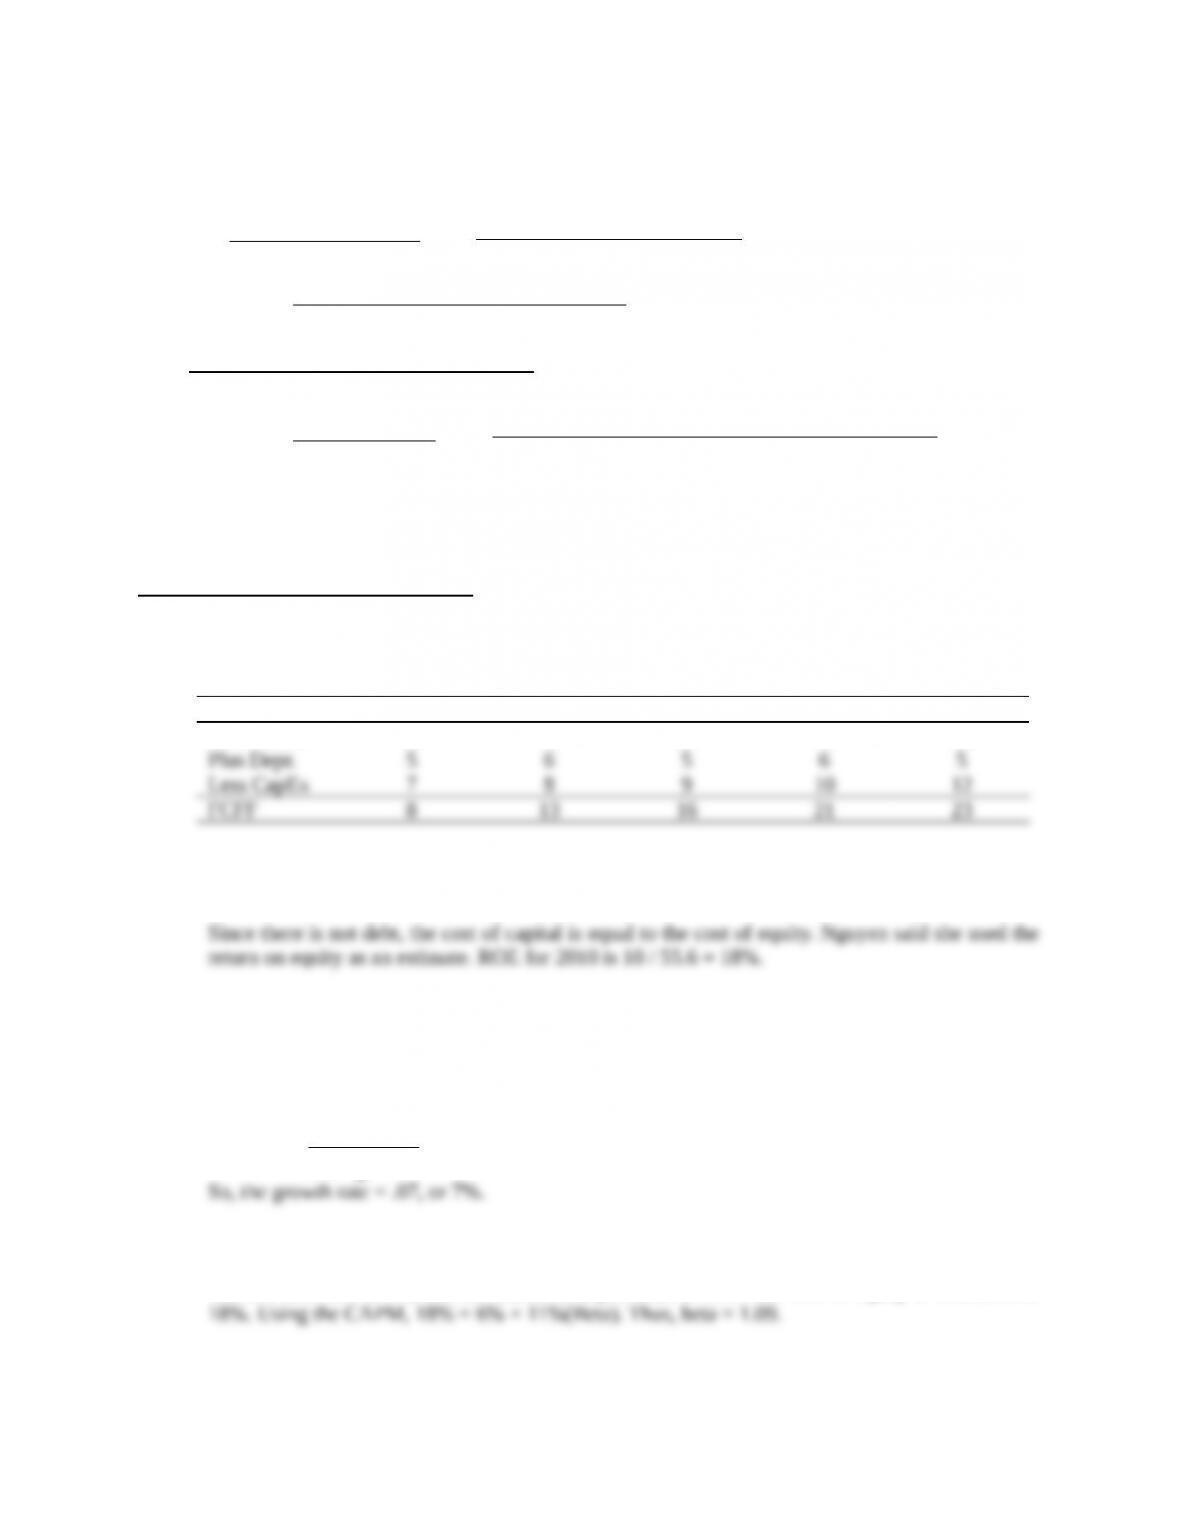
To estimate FCFF, we can construct the following table:
$ (millions) 2010 2011 2012 2013 2014
Net Income 10 15 20 25 30
2. a
3. a
The terminal value is $223.7 million. Free cash flow in 2014 is $23 million (from number 1
above). The formula for the terminal value is:
$223. 7=$23×(1+g)
.18−g
4. a
The risk free rate is 6%, and the market risk premium is 11%. The cost of equity is estimated at
5. b
Copyright © 2018 McGraw-Hill Education. All rights reserved. No reproduction or distribution without the prior written consent of McGraw-Hill
Education.

Copyright © 2018 McGraw-Hill Education. All rights reserved. No reproduction or distribution without the prior written consent of McGraw-Hill
Education.