Chapter 1
A Brief History of Risk and Return
Concept Questions
1. For both risk and return, increasing order is b, c, a, d. On average, the higher the risk of an
2. Since the price didn’t change, the capital gains yield was zero. If the total return was four percent,
3. It is impossible to lose more than –100 percent of your investment. Therefore, return distributions
4. To calculate an arithmetic return, you simply sum the returns and divide by the number of returns. As
such, arithmetic returns do not account for the effects of compounding (and, in particular, the effect
5. Blume’s formula uses the arithmetic and geometric returns along with the number of observations to
6. T–bill rates were highest in the early eighties since inflation at the time was relatively high. As we
7. Risk premiums are about the same whether or not we account for inflation. The reason is that risk
8. Returns, risk premiums, and volatility would all be lower than we estimated because aftertax returns
9. We have seen that T-bills barely kept up with inflation before taxes. After taxes, investors in T-bills
10. It is important not to lose sight of the fact that the results we have discussed cover over 80 years,
well beyond the investing lifetime for most of us. There have been extended periods during which
Copyright © 2018 McGraw-Hill Education. All rights reserved. No reproduction or distribution without the prior written consent of McGraw-Hill
Education.
Solutions to Questions and Problems
NOTE: All end of chapter problems were solved using a spreadsheet. Many problems require multiple
steps. Due to space and readability constraints, when these intermediate steps are included in this
solutions manual, rounding may appear to have occurred. However, the final answer for each problem is
found without rounding during any step in the problem.
Core Questions
1. Total dollar return = 100($41 – 37 + 0.28) = $428.00
2. Capital gains yield = ($41 – 37) / $37 = 10.81%
3. Dollar return = 500($34 – 37 + 0.28) = –$1,360
4. a. average return = 6.2%, average risk premium = 2.6%
6. Cherry: RA = 8.60%
Straw: RB = 10.20%
Copyright © 2018 McGraw-Hill Education. All rights reserved. No reproduction or distribution without the prior written consent of McGraw-Hill
Education.
Intermediate Questions
10. That’s plus or minus one standard deviation, so about two-thirds of the time, or two years out of
11. You lose money if you have a negative return. With a 12 percent expected return and a 6 percent
standard deviation, a zero return is two standard deviations below the average. The odds of being
12. The average return is 6.2 percent, with a standard deviation of 12.5 percent, so Prob( Return < –6.3
or Return > 18.7 ) ≈ 1/3, but we are only interested in one tail; Prob( Return < –6.3) ≈ 1/6, which is
half of 1/3 .
13. Expected return = 17.5% ; σ = 36.3%. Doubling your money is a 100% return, so if the return
distribution is normal, Z = (100 – 17.5)/36.3 = 2.27 standard deviations; this is in-between two and
14
.
Year Common stocks T–bill return Risk premium
1973 –14.69% 7.29% –21.98%
a. Annual risk premium = Common stock return – T-bill return (see table above).
c. Common stocks: Var = 1/4[ (–.1469 – .0257)2 + (–.2647 – .0257)2 + (.3723 – .0257)2 +
Standard deviation = (0.072337)1/2 = .2690 = 26.90%
Standard deviation = (.000156)1/2 = .0125 = 1.25%
Copyright © 2018 McGraw-Hill Education. All rights reserved. No reproduction or distribution without the prior written consent of McGraw-Hill
Education.
d. Before the fact, the risk premium will be positive; investors demand compensation over and
16. 5 year estimate = [(5 – 1)/(40 – 1)] × 10.24% + [(40 – 5)/(40 – 1)] × 12.60% = 12.36%
17. Small company stocks = ($24,113.43/ $1)1/90 – 1 = .1186, or 11.86%
Large company stocks = ($4,954.81 / $1)1/90 – 1 = .0991, or 9.91%
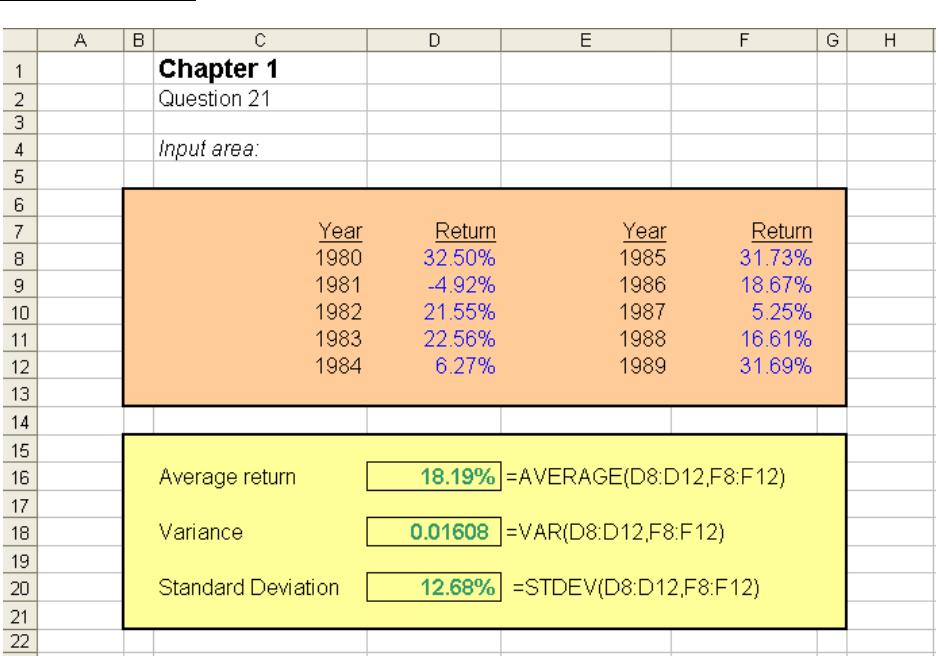
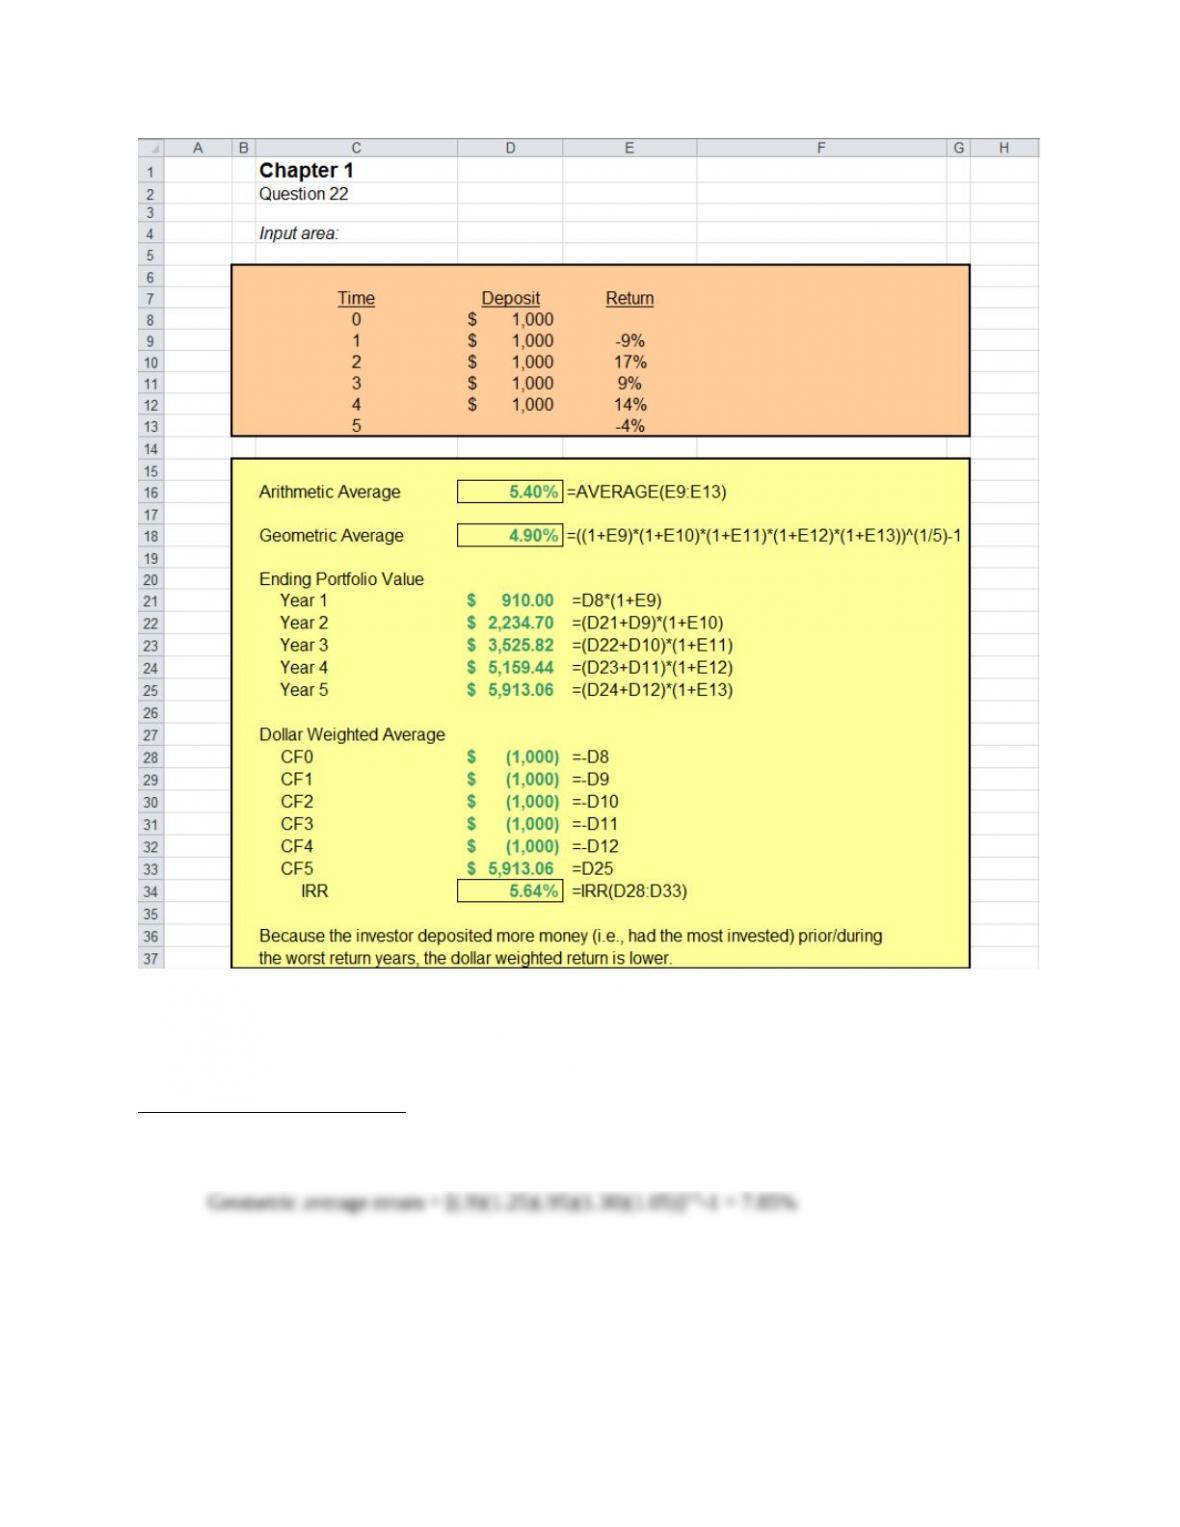
18. RA = (–.09 + .17 + .09 + .14 – .04) / 5 = .0540, or 5.40%
19. R1 = ($15.61 – 13.25 + 0.15) / $13.25 = 18.94%
R2 = ($16.72 – 15.61 + 0.18) / $15.61 = 8.26%
20. Stock A: RA = (.08 + .08 + .08 + .08 + .08) / 5 = .0800, or 8.00%
Standard deviation = (.000)1/2 = .000, or 0.00%
Standard deviation = (.001900)1/2 = .0436, or 4.36%
Stock C: RA = (–.24 + .37 + .14 + .09 + .04) / 5 = .0800. or 8.00%
Standard deviation = (.047950)1/2 = .2190, or 21.90%
The larger the standard deviation, the greater will be the difference between the arithmetic return and
Copyright © 2018 McGraw-Hill Education. All rights reserved. No reproduction or distribution without the prior written consent of McGraw-Hill
Education.
Spreadsheet Problems
Copyright © 2018 McGraw-Hill Education. All rights reserved. No reproduction or distribution without the prior written consent of McGraw-Hill
Education.
CFA Exam Review by Schweser
1. a
Copyright © 2018 McGraw-Hill Education. All rights reserved. No reproduction or distribution without the prior written consent of McGraw-Hill
Education.
2. b
Scenario 2 Scenario 3
CF0-100 -100
CF1 0 0
Scenario 2 Ending MV
Scenario 3 Ending MV
3. c
4. b
Geometric returns provide the best estimate of a portfolio manager’s return because it neutralizes
Copyright © 2018 McGraw-Hill Education. All rights reserved. No reproduction or distribution without the prior written consent of McGraw-Hill
Education.