Unlock document.
This document is partially blurred.
Unlock all pages and 1 million more documents.
Get Access
14. This is a multi-step problem involving several ratios. It is often easier to look backward to determine
where to start. We need receivables turnover to find days’ sales in receivables. To calculate
receivables turnover, we need credit sales, and to find credit sales, we need total sales. Since we are
given the profit margin and net income, we can use these to calculate total sales as:
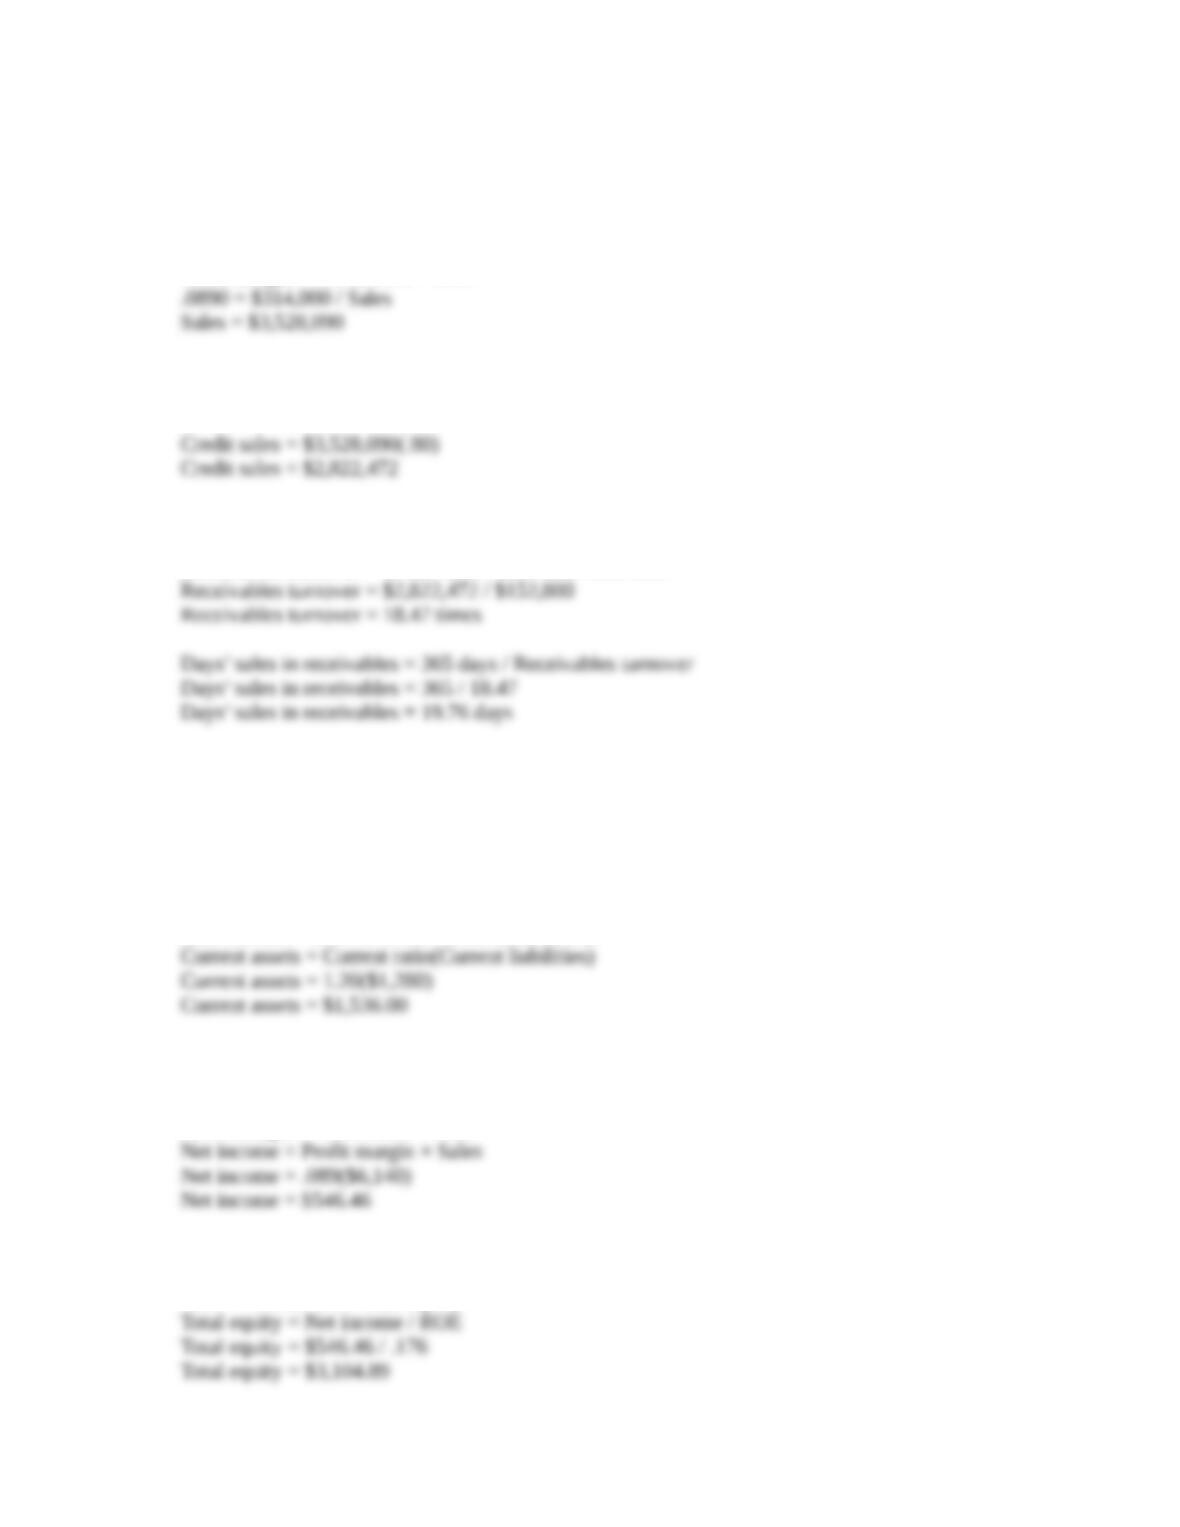
Profit margin = Net income / Sales
Credit sales are 80 percent of total sales, so:
Now we can find receivables turnover by:
Receivables turnover = Credit sales / Accounts receivable
15. The solution to this problem requires a number of steps. First, remember that:
Current assets + Net fixed assets = Total assets
So, if we find the current assets and the total assets, we can solve for net fixed assets. Using the
numbers given for the current ratio and the current liabilities, we solve for current assets:
Current ratio = Current assets / Current liabilities
To find the total assets, we must first find the total debt and equity from the information given. So,
we find the net income using the profit margin:
Profit margin = Net income / Sales
We now use the net income figure as an input into ROE to find the total equity:
ROE = Net income / Total equity
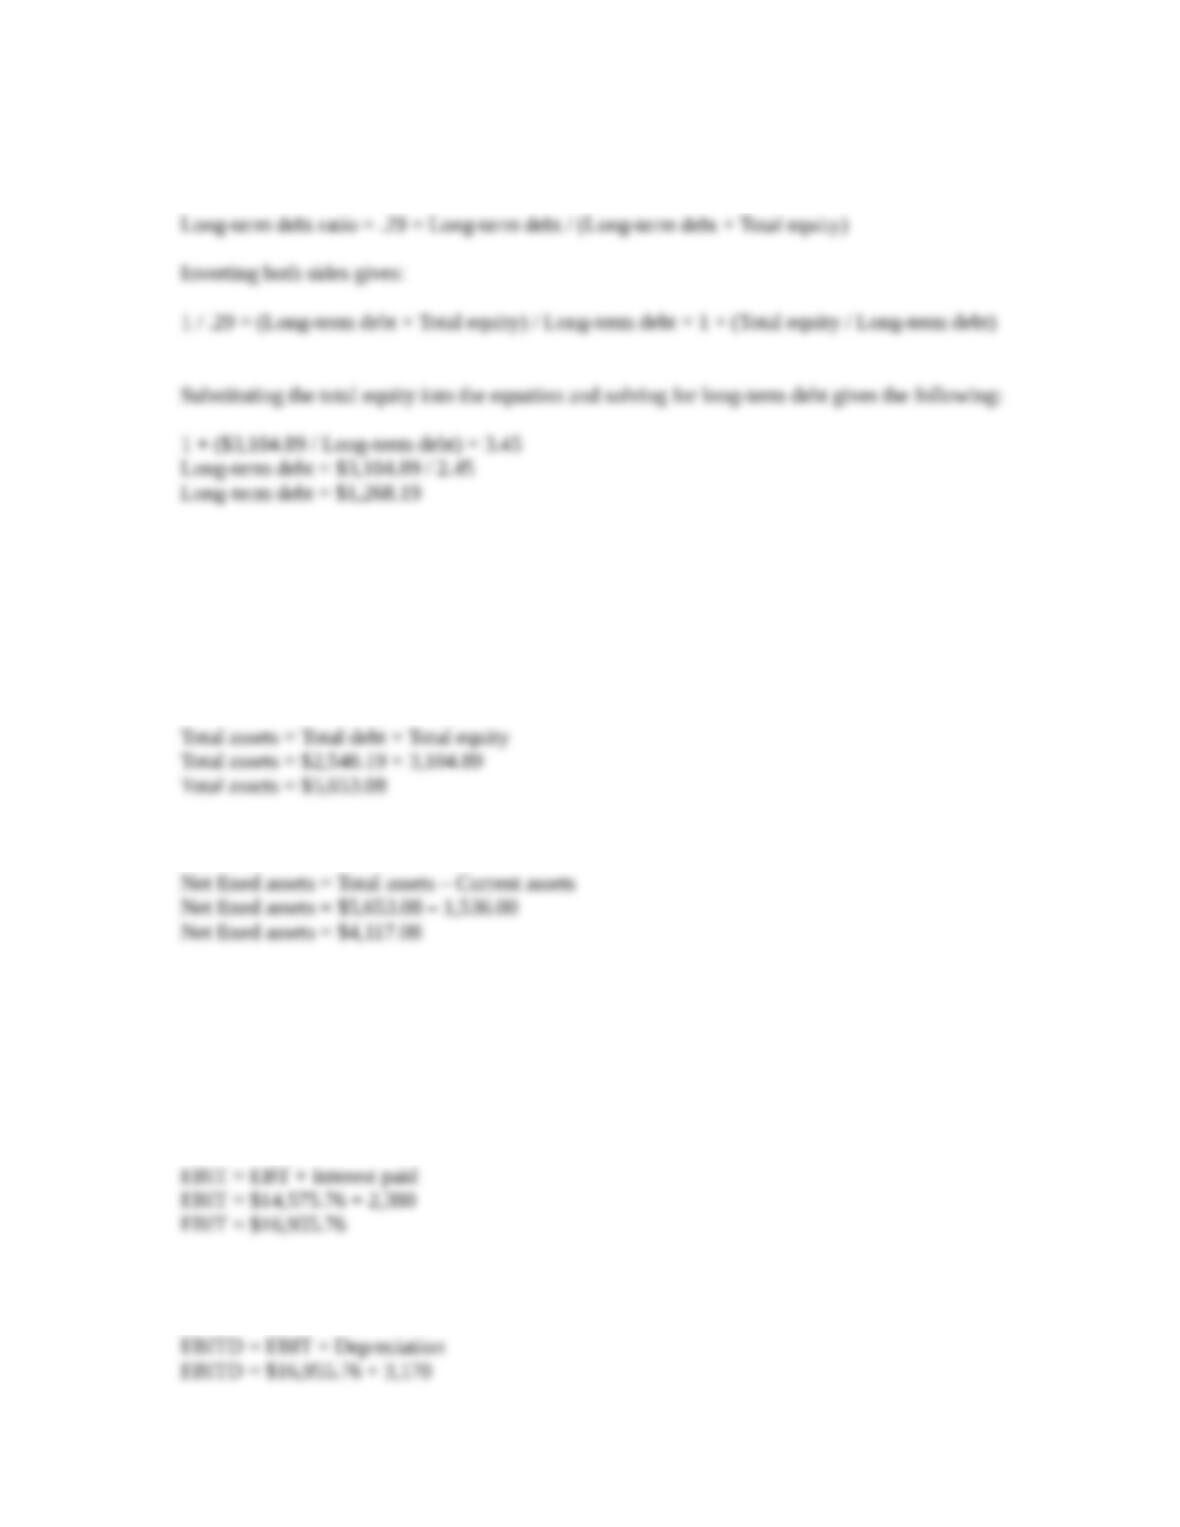
Next, we need to find the long-term debt. The long-term debt ratio is:
Now, we can find the total debt of the company:
Total debt = Current liabilities + Long-term debt
Total debt = $1,280 + 1,268.19
Total debt = $2,548.19
And, with the total debt, we can find the total debt & equity, which is equal to total assets:
And finally, we are ready to solve the balance sheet identity as:
16. This problem requires you to work backward through the income statement. First, recognize that
Net income = (1 – tC)EBT. Plugging in the numbers given and solving for EBT, we get:
EBT = $9,620 / (1 – .34)
EBT = $14,575.76
Now, we can add interest to EBT to get EBIT as follows:
To get EBITD (earnings before interest, taxes, and depreciation), the numerator in the cash coverage
ratio, add depreciation to EBIT:
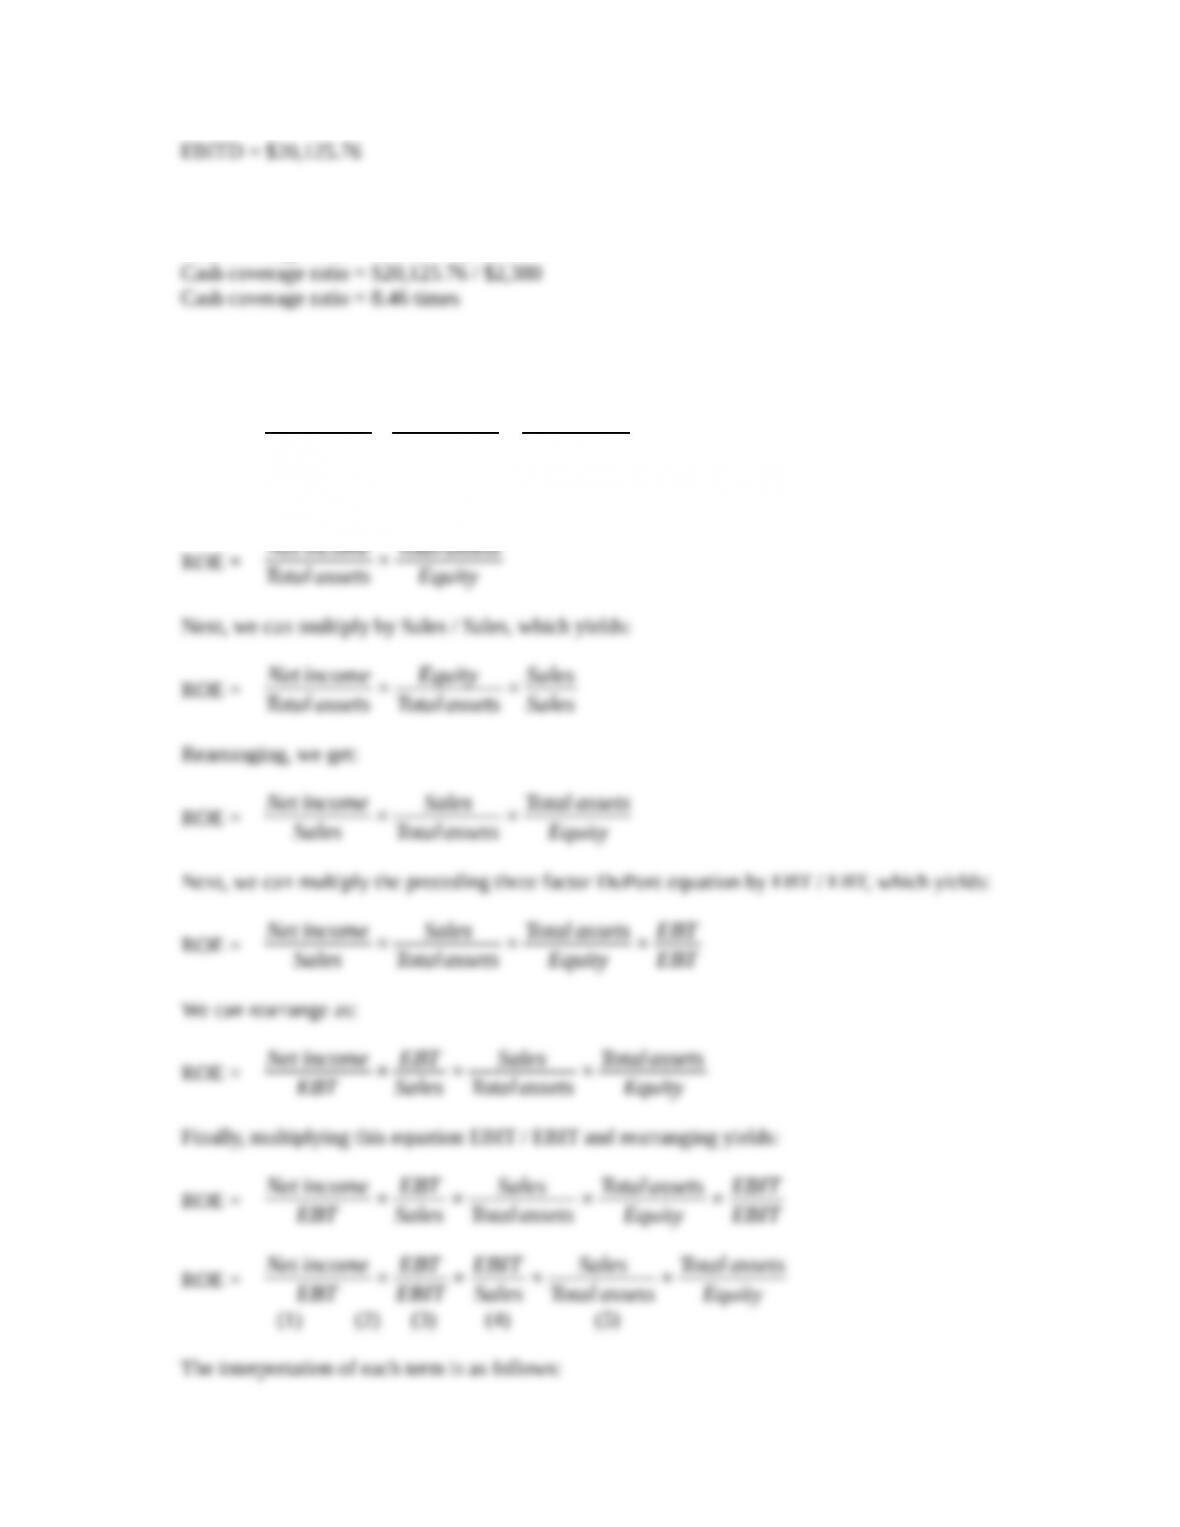
Now, plug the numbers into the cash coverage ratio and calculate:
Cash coverage ratio = EBITD / Interest
17. We can start by multiplying ROE by Total assets / Total assets
ROE =
Net income
Equity =Net income
Equity ×Totalassets
Total assets
Rearranging, we get:
Net income
Sales ×Sales
Total assets ×Total assets
Equity ×EBT
EBT
We can rearrange as:
ROE =
Net income
EBT ×EBT
Sales ×Sales
Total assets ×Total assets
Equity
Finally, multiplying this equation EBIT / EBIT and rearranging yields:
Net income
EBT ×EBT
Sales ×Sales
Total assets ×Total assets
Equity ×EBIT
EBIT
ROE =
Net income
EBT ×EBT
EBIT ×EBIT
Sales ×Sales
Total assets ×Total assets
Equity
(1) (2) (3) (4) (5)
The interpretation of each term is as follows:
(1) This is the company's tax burden. This is the proportion of the company's profits retained after
paying income taxes.
(2) This is the company’s interest burden. It will be 1.00 for a company with no debt or financial
leverage.
18. 2014
Common
size 2015
Common
size
Common
base year
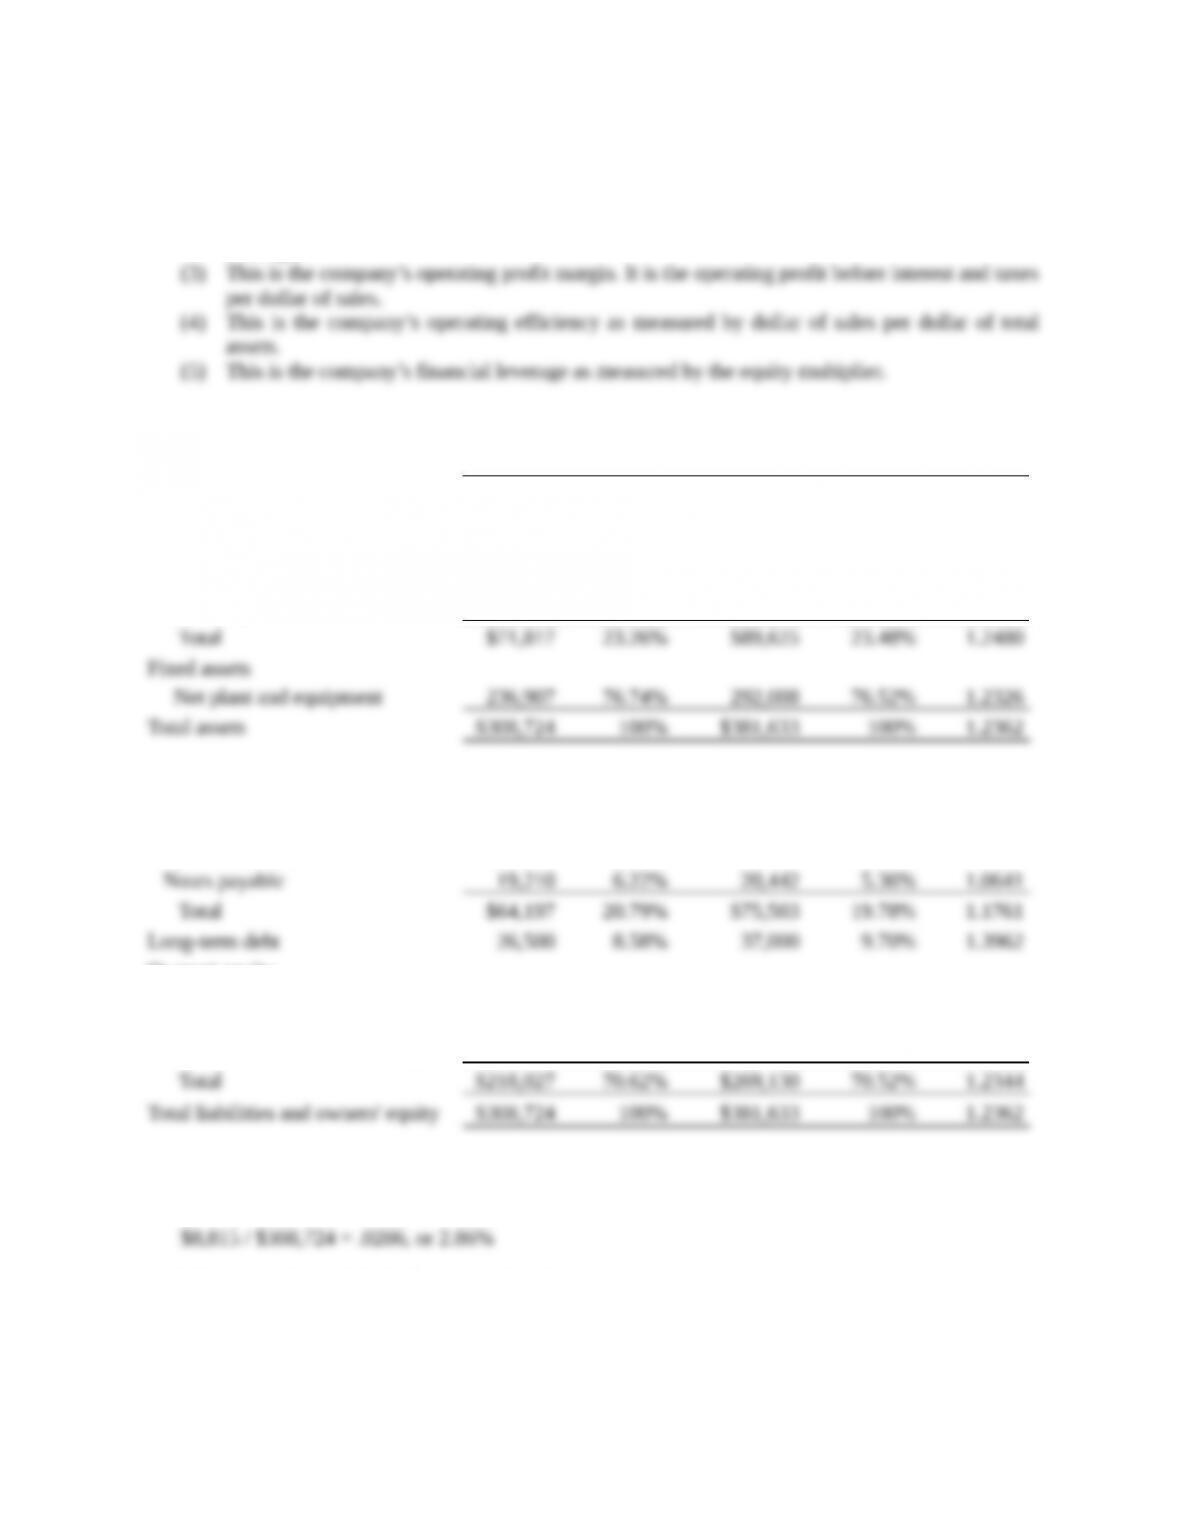
Assets
Current assets
Cash $8,815 2.86% $11,945 3.13% 1.3551
Accounts receivable 22,498 7.29% 27,524 7.21% 1.2234
Inventory 40,504 13.12% 50,156 13.14% 1.2383
Liabilities and Owners’ Equity
Current liabilities
Accounts payable $44,987 14.57% $55,061 14.43% 1.2239
Owners' equity
Common stock and paid-in
surplus $42,000 13.60% $43,500 11.40% 1.0357
Accumulated retained earnings 176,027 57.02% 225,630 59.12% 1.2818
The common-size balance sheet answers are found by dividing each category by total assets. For
example, the cash percentage for 2014 is:
This means that cash is 2.86 percent of total assets.
The common-base year answers for Question 18 are found by dividing each category value for 2015
by the same category value for 2014. For example, the cash common-base year number is found by:
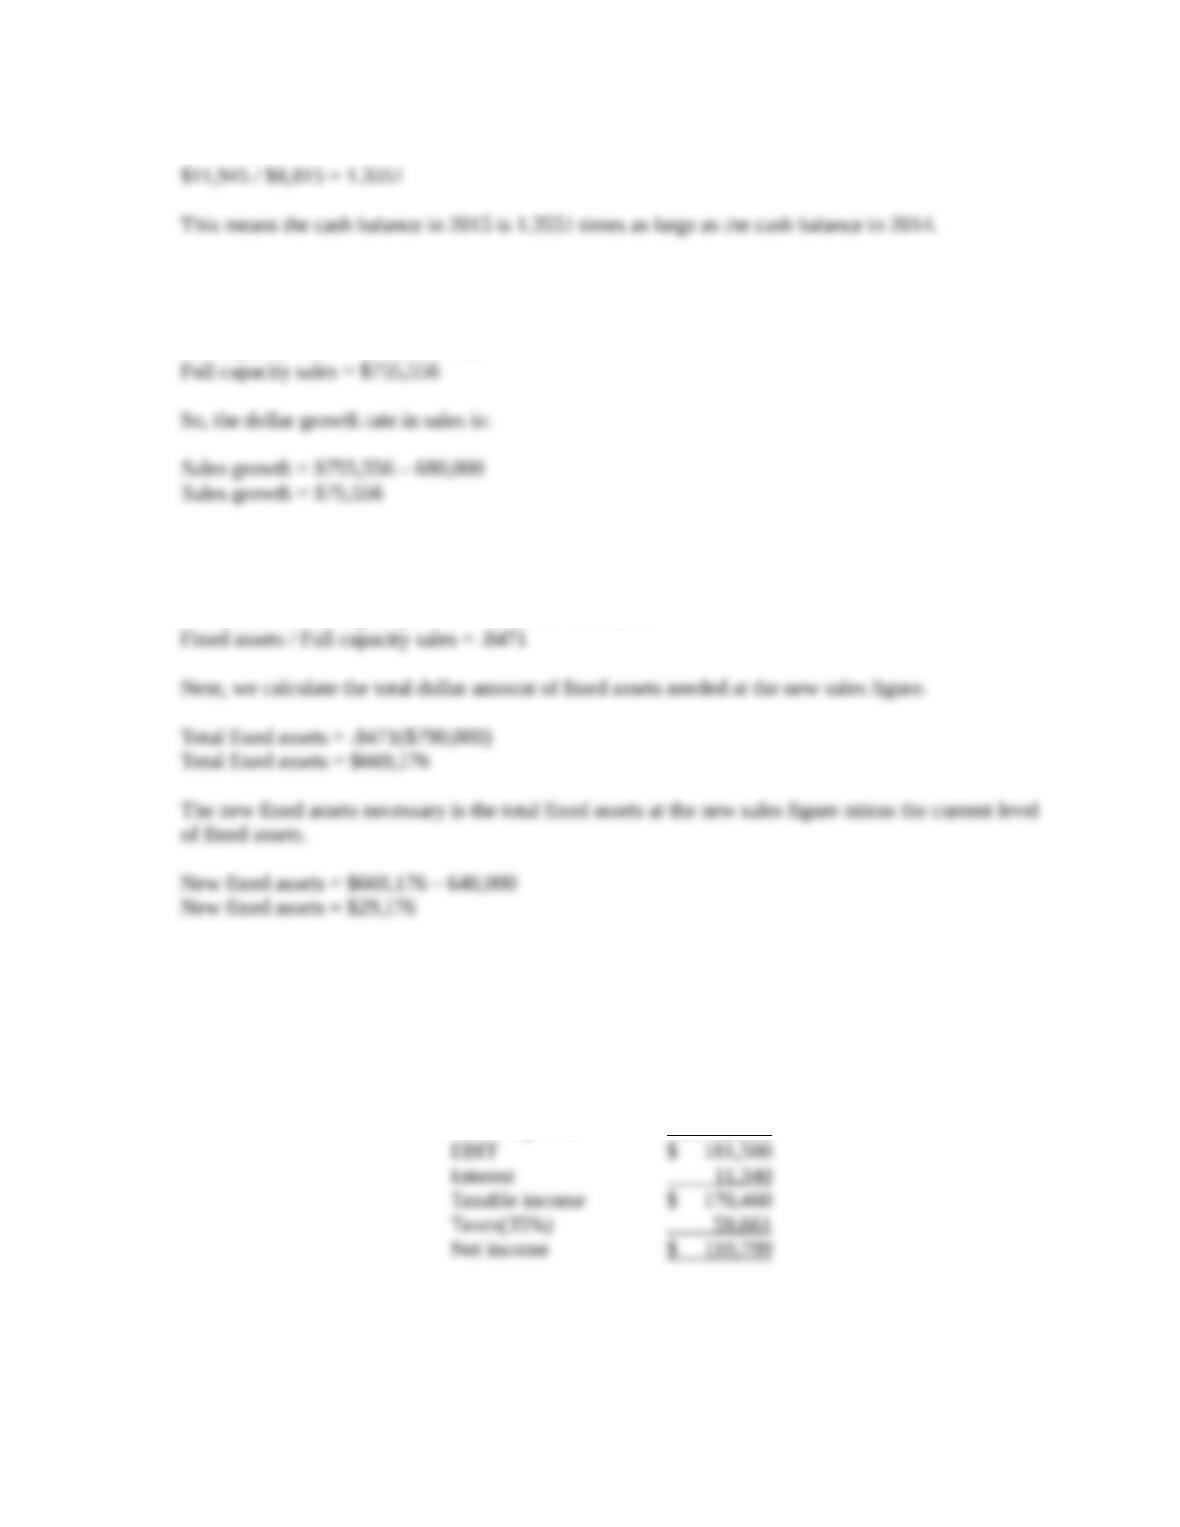
19. To determine full capacity sales, we divide the current sales by the capacity the company is currently
using, so:
Full capacity sales = $680,000 / .90
20. To find the new level of fixed assets, we need to find the current percentage of fixed assets to full
capacity sales. Doing so, we find:
Fixed assets / Full capacity sales = $640,000 / $755,556
21. Assuming costs vary with sales and a 20 percent increase in sales, the pro forma income statement
will look like this:
MOOSE TOURS INC.
Pro Forma Income Statement
Sales $ 903,000
Costs 702,720
Other expenses 18,480
The payout ratio is constant, so the dividends paid this year is the payout ratio from last year times
net income, or:
Dividends = ($27,331 / $91,104)($110,799)
Dividends = $33,239
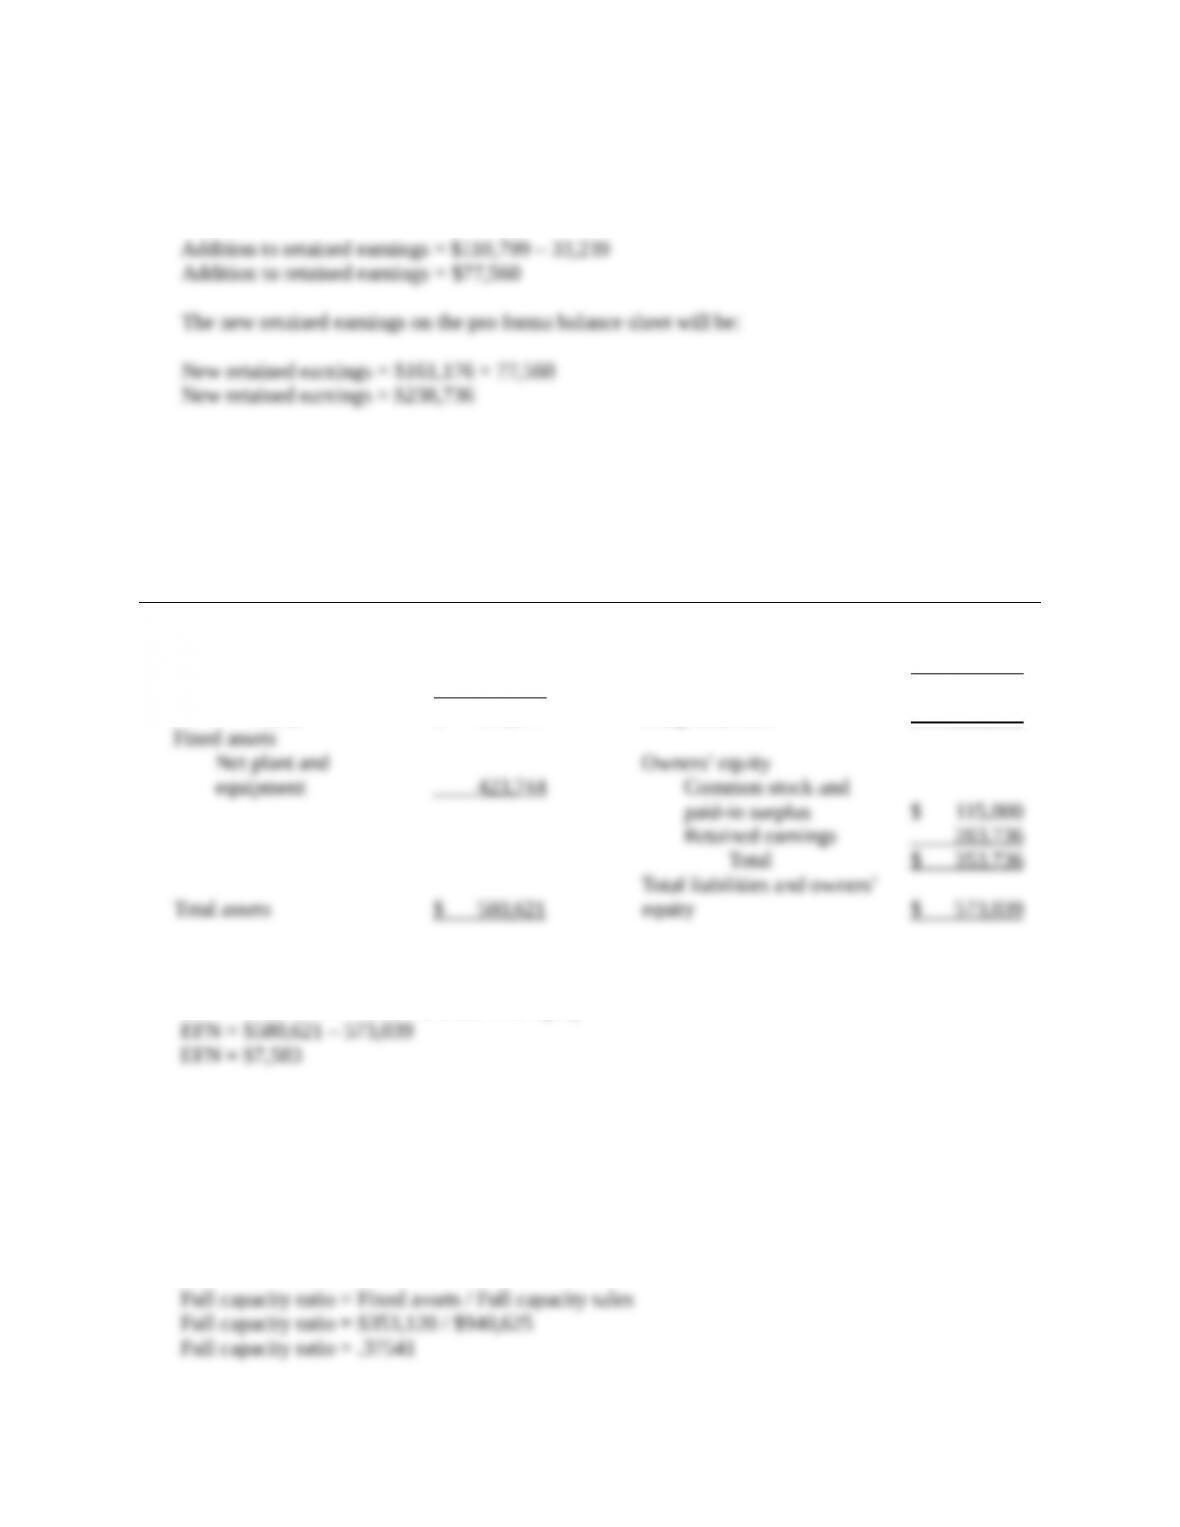
And the addition to retained earnings will be:
The pro forma balance sheet will look like this:
MOOSE TOURS INC.
Pro Forma Balance Sheet
Assets Liabilities and Owners’ Equity
Current assets Current liabilities
Cash $ 25,958 Accounts payable $ 69,768
Accounts receivable 41,759 Notes payable 14,535
Inventory 89,160 Total $ 84,303
Total $ 156,877 Long-term debt 135,000
So the EFN is:
EFN = Total assets – Total liabilities and equity
22. First, we need to calculate full capacity sales, which is:
Full capacity sales = $752,500 / .80
Full capacity sales = $940,625
The full capacity ratio at full capacity sales is:
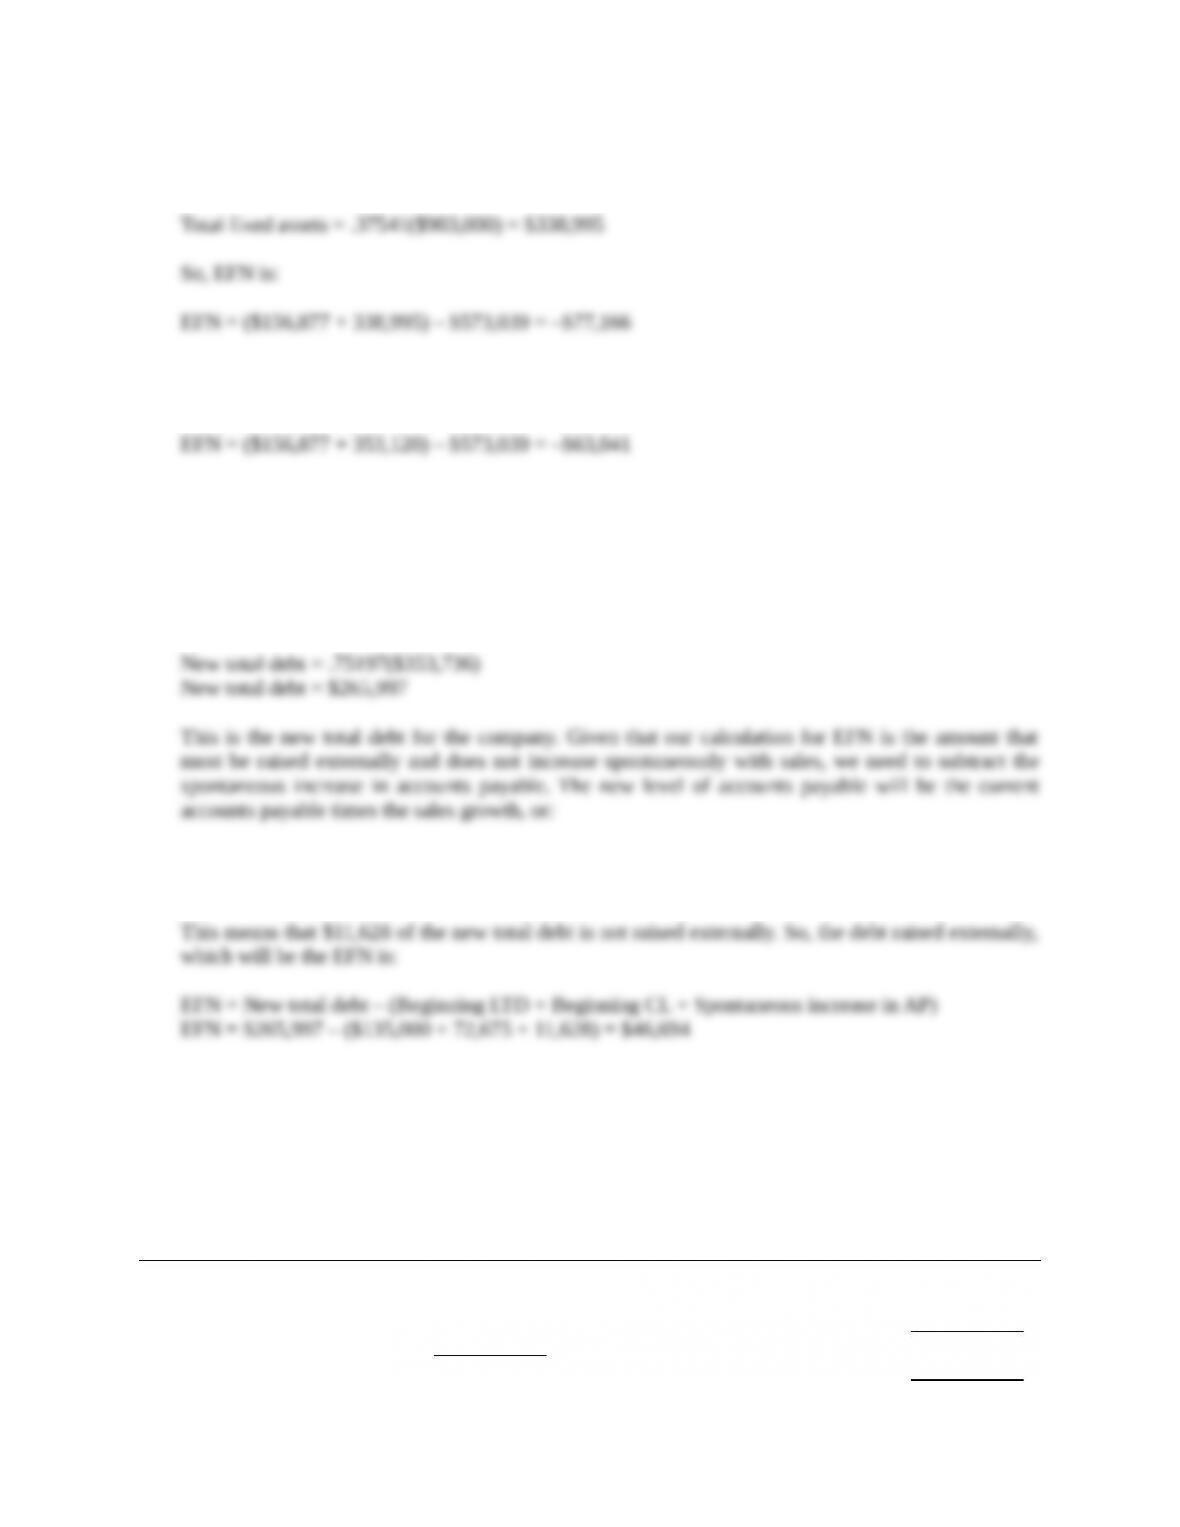
The fixed assets required at full capacity sales is the full capacity ratio times the projected sales
level:
Note that this solution assumes that fixed assets are decreased (sold) so the company has a 100
percent fixed asset utilization. If we assume fixed assets are not sold, the answer becomes:
23. The D/E ratio of the company is:
D/E = ($72,675 + 135,000) / $276,176
D/E = .75197
So the new total debt amount will be:
Spontaneous increase in accounts payable = $58,140(.20)
Spontaneous increase in accounts payable = $11,628
The pro forma balance sheet with the new long-term debt will be:
MOOSE TOURS INC.
Pro Forma Balance Sheet
Assets Liabilities and Owners’ Equity
Current assets Current liabilities
Cash $ 25,958 Accounts payable $ 69,768
Accounts receivable 41,759 Notes payable 14,535
Inventory 89,160 Total $ 84,303
Total $ 156,877 Long-term debt 181,694
The funds raised by the debt issue can be put into an excess cash account to make the balance sheet
balance. The excess debt will be:
Excess debt = $580,621 – 619,733 = $39,111
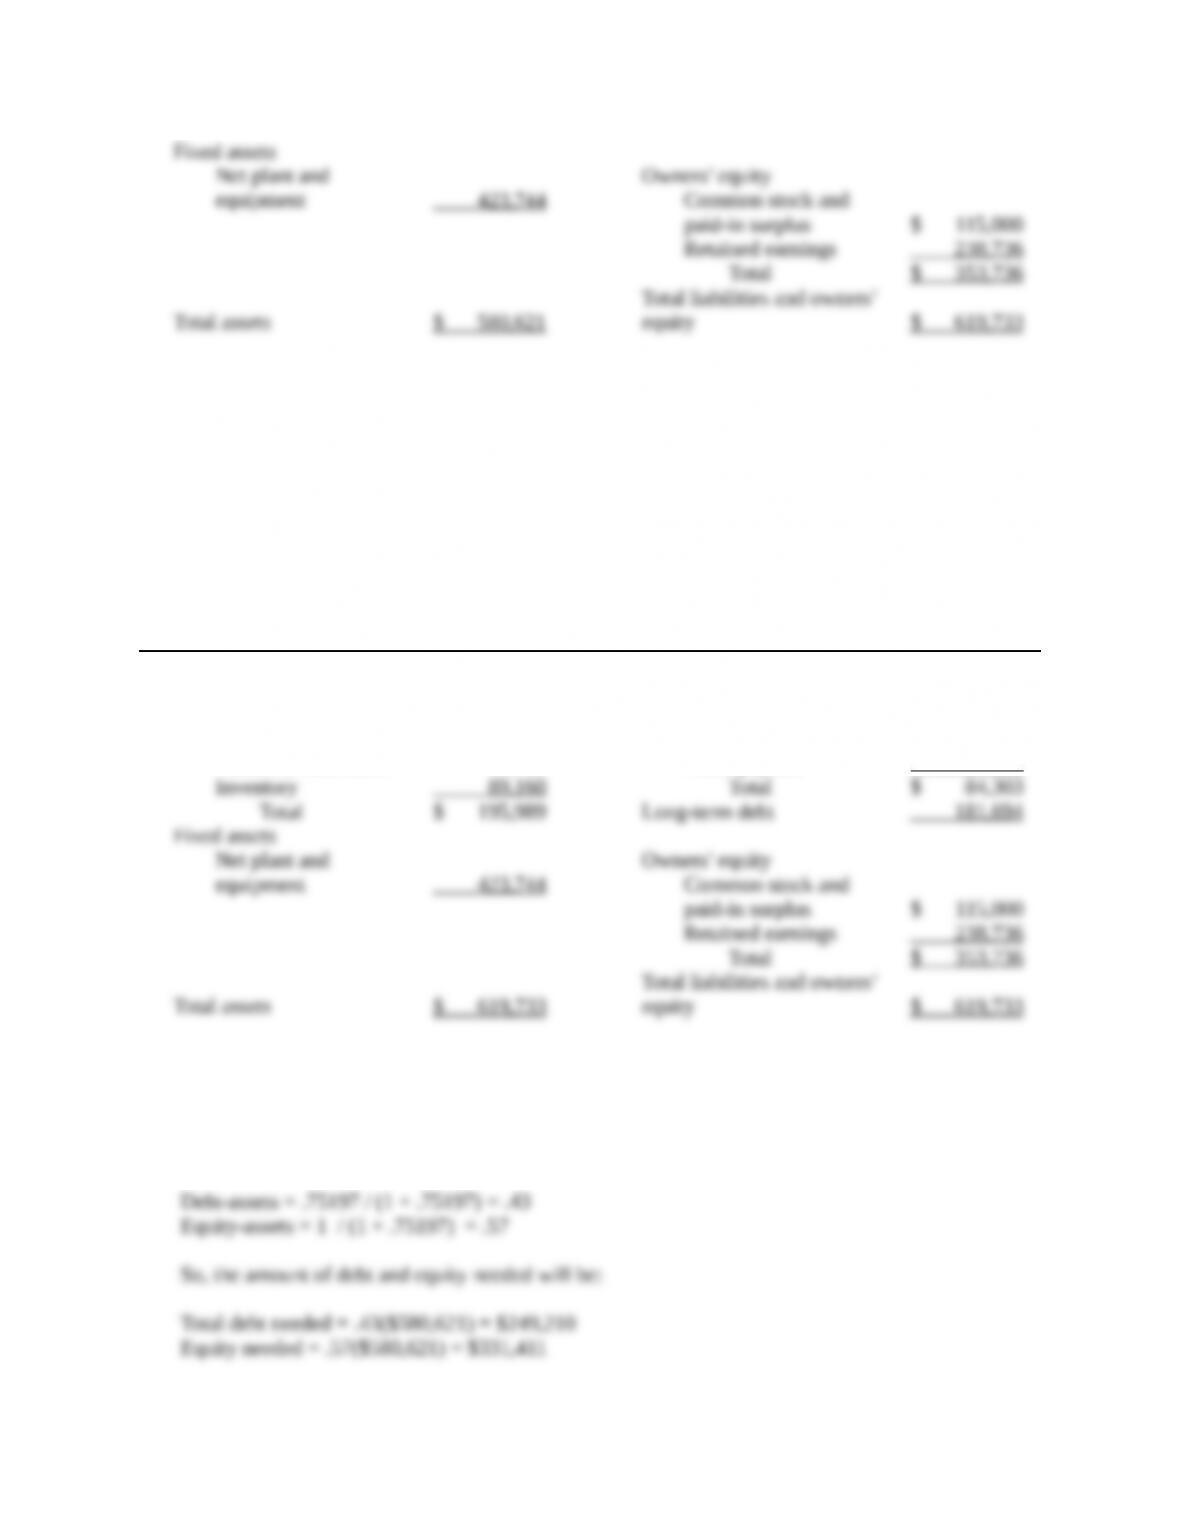
To make the balance sheet balance, the company will have to increase its assets. We will put this
amount in an account called excess cash, which will give us the following balance sheet:
MOOSE TOURS INC.
Pro Forma Balance Sheet
Assets Liabilities and Owners’ Equity
Current assets Current liabilities
Cash $ 25,958 Accounts payable $ 69,768
Excess cash 39,111
Accounts receivable 41,759 Notes payable 14,535
The excess cash has an opportunity cost that we discussed earlier. Increasing fixed assets would also
not be a good idea since the company already has enough fixed assets. A likely scenario would be the
repurchase of debt and equity in its current capital structure weights. The company’s debt-assets and
equity-assets are:
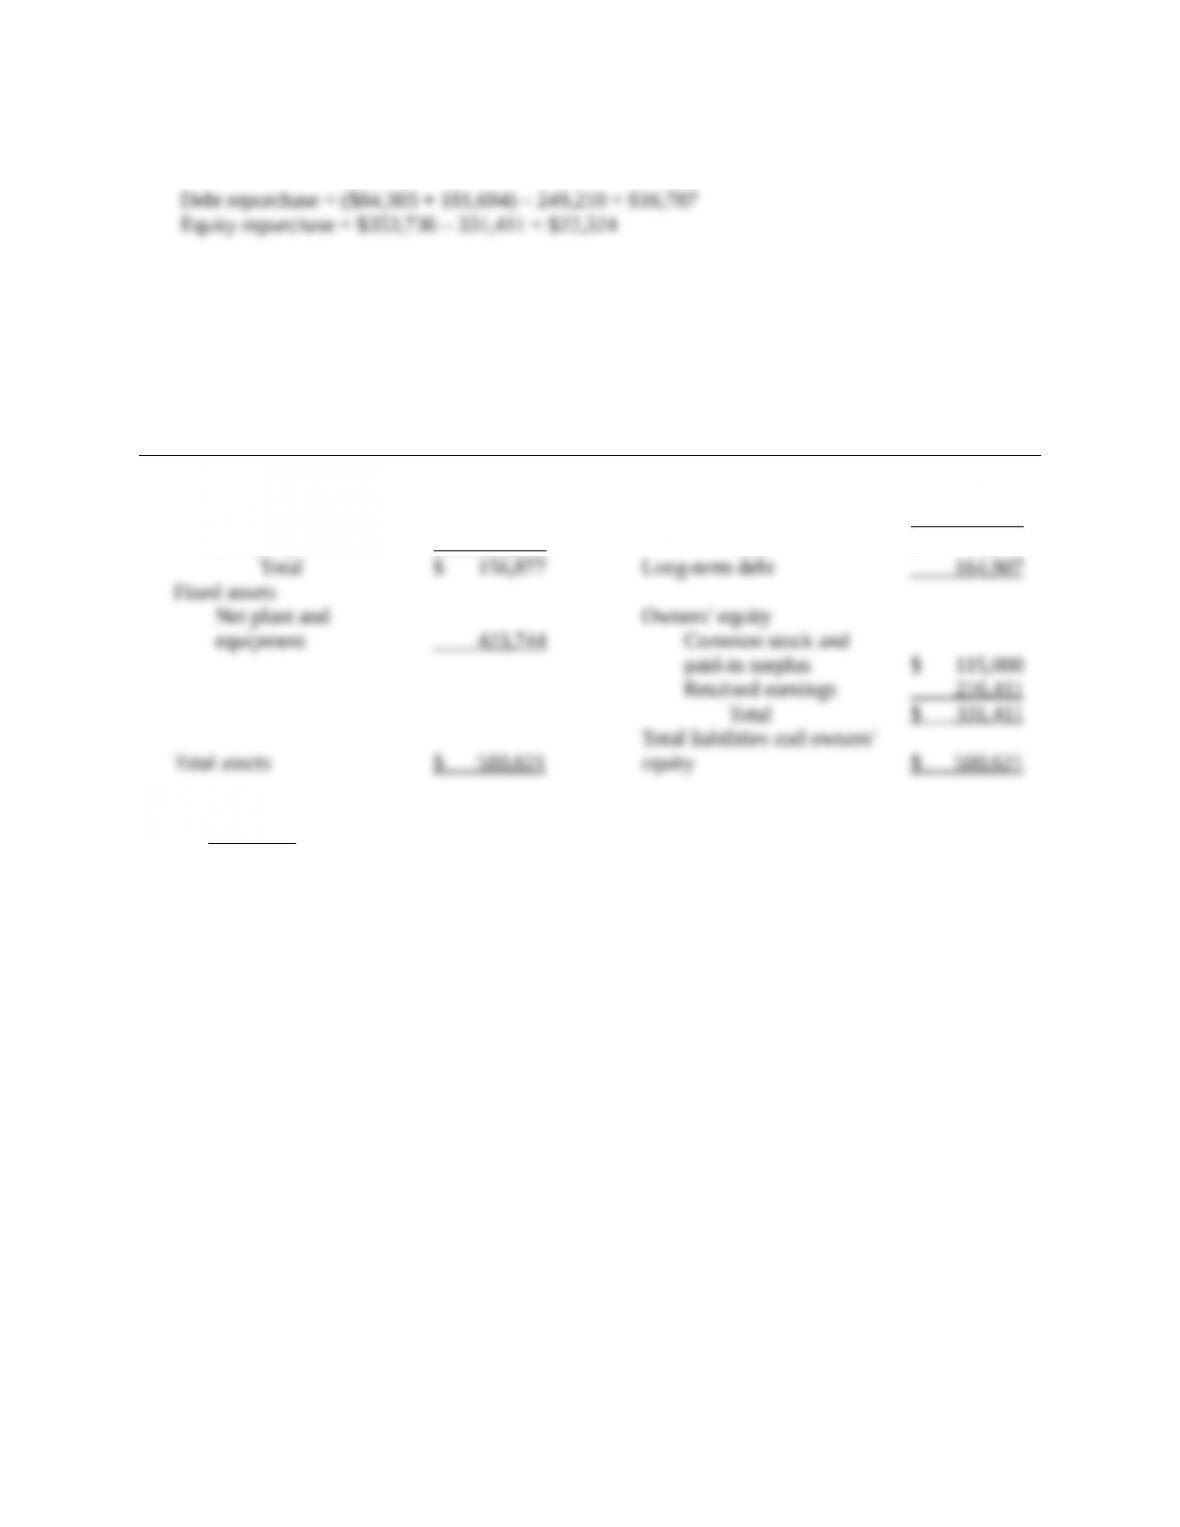
So, the repurchases of debt and equity will be:
Assuming all of the debt repurchase is from long-term debt, and the equity repurchase is entirely
from the retained earnings, the final pro forma balance sheet will be:
MOOSE TOURS INC.
Pro Forma Balance Sheet
Assets Liabilities and Owners’ Equity
Current assets Current liabilities
Cash $ 25,958 Accounts payable $ 69,768
Accounts receivable 41,759 Notes payable 14,535
Inventory 89,160 Total $ 84,303
Challenge


