CHAPTER 11 –
31. First, we can calculate the standard deviation of the market portfolio using the Capital Market Line
(CML). We know that the risk-free asset has a return of 4.3 percent and a standard deviation of zero
and the portfolio has an expected return of 8 percent and a standard deviation of 17 percent. These
two points must lie on the Capital Market Line. The slope of the Capital Market Line equals:
Since we know the expected return on the market portfolio, the risk-free rate, and the slope of the
Capital Market Line, we can solve for the standard deviation of the market portfolio which is:
Next, we can use the standard deviation of the market portfolio to solve for the beta of a security
using the beta equation. Doing so, we find the beta of the security is:
32. First, we need to find the standard deviation of the market and the portfolio, which are:
Now we can use the equation for beta to find the beta of the portfolio, which is:
Now, we can use the CAPM to find the expected return of the portfolio, which is:
1
CHAPTER 11 –
Challenge
33. The amount of systematic risk is measured by the of an asset. Since we know the market risk
premium and the risk-free rate, if we know the expected return of the asset we can use the CAPM to
solve for the of the asset. The expected return of Stock I is:
The total risk of an asset is measured by its standard deviation, so we need to calculate the standard
deviation of Stock I. Beginning with the calculation of the stock’s variance, we find:
And the standard deviation of Stock II is:
Although Stock II has more total risk than I, it has much less systematic risk, since its beta is much
smaller than I’s. Thus, I has more systematic risk, and II has more unsystematic and more total risk.
34. Here we have the expected return and beta for two assets. We can express the returns of the two
assets using CAPM. If the CAPM is true, then the security market line holds as well, which means
all assets have the same risk premium. Setting the reward-to-risk ratios of the assets equal to each
other and solving for the risk-free rate, we find:
2
CHAPTER 11 –
35. a. The expected return of an asset is the sum of the probability of each state occurring times the
rate of return if that state occurs. To calculate the standard deviation, we first need to calculate
the variance. To find the variance, we find the squared deviations from the expected return. We
then multiply each possible squared deviation by its probability, and then add all of these up.
The result is the variance. So, the expected return and standard deviation of each stock are:
Asset 1:
Asset 2:
Asset 3:
b. To find the covariance, we multiply each possible state times the product of each asset’s
deviation from the mean in that state. The sum of these products is the covariance. The
correlation is the covariance divided by the product of the two standard deviations. So, the
covariance and correlation between each possible set of assets are:
Asset 1 and Asset 2:
3
CHAPTER 11 –
Asset 1 and Asset 3:
Asset 2 and Asset 3:
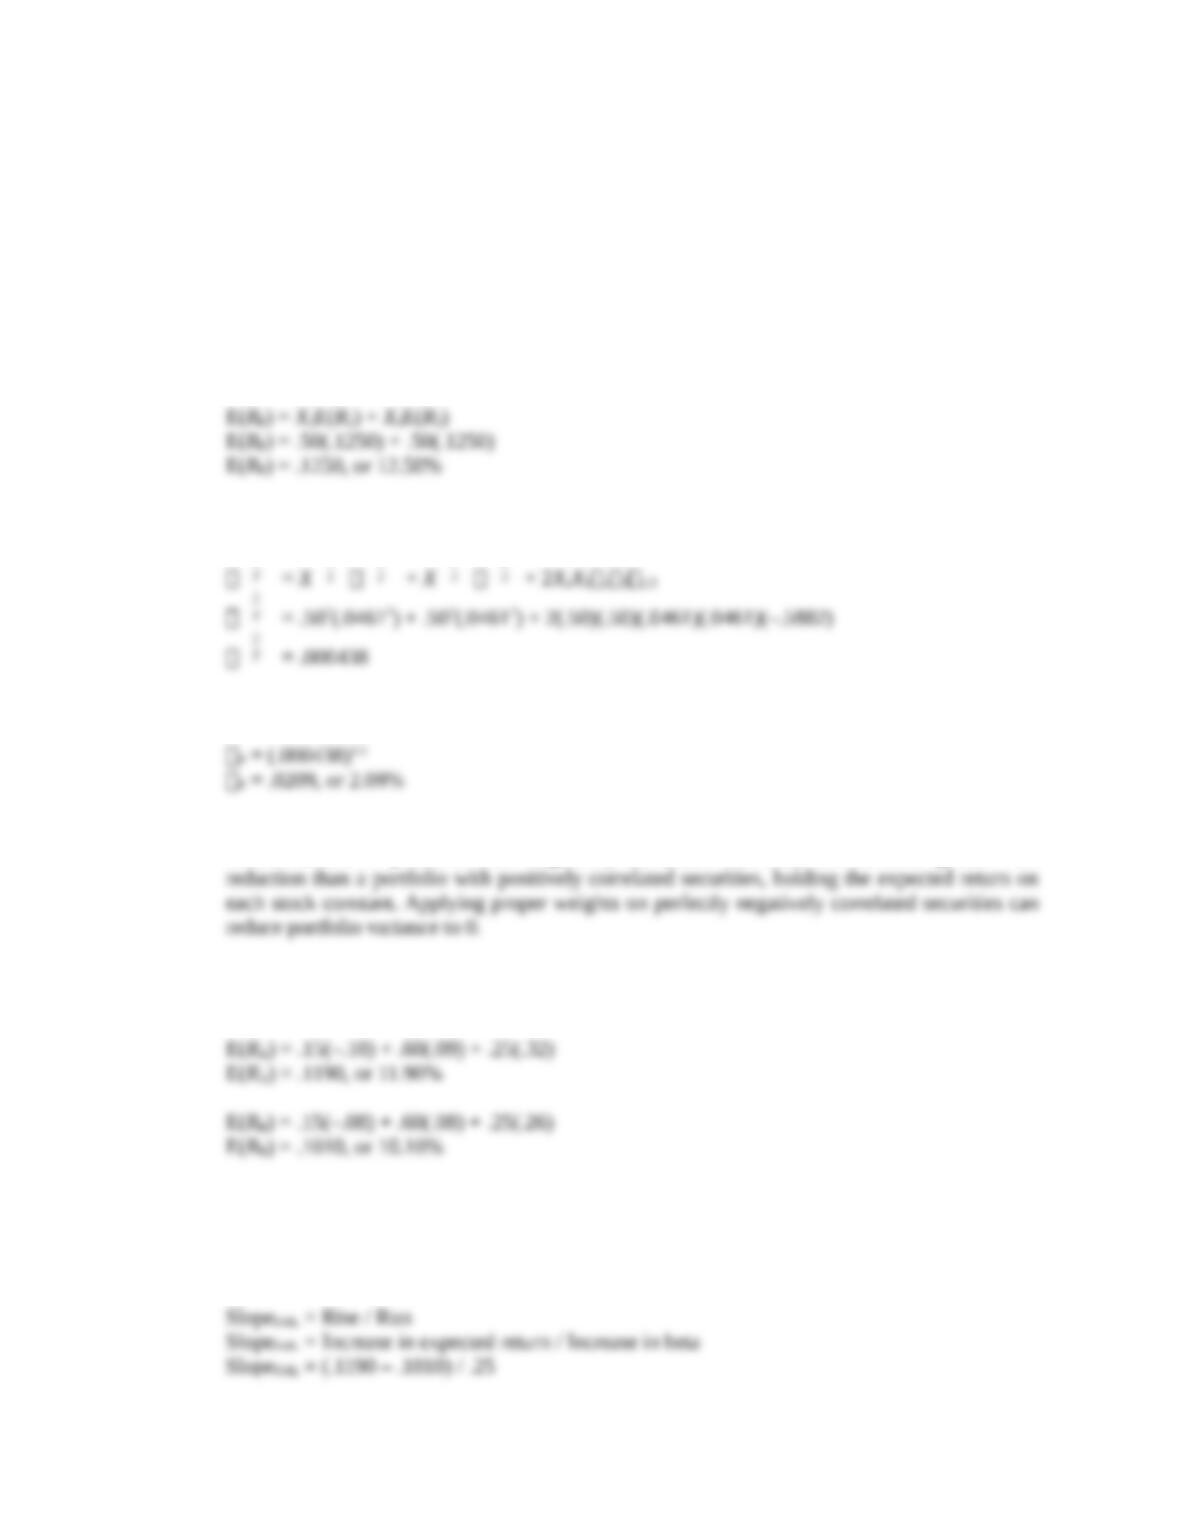
c. The expected return of the portfolio is the sum of the weight of each asset times the expected
return of each asset, so, for a portfolio of Asset 1 and Asset 2:
The variance of a portfolio of two assets can be expressed as:
2
2
2
2
2
2
And the standard deviation of the portfolio is:
d. The expected return of the portfolio is the sum of the weight of each asset times the expected
return of each asset, so, for a portfolio of Asset 1 and Asset 3:
The variance of a portfolio of two assets can be expressed as:
4
CHAPTER 11 –
P
2
= X
1
2
1
2
+ X
3
2
3
2
+ 2X1X3131,3
P
2
= .502(.04612) + .502(.04612) + 2(.50)(.50)(.0461)(.0461)(–1)
P
2
= .000000
Since the variance is zero, the standard deviation is also zero.
e. The expected return of the portfolio is the sum of the weight of each asset times the expected
return of each asset, so, for a portfolio of Asset 2 and Asset 3:
The variance of a portfolio of two assets can be expressed as:
P
2
= X
2
2
2
2
+ X
3
2
3
2
+ 2X2X3232,3
P
2
= .502(.04612) + .502(.04612) + 2(.50)(.50)(.0461)(.0461)(–.5882)
P
2
= .000438
And the standard deviation of the portfolio is:
f. As long as the correlation between the returns on two securities is below 1, there is a benefit to
diversification. A portfolio with negatively correlated securities can achieve greater risk
36. a. The expected return of an asset is the sum of the probability of each state occurring times the
rate of return if that state occurs. So, the expected return of each stock is:
b. We can use the expected returns we calculated to find the slope of the Security Market Line. We
know that the beta of Stock A is .25 greater than the beta of Stock B. Therefore, as beta
increases by .25, the expected return on a security increases by .018 (= .1190 – .1010). The
slope of the security market line (SML) equals:
5
CHAPTER 11 –
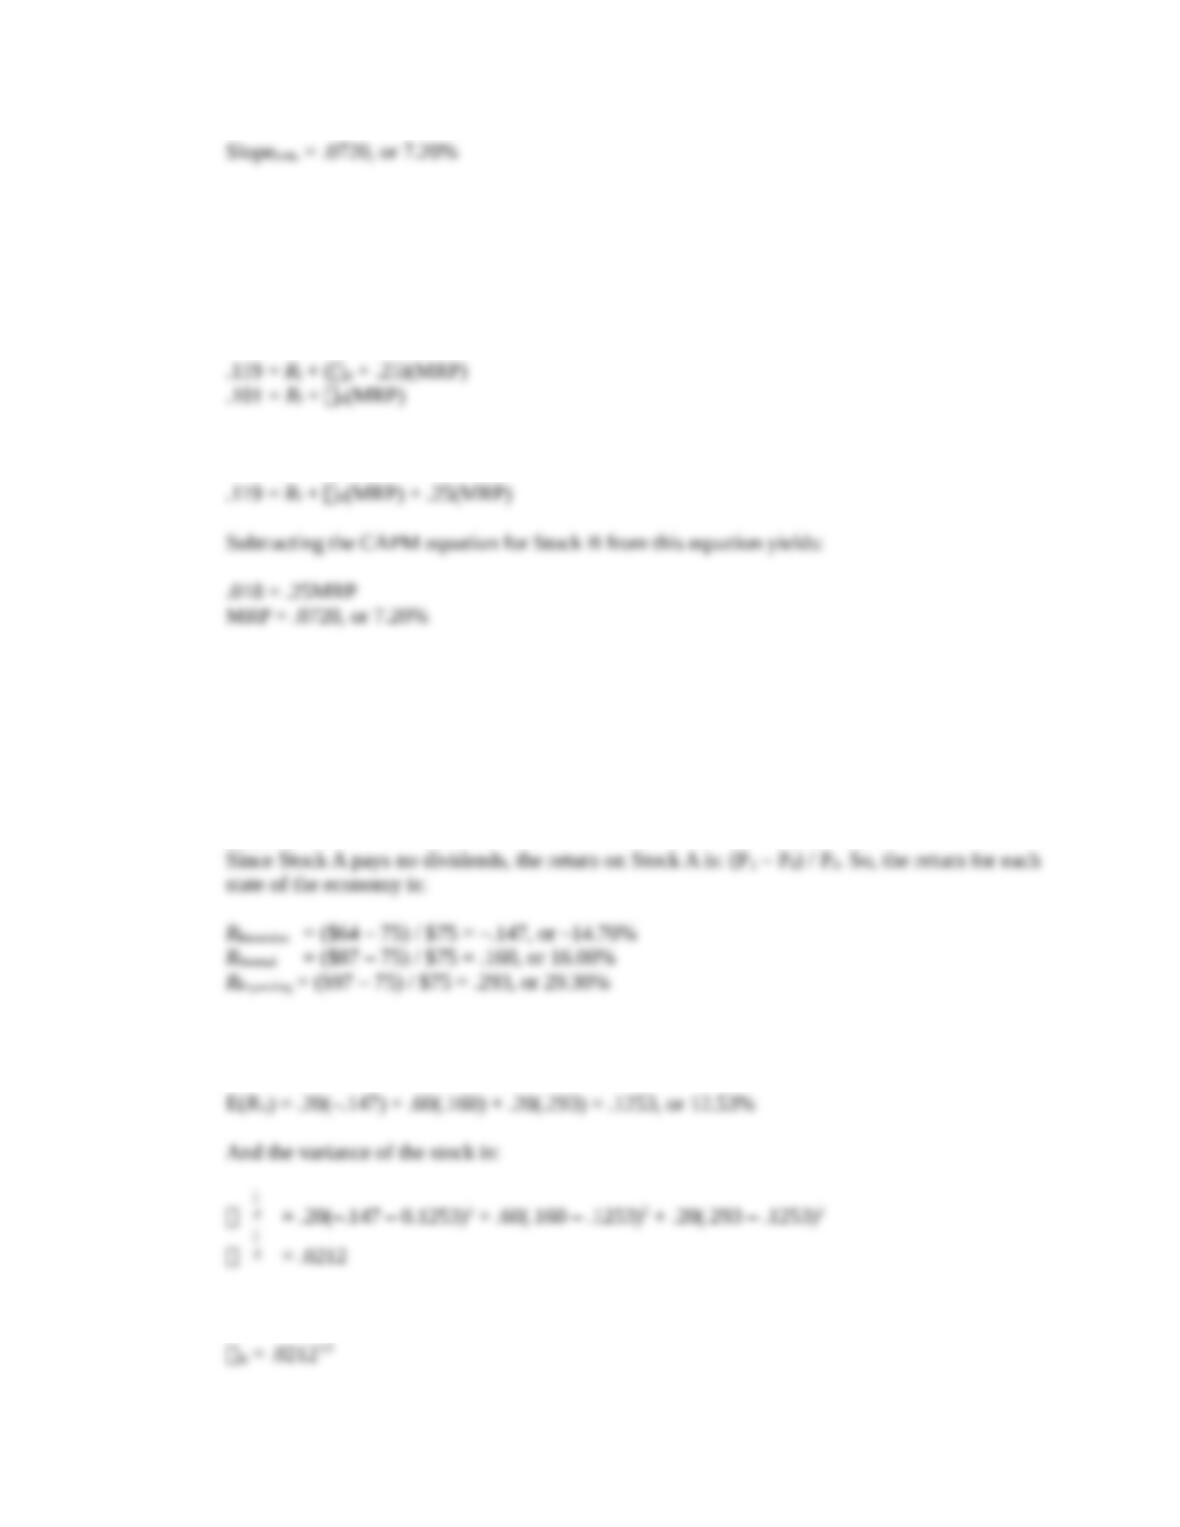
Since the market’s beta is 1 and the risk-free rate has a beta of zero, the slope of the Security
Market Line equals the expected market risk premium. So, the expected market risk premium
must be 7.2 percent.
We could also solve this problem using CAPM. The equations for the expected returns of the
two stocks are:
We can rewrite the CAPM equation for Stock A as:
which is the same answer as our previous result.
37. a. A typical, risk-averse investor seeks high returns and low risks. For a risk-averse investor
holding a well-diversified portfolio, beta is the appropriate measure of the risk of an individual
security. To assess the two stocks, we need to find the expected return and beta of each of the
two securities.
Stock A:
The expected return of an asset is the sum of the probability of each return occurring times the
probability of that return occurring. So, the expected return of the stock is:
Which means the standard deviation is:
6
CHAPTER 11 –
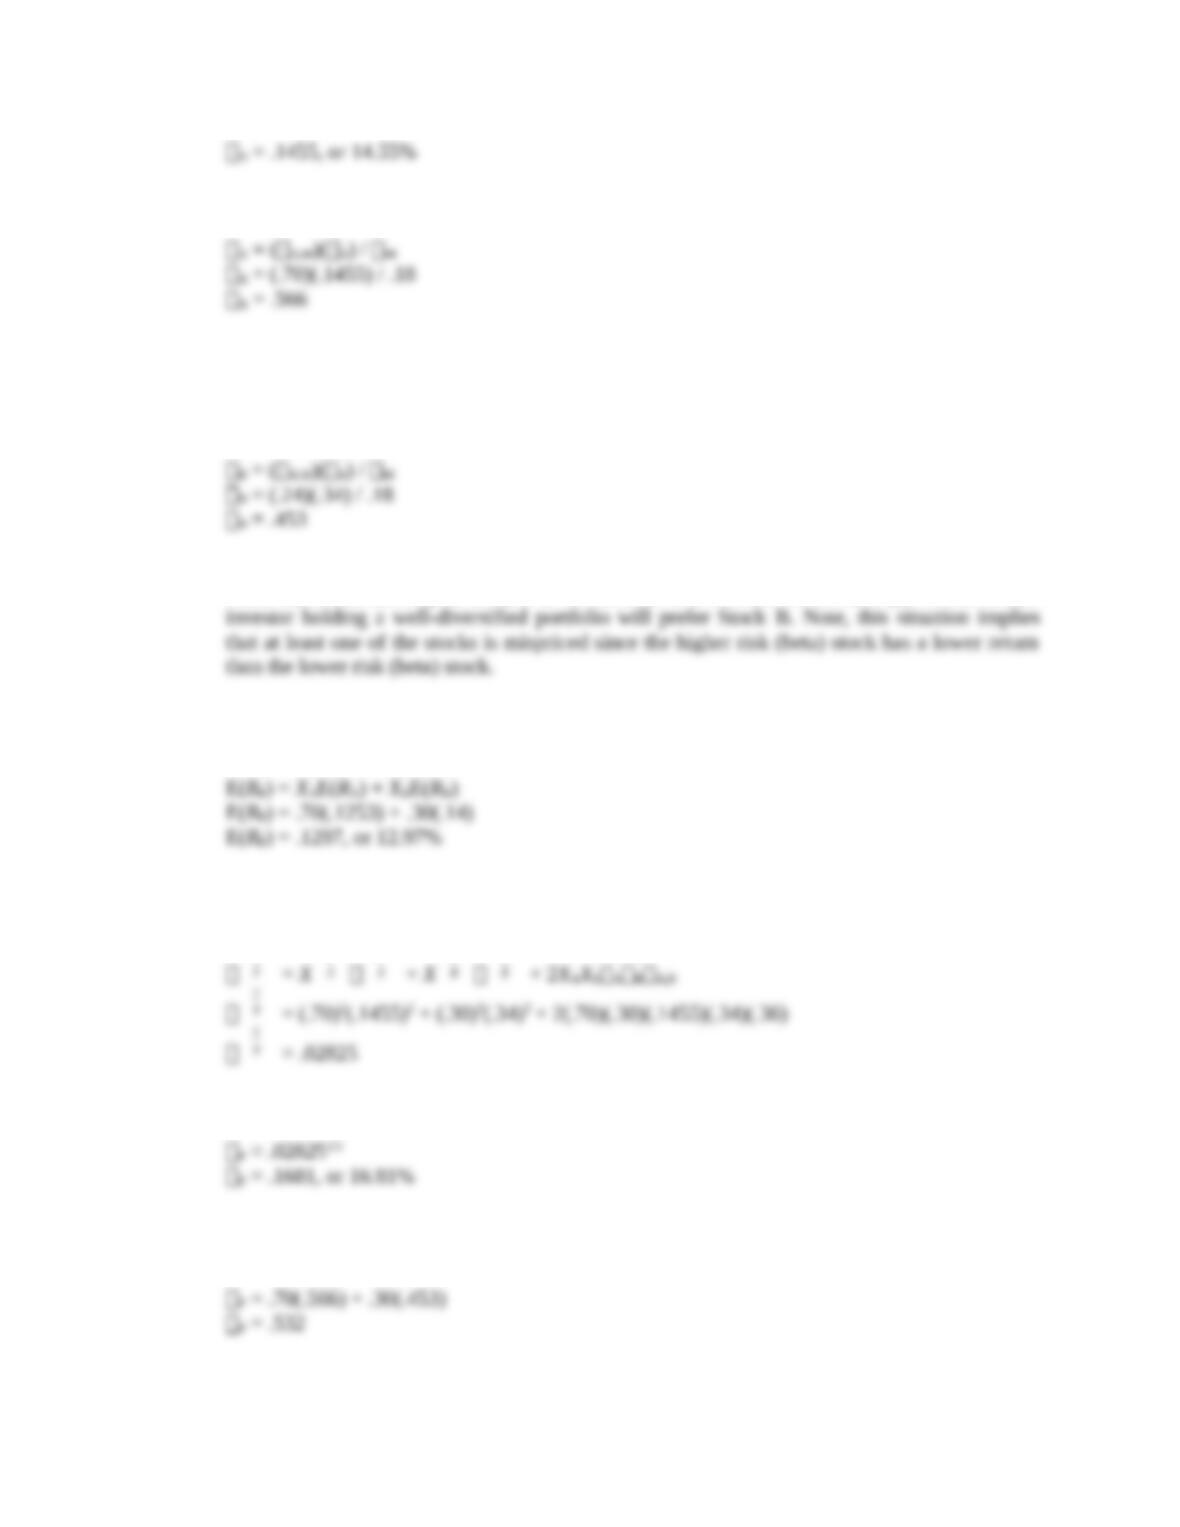
Now we can calculate the stock’s beta, which is:
For Stock B, we can directly calculate the beta from the information provided. So, the beta for
Stock B is:
Stock B:
The expected return on Stock B is higher than the expected return on Stock A. The risk of
Stock B, as measured by its beta, is lower than the risk of Stock A. Thus, a typical risk-averse
b. The expected return of the portfolio is the sum of the weight of each asset times the expected
return of each asset, so:
To find the standard deviation of the portfolio, we first need to calculate the variance. The
variance of the portfolio is:
2
2
2
2
2
2
7
CHAPTER 11 –
2
2
2
2
2
2
2
2
2
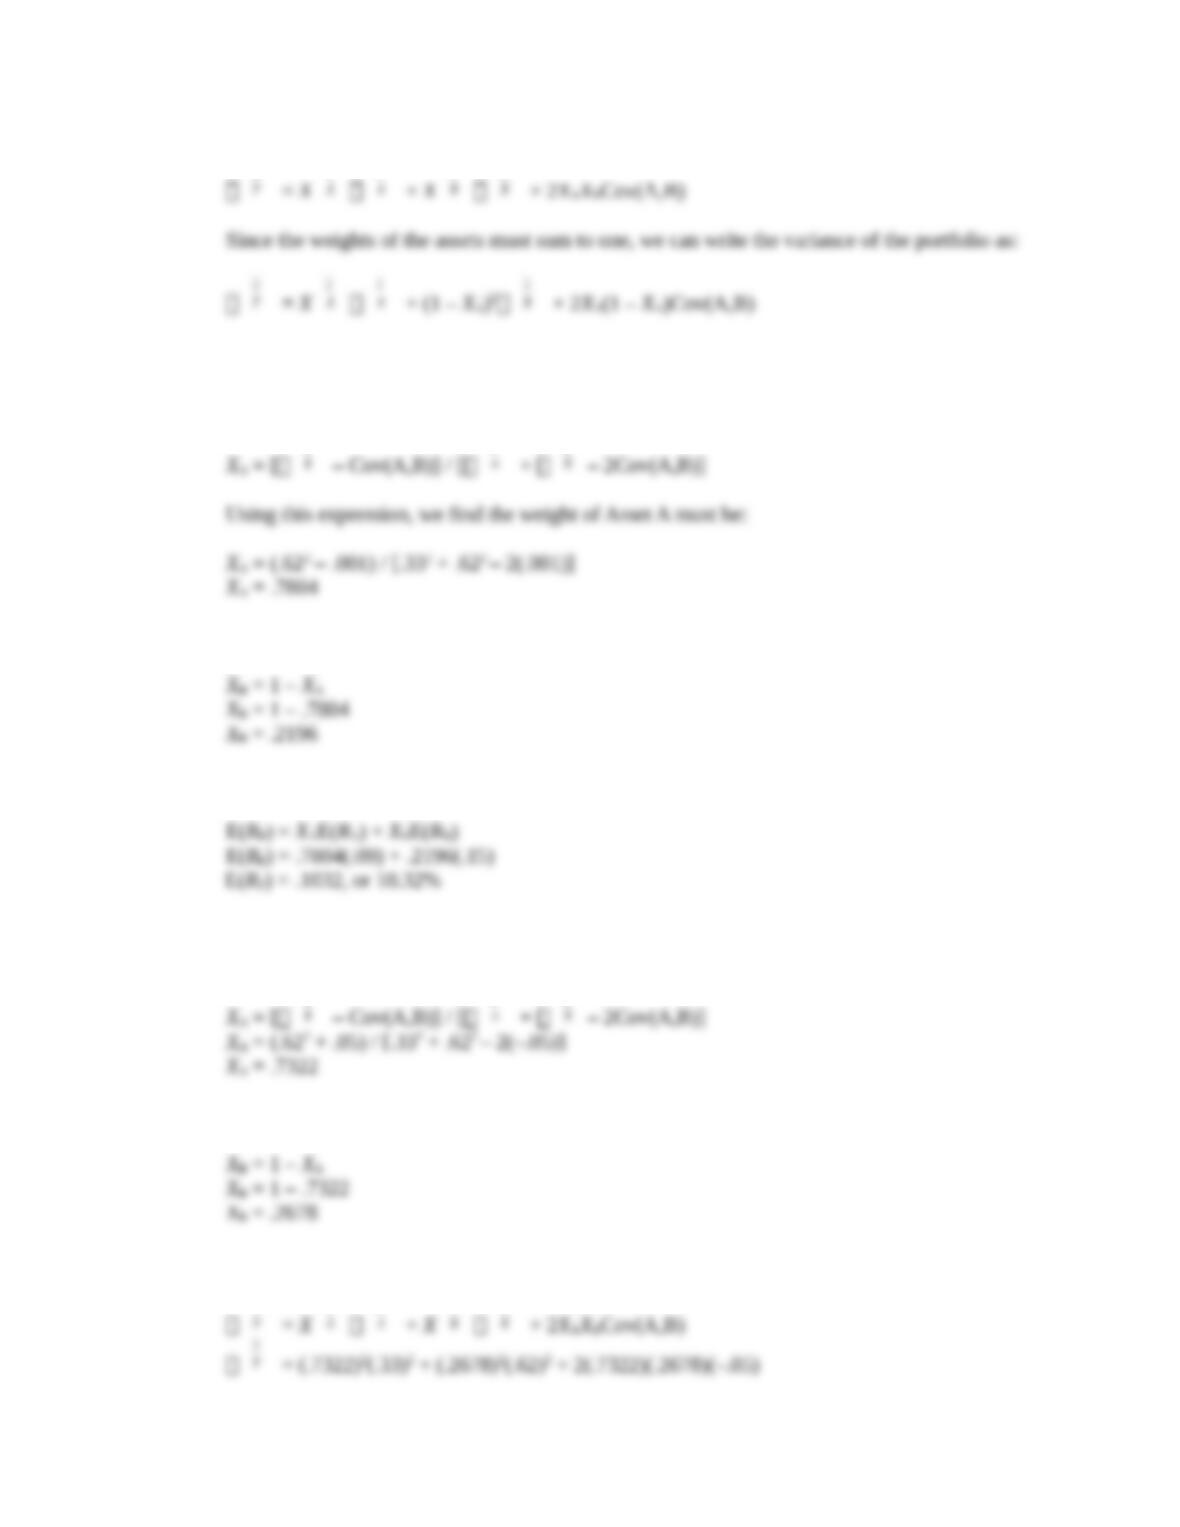
To find the minimum for any function, we find the derivative and set the derivative equal to
zero. Finding the derivative of the variance function with respect to the weight of Asset A,
setting the derivative equal to zero, and solving for the weight of Asset A, we find:
2
2
2
This implies the weight of Stock B is:
b. Using the weights calculated in part a, the expected return of the portfolio is:
c. Using the derivative from part a, with the new covariance, the weight of each stock in the
minimum variance portfolio is:
2
2
2
This implies the weight of Stock B is:
d. The variance of the portfolio with the weights on part c is:
2
2
2
2
2
2
8

And the standard deviation of the portfolio is: