CHAPTER 10 –
14. The return of any asset is the increase in price, plus any dividends or cash flows, all divided by the
initial price. This preferred stock paid a dividend of $3.50, so the return for the year was:
15. The return of any asset is the increase in price, plus any dividends or cash flows, all divided by the
initial price. This stock paid no dividend, so the return was:
This is the return for three months, so the APR is:
And the EAR is:
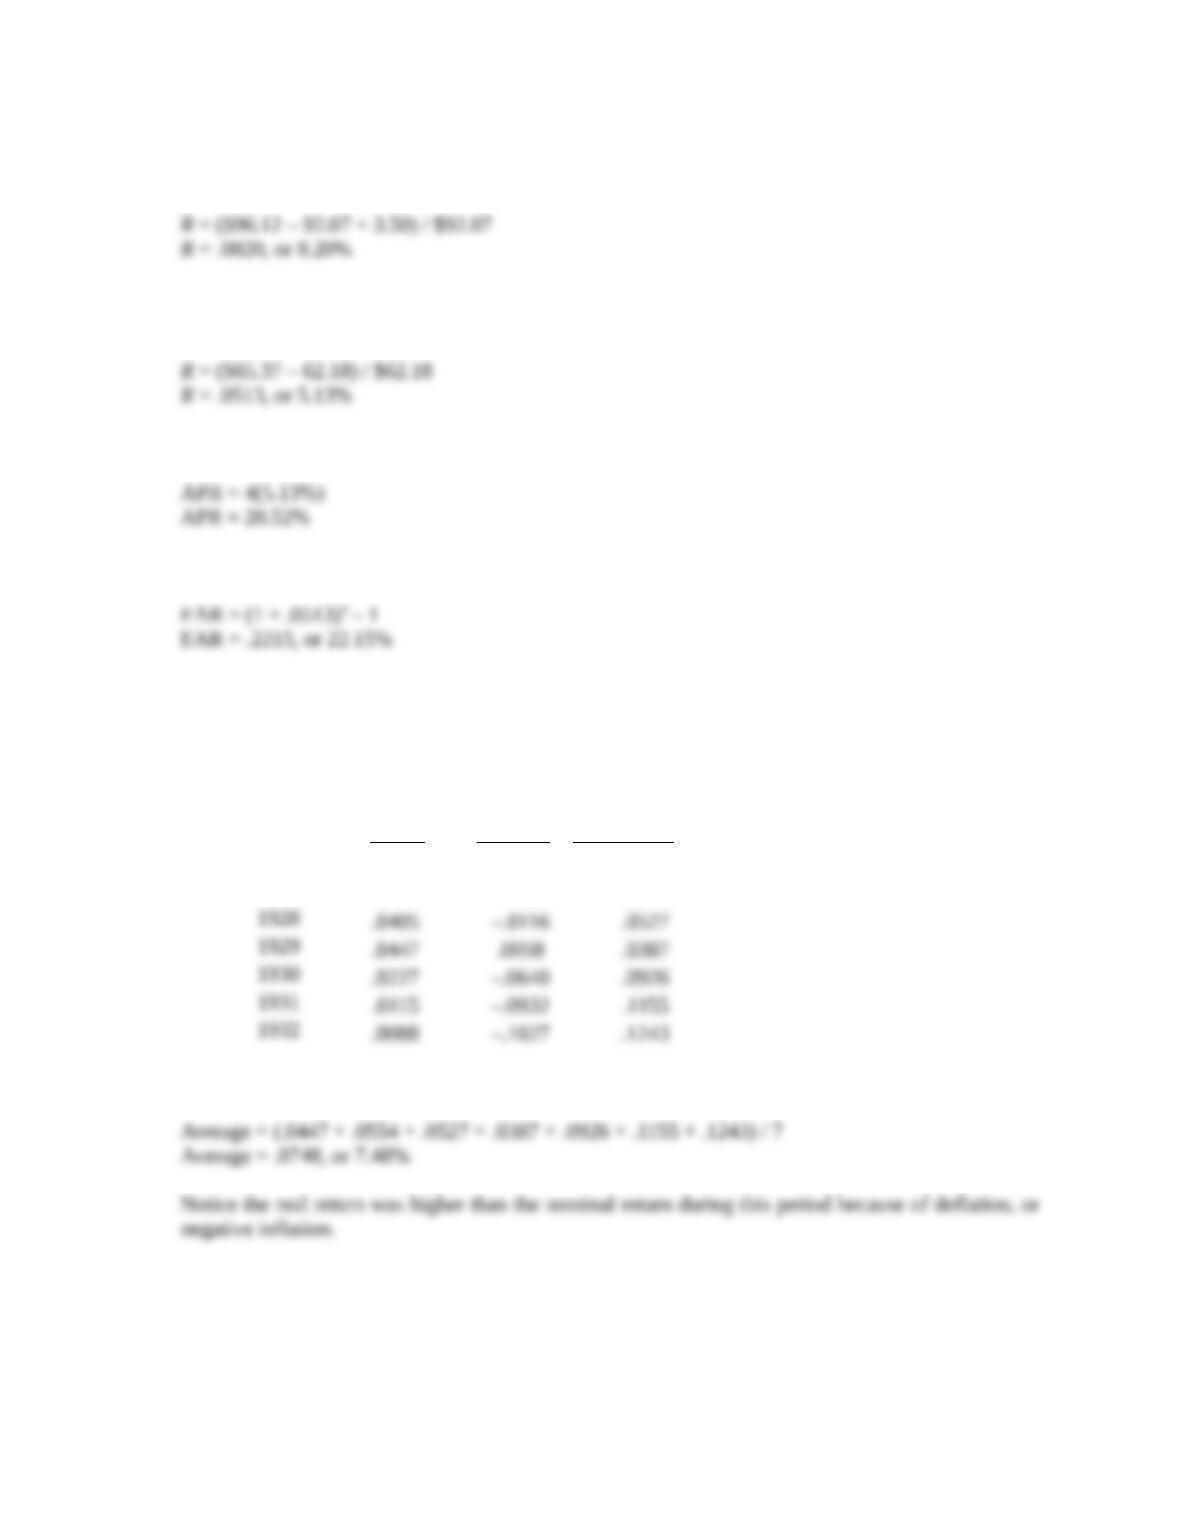
16. To find the real return each year, we will use the Fisher equation, which is:
1 + R = (1 + r)(1 + h)
Using this relationship for each year, we find:
T-bills Inflation Real Return
1926 .0330 –.0112 .0447
1927 .0315 –.0226 .0554
So, the average real return was:
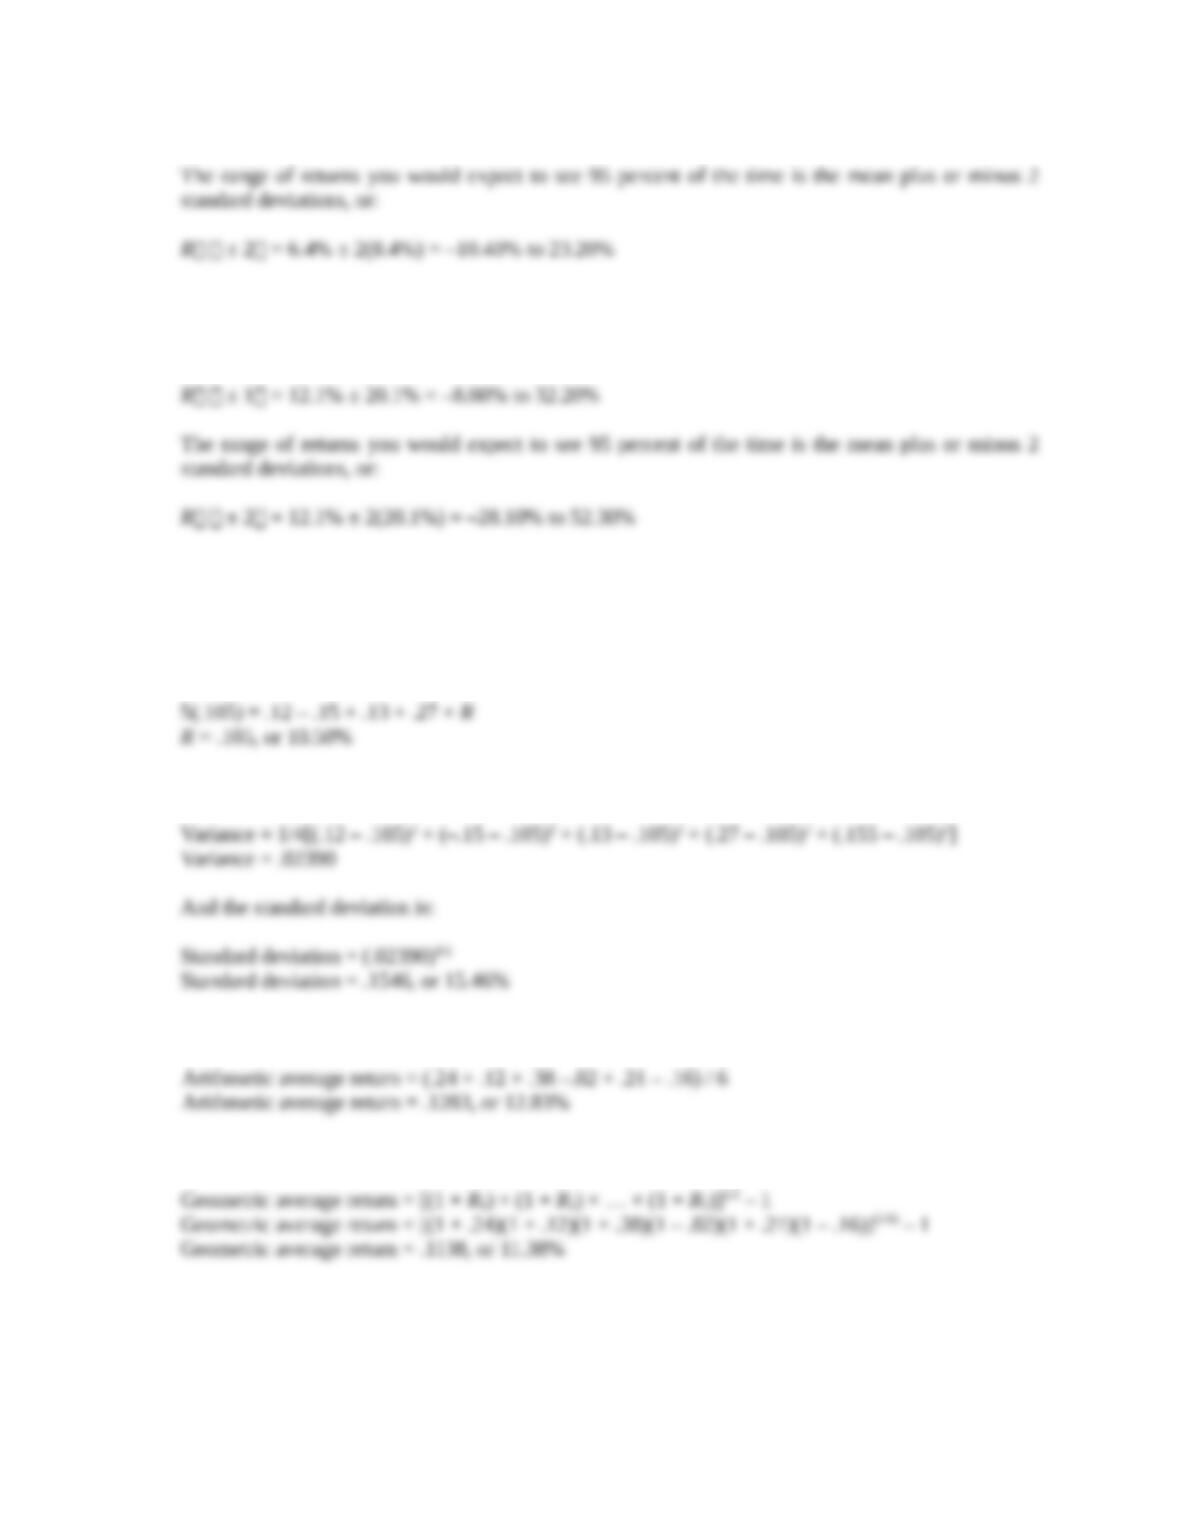
17. Looking at the long-term corporate bond return history in Table 10.2, we see that the mean return
was 6.4 percent, with a standard deviation of 8.4 percent. The range of returns you would expect to
see 68 percent of the time is the mean plus or minus 1 standard deviation, or:
R ± 1 = 6.4% ± 8.4% = –2.00% to 14.80%
1
CHAPTER 10 –
18. Looking at the large-company stock return history in Table 10.2, we see that the mean return was
12.1 percent, with a standard deviation of 20.1 percent. The range of returns you would expect to see
68 percent of the time is the mean plus or minus 1 standard deviation, or:
Intermediate
19. Here we know the average stock return, and four of the five returns used to compute the average
return. We can work the average return equation backward to find the missing return. The average
return is calculated as:
The missing return has to be 15.5 percent. Now we can use the equation for the variance to find:
20. The arithmetic average return is the sum of the known returns divided by the number of returns, so:
Using the equation for the geometric return, we find:
Remember, the geometric average return will always be less than the arithmetic average return if the
returns have any variation.
2
CHAPTER 10 –
21. To calculate the arithmetic and geometric average returns, we must first calculate the return for each
year. The return for each year is:
R1 = ($77.98 – 73.18 + 1.15) / $73.18 = .0813, or 8.13%
R2 = ($69.13 – 77.98 + 1.25) / $77.98 = –.0975, or –9.75%
The arithmetic average return was:
22. To find the real return we need to use the Fisher equation. Re-writing the Fisher equation to solve for
the real return, we get:
r = [(1 + R)/(1 + h)] – 1
So, the real return each year was:
Year T-bill return Inflation Real return
1973 .0729 .0871 –.0131
1974 .0799 .1234 –.0387
1975 .0587 .0694 –.0100
a. The average return for T-bills over this period was:
And the average inflation rate was:
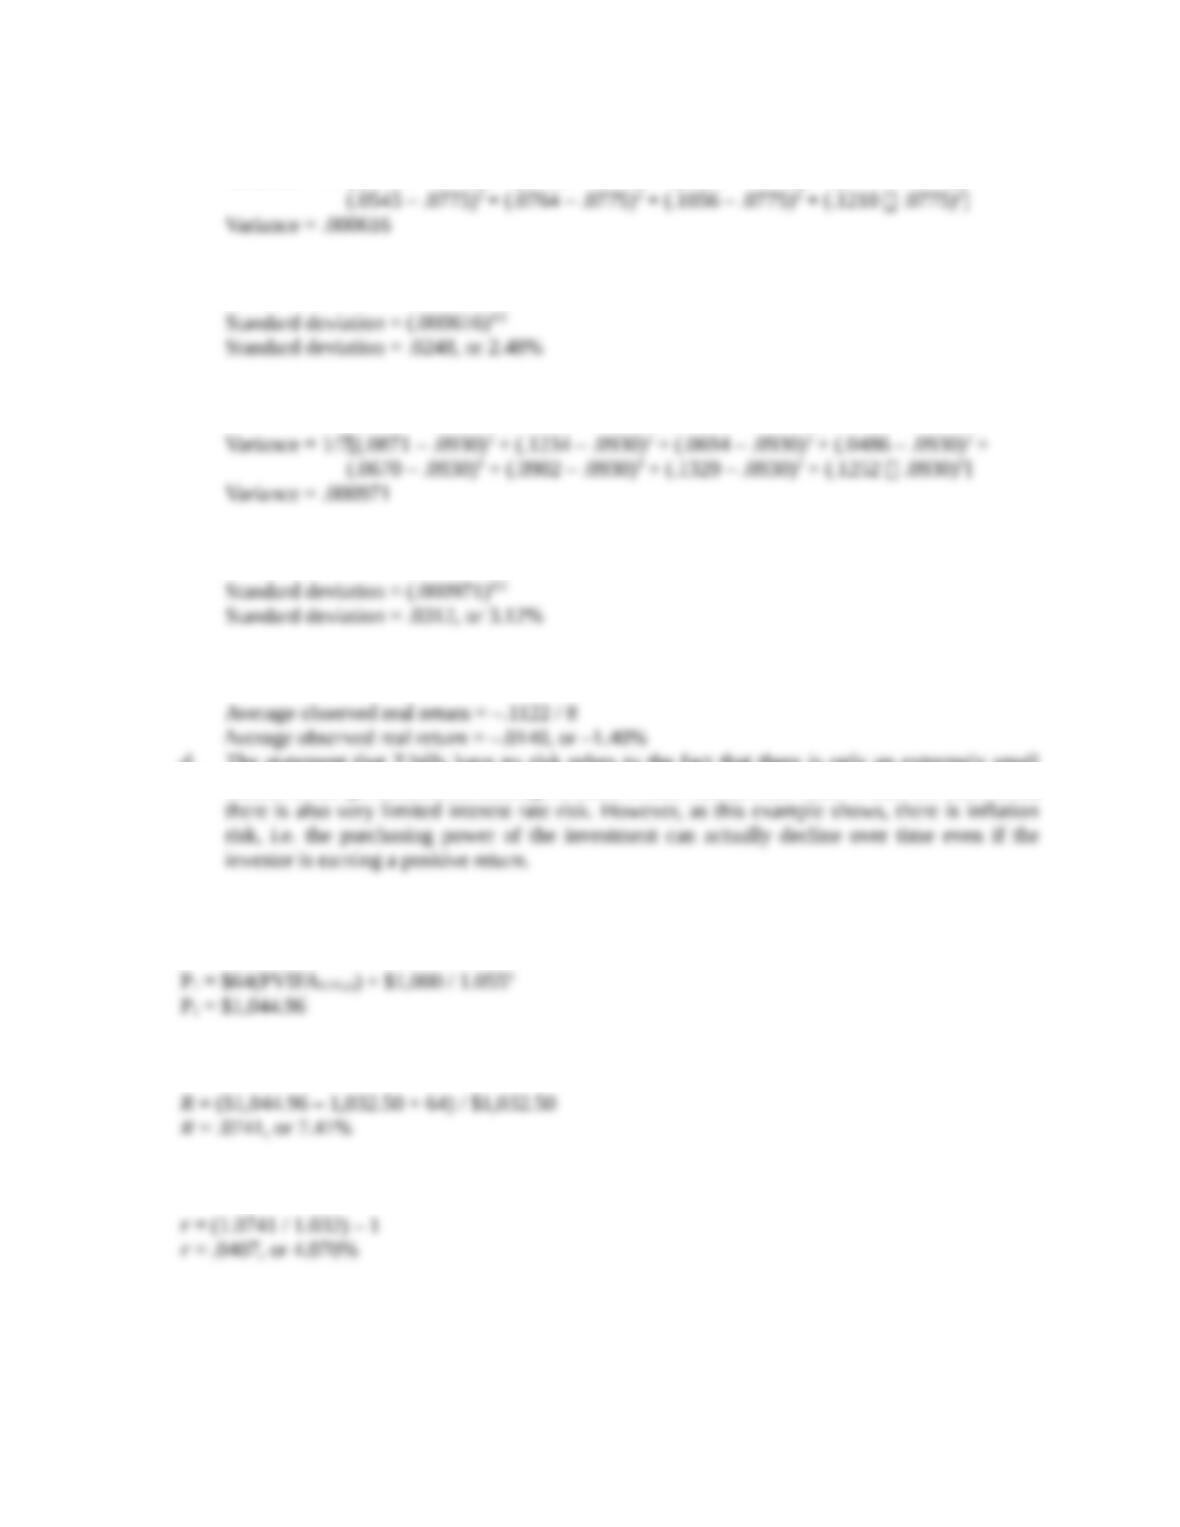
b. Using the equation for variance, we find the variance for T-bills over this period was:
3
CHAPTER 10 –
Variance = 1/7[(.0729 – .0775)2 + (.0799 – .0775)2 + (.0587 – .0775)2 + (.0507 – .0775)2 +
And the standard deviation for T-bills was:
The variance of inflation over this period was:
And the standard deviation of inflation was:
c. The average observed real return over this period was:
d. The statement that T-bills have no risk refers to the fact that there is only an extremely small
chance of the government defaulting, so there is little default risk. Since T–bills are short term,
23. To find the return on the coupon bond, we first need to find the price of the bond today. Since one
year has elapsed, the bond now has six years to maturity, so the price today is:
You received the coupon payments on the bond, so the nominal return was:
And using the Fisher equation to find the real return, we get:
24.Looking at the long-term government bond return history in Table 10.2, we see that the mean return
was 6.1 percent, with a standard deviation of 10 percent. In the normal probability distribution,
approximately 2/3 of the observations are within one standard deviation of the mean. This means that
1/3 of the observations are outside one standard deviation away from the mean. Or:
4
CHAPTER 10 –
You can use the z-statistic and the cumulative normal distribution table to find the answer as well.
Doing so, we find:
z = (X – µ) /
z = (–3.9% – 6.1) / 10% = –1.00
Looking at the z-table, this gives a probability of 15.87%, or:
25.The mean return for small company stocks was 16.7 percent, with a standard deviation of 32.1
percent. Doubling your money is a 100% return, so if the return distribution is normal, we can use
the z-statistic. So:
This corresponds to a probability of .473%, or about once every 200 years. Tripling your money
would be:
26. It is impossible to lose more than 100 percent of your investment. Therefore, return distributions are
Challenge
27. Using the z-statistic, we find:
5
CHAPTER 10 –
28. For each of the questions asked here, we need to use the z-statistic, which is:
z = (X – µ) /
a. z1 = (10% – 6.4%) / 8.4% = .4286
This z-statistic gives us the probability that the return is less than 10 percent, but we are looking
for the probability the return is greater than 10 percent. Given that the total probability is 100
percent (or 1), the probability of a return greater than 10 percent is 1 minus the probability of a
return less than 10 percent. Using the cumulative normal distribution table, we get:
b. The probability that T-bill returns will be greater than 10 percent is:
c. The probability that the return on long-term corporate bonds will be less than –4.18 percent is:
z5 = (–4.18% – 6.4%) / 8.4% = –1.2595
6